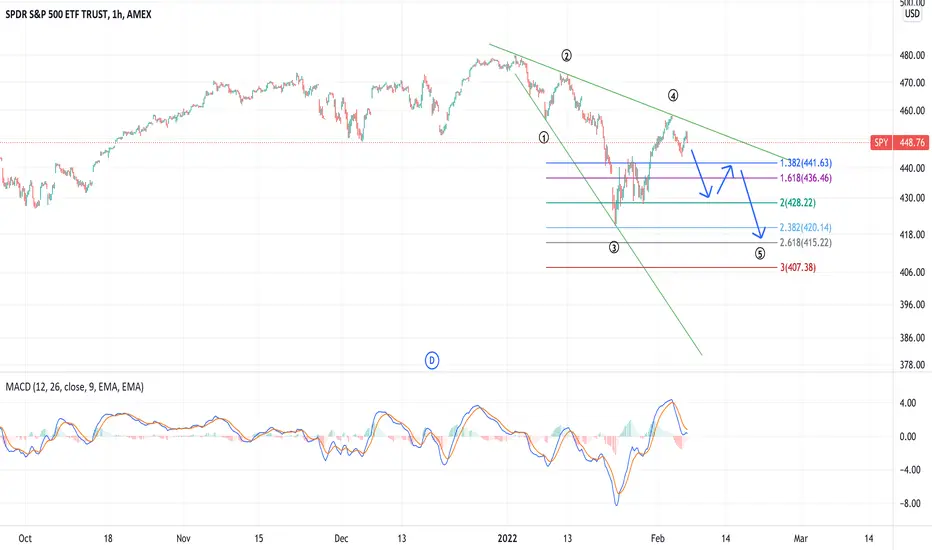
SPY Possible DOJI candle reaction - October & December had continuations off this though set up is slightly different. Fed minutes tomorrow & Russia tensions rising. Will play a factor.
Spy500

$SPYThe investment seeks to provide investment results that, before expenses, correspond generally to the price and yield performance of the S&P 500 Index. The Trust seeks to achieve its investment objective by holding a portfolio of the common stocks that are included in the index (the "Portfolio"), with the weight of each stock in the Portfolio substantially corresponding to the weight of such stock in the index.

$SPY Bearish PennantThe investment seeks to provide investment results that, before expenses, correspond generally to the price and yield performance of the S&P 500 Index. The Trust seeks to achieve its investment objective by holding a portfolio of the common stocks that are included in the index (the "Portfolio"), with the weight of each stock in the Portfolio substantially corresponding to the weight of such stock in the index.

$SPY slight dip then uptrend...The Trust seeks to achieve its investment objective by holding a portfolio of the common stocks that are included in the index (the âPortfolioâ), with the weight of each stock in the Portfolio substantially corresponding to the weight of such stock in the index.

SPY STOCK: Week SPY Friday Feb 11TraderMan PennyPorkChop looks out for opportunity to survey and examine the latest value activity in the market in a way that makes it helpful to you.
Utilizing Technical Analysis, I play out an insiders view of the activity in the financial exchanges today and gives you my Day Trading of 6 years of Trading Volatile current market , examining market patterns , and interpreting of where the market is going.
TraderMan PennyPorkChop Focus incorporates - Specialized Analysis - Exchange and market Education - Pattern and Pattern Analysis - Market Psychology - and Trading Mental Health.
👉 If you enjoy this video, Please like and share it.
👉 Don't forget to subscribe to this channel and press the bell 🔔 for more updates.
SPY Stock Analysis - S&P 500 SPDR ETF Stock Price Prediction for Tomorrow Thursday
February 7.th
We go over the SPY stock - S&P 500 SPDR ETF stock, and give our stock price prediction on the SPY stock, our SPY stock price analysis, and stock price forecast on SPY for tomorrow Monday February 7th .
SPY STOCK: THIS IS A SPY STOCK PRICE PREDICTION, SPY STOCK PRICE ANALYSIS, AND A SPY STOCK PRICE FORECAST VIDEO.
. My Ideal Views are looking for new ways to think about Trading.
. No BS Technical Analysis that works, period.
. Day Trading and Swing Trading.
. New Traders Welcome.
.Swing Traders Welcome.
. You get Daily SPY STOCK pre and Post Market and the Price Spy ETF price predictions Weekend editions.
. TESLA stock along with TESLA share Price including Tesla After Hours.
DISCLAIMER: No financial advice, the information on this channel is provided for education and informational purposes only, without any express or implied warranty of any kind, including warranties of accuracy, completeness, or fitness for any particular purpose. The information contained in or provided from or through this channel is not intended to be and does not constitute financial advice, investment advice, trading advice or any other advice. The information on this channel and provided from or through this channel is general in nature and is not specific to you the User or anyone else. You should not make any decision, financial, investment, trading or otherwise, based on any of the information presented on this channel without undertaking independent due diligence and consultation with a professional broker or financial advisory.

Daily SPY Update BaybEE!TraderMan PennyPorkChop looks out for opportunity to survey and examine the latest value activity in the market in a way that makes it helpful to you.
Utilizing Technical Analysis, I play out an insiders view of the activity in the financial exchanges today and gives you my Day Trading of 6 years of Trading Volatile current market , examining market patterns , and interpreting of where the market is going.
TraderMan PennyPorkChop Focus incorporates - Specialized Analysis - Exchange and market Education - Pattern and Pattern Analysis - Market Psychology - and Trading Mental Health.
👉 If you enjoy this video, Please like and share it.
👉 Don't forget to subscribe to this channel and press the bell 🔔 for more updates.
SPY Stock Analysis - S&P 500 SPDR ETF Stock Price Prediction for Tomorrow
We go over the SPY stock - S&P 500 SPDR ETF stock, and give our stock price prediction on the SPY stock, our SPY stock price analysis, and stock price forecast on SPY for tomorrow Fri February 4th.
SPY STOCK: THIS IS A SPY STOCK PRICE PREDICTION, SPY STOCK PRICE ANALYSIS, AND A SPY STOCK PRICE FORECAST VIDEO.
. My Ideal Views are looking for new ways to think about Trading.
. No BS Technical Analysis that works, period.
. Day Trading and Swing Trading.
. New Traders Welcome.
.Swing Traders Welcome.
. You get Daily SPY STOCK pre and Post Market and the Price Spy ETF price predictions Weekend editions.
. TESLA stock along with TESLA share Price including Tesla After Hours.
DISCLAIMER: No financial advice, the information on this channel is provided for education and informational purposes only, without any express or implied warranty of any kind, including warranties of accuracy, completeness, or fitness for any particular purpose. The information contained in or provided from or through this channel is not intended to be and does not constitute financial advice, investment advice, trading advice or any other advice. The information on this channel and provided from or through this channel is general in nature and is not specific to you the User or anyone else. You should not make any decision, financial, investment, trading or otherwise, based on any of the information presented on this channel without undertaking independent due diligence and consultation with a professional broker or financial advisory.
____________

S&P500 , spy&P500 US Market Index..
Struggling to survive!
It is worth noting that the movement of Bitcoin recently "according to my opinion"
She has become very sensitive to the movement of this indicator, especially in the recent times.
All eyes are on the market opening tomorrow .

The bottom is NOT in on SPYSPY appears to be in an ending diagonal, like many other stocks, including AMD. I expect this to resolve with a double-bottom or a slightly lower low by February 18. After that, SPY will be set to set new ATHs.
$SPYFund Summary
The Trust seeks to achieve its investment objective by holding a portfolio of the common stocks that are included in the index (the âPortfolioâ), with the weight of each stock in the Portfolio substantially corresponding to the weight of such stock in the index.

Analysis of S&P500The main reason behind this analysis on top of technical analysis are the fundamental reasons:
Premise: Market is NOT in recession as...
1) Oil/Yields are not dropping
Refer to historical bear markets for reference
2) PMI above 50
During recession, PMI will contract below 50
3) W5 is missing
The elusive w5 has been missing from many Elliott Wave counters and this analysis explains it.
4) The effect of QT and rates hike will take 1-2 years to flow into the market
Refer to historical hikes for reference
Short/Mid Term (End of 2022): Bullish W5
Long Term (2023-2024): Bearish
-Divergence on momentum oscillators
-Oil, yield and market will be strongly correlated during this drop
Thank you everyone for reading my idea.

Is The Stock Market In A Bull Trap? Open Option Analysis and TA!We know the stock market is highly volatile with the VIX above 20 and daily moves at above 2-3% but what if we are in a bigger bull trap scenario?

SPY 200MA retest incoming.. Still.Hello Traders,
We've seen a pretty bullish start to the week. AAPL is what, 8pts from it's ATH's.. Pretty impressive numbers in that ER, but with the volatility we're seeing it's still a little surprising.
I'm not going to say we're entirely out of the woods yet, but what I will say... The doom and gloom that blasted the frontpage everywhere was quite a bit overplayed. Geopolitics is still a non-starter (with the exception of barrel prices.. no one cares right now), and rising rates are a mixed bag, they will push inflation downward and the banks/high cash balance sheet companies (think AAPL/GOOG/BRK.A/BRK.B), will be essentially unaffected or given a competitive edge against startups/small-cap growth.
I think we will see more volatility as the year progresses, however, I don't think it will be exceptionally different than other midterm years.
We may hang around the 200MA a little longer than a Bull or a Bear would hope, but we'll definitely see pops in both directions.
Again, retest of the SPY 200MA is imminent.. Still!
Could even hit the gap-up and later retest it as support.
Good luck traders.
Cheers,
Mike
(UPRIGHT Trading)

OhS**** Bull Trap S&P Market Breakdown Monday. Premarket Upd TraderMan PennyPorkChop looks out for opportunity to survey and examine the latest value activity in the market in a way that makes it helpful to you.
Utilizing Technical Analysis, I play out an insiders view of the activity in the financial exchanges today and gives you my investing 6 years of Trading Volatile current market , examining market patterns , and interpreting of where the market is going.
TraderMan PennyPorkChop Focus incorporates - Specialized Analysis - Exchange and market Education - Pattern and Pattern Analysis - Market Psychology - and Trading Mental Health.
. My Ideal Views are looking for new ways to think about Trading.
. No BS Technical Analysis that works, period.
. Day Trading and Swing Trading.
.New Traders Welcome.
.Swing Traders Welcome.
If you need long term and Value investing your probably not going to learn what I have to share. My Trading periods are 1 min to 21 Days. But you are still welcome, because we do have valuable Lessons for all traders

SPX Looking to retest the 200.Hello Traders -
After the last few trading sessions you're probably almost convinced that the sky is going to fall out, that geopolitics are an issue right this moment, and that we're headed for a crash. I'd like to let you in on a little secret... When everyone thinks there will be a crash, there isn't one.
Now don't get me wrong, we did just have a solid pullback from ATH's, and while it wasn't a small pullback, we did complete an IHS pattern and hit it's target pretty accurately. Then after gapping down to recession territory, shortly before FOMC's meeting probably had some Bulls a little worried.
Personally, I don't think Geopolitics is yet factored into any market movement. The pullback was more related to COVID resurgence causes uncertainty, and if there is one thing the market doesn't like.. It's that. Not only this, midterm election interest has been pulled forward and midterm years are almost always more volatile. Lastly, inflation worries. These are the big 3 currently affecting the market, could the Ukraine situation become an issue for the markets? Well possibly, but I can't imagine it having an affect anywhere close to the China Trade War, because that actually directly affected the markets (i.e. tariff and embargos between two extremely active traders). With more reliance on Clean energy the geopolitical posturing on the border of Ukraine will mean even less for the US and its allies.
With all of that out of the way, back to a quick technical analysis. Looks like we will see another retest of the 200MA very soon. This should give us an idea of where we go from here.
Cheers,
Mike

S&P 500 - How Deep Will This Correction Go?Since the Covid crash, the Stock Market has been on an unstoppable steep upwards trajectory. This carried out through 2020 and the whole 2021. I've never seen the Stock Market climb this high and this short amount of time. With the current state of the economy with rising inflation, food & supply shortages, spending cuts and coming interest rate hikes... I do not believe that we can continue at this pace in 2022 without a deeper correction. We drank the juice and got caught up in the overly bullish mentality.
We have to remember the laws of Supply and Demand. Markets never go up at this steep without a steep correction at some point. I'm seeing the 3,500 - 3,800 range (38-50%) as a likely area that this correction may fall to. I could see it falling as low as 3,200 - 3,500 (50-68%) as well. It may fall straight down into these areas or it make take place over the next couple of months but these are the areas I'm watching.
I'd be weary of being overly aggressive with continuing to buy at this time. It is possible that many retail investors/traders will get bull trapped. They may take this market up just a little more and then drive it down further. When there's a lot of uncertainty, it's not a terrible idea to just hold your money and until the market has bottoms out before getting aggressive with buying again. And as of now, it is not clear if this is the bottom yet.

🔥 Bitcoin Following Stock Market Double Crash Fractal?Bitcoin is currently in the middle of a very strong correction, with this week being the most volatile (bearish) week we've got since the May-21 correction. Yet, the correction might go even deeper.
It has become apparent that BTC is following a pattern that we've seen before in recent history. When you look closely you can clearly see that BTC is mimicking the stock market from 1997-2009.
A double top, correction, and reversal which was slightly deeper than the previous support, making a fake-out.
After this fake-out, a massive reversal took place, which stocks have been enjoying for over 13 years now.
This is a highly subjective analysis. For a start, the SP500 chart is based on monthly candles where the BTC chart is on weekly candles. Not saying that we're going to exactly follow this pattern, but it offers a decent long-term perspective nevertheless.
Happy trading!

SPY, SPX, the Markets right now.Hello Traders,
Every once in awhile there are times where I think every trader might want to take a step back and look at the macro-environment, even the technical traders.
Historically, midterm years do often have pullbacks - they usually have their affects later in the year; however, we're seeing that midterms are relevant now. Within this macro-environment. This pullback is quite similar to the one we had in Sept/Oct. Pay attention to that Daily 200 or Weekly 50.
Bulls hope for a bounce, Bears want a break, of course. IF there is one, I'm looking at around 434, 426, 417. If we bounce here or shortly after here: 447, 450, maybe around 460 before some churn PA (range bound price action). Remember: these years are more volatile, so caution is key, maybe half your normal risk.
With all of that said, so far, the price bounced almost to the penny off the trendline I drew last night and a fib on my algo. I also calculated a max price drawdown estimate from the chart pattern (worst case scenario) it's only a little bit lower, right on the Daily 200 about 438.96.
Another personal guess: after today slow decline over a few days to to 434-8ish then a small bounce, small pb, then return to uptrend, but I'm getting way ahead with data we don't have yet, so we shall see what the 1st move is and go from there.
Cheers,
Mike

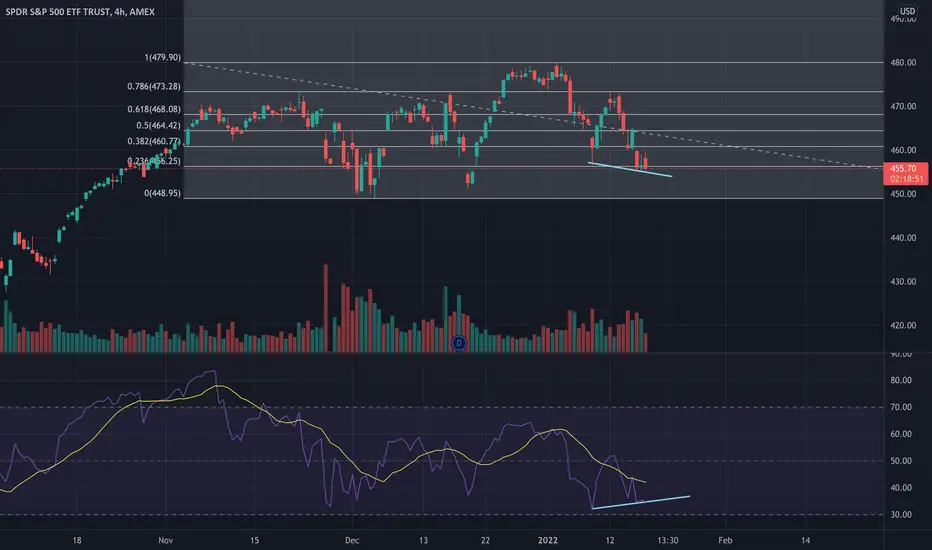
$SPY Critical levelsAMEX:SPY is at very critical levels right now. 50EMA on the weekly chart is support, if it breaks we're back in the megaphone pattern which can lead to drastic bear market

S&P500 INDEX - BULLISH MOVE 🚀waiting for breakout & retest
TARGET: 4795 🎯
1️⃣.trade carefully and have stop loss for sure
2️⃣.trade only when the market is clearly bullish or bearish
3️⃣.without discipline every strategy is useless
4️⃣.your best teacher is your last mistake

ES1! / Emini / SPY500 : BullishES1! / Emini / SPY500 is approaching liquidity reference points - and there's an unmitigated OB+ sitting right below it.
This "could" be where ES1! finds support for the next swing up.
Play this on a lower time frame like 4H/etc.
GLGT

SPX SPY BOUNCE ZONEAMEX:SPY SP:SPX
Where I believe the decision will be made, IMO the yellow line is most likely the result if we don't see the TVC:US10Y yield rates rise more. Im Long value stocks, short Growth stocks.

SPY reversal formingSPY daily fib levels holding very well. 4 hour as you can see a bullish divergence is forming, and 4hr bear volume is decreasing as bull volume is increasing. I'm expecting a reversal to the upside by Friday entering next week. Feel free to criticize or educate me on anything additional.
SPY: Bouncing between the 50 + 100D EMASPY bouncing between the 50D above and the 100D below. Will most likely stay that way this week. Safer players will wait until $460 or $64.72 trades to make a decision on what to play. Playing in the middle won't net much gain for SPY players.
If you play SPX or ES_F you can play the middle IMO.
