SPY Bounced! - Key areas to look for SPY had a big gap down today all the way down to 427.46 (-1.65%) but managed to bounce back at close. Here are the key areas to be watch out for.
- A have some good support at the 21day EMA (426.75ish) and could play it off the bounce there for a short term play to the upside.
-A close below the 21day EMA would be a bearish sign and we could see it testing 50day EMA again as you see in the chart. If we close below 21day EMA, I would play it to the downside with a short term target on the 50DAY EMA.
-Going all the way down to the 50DAY EMA would be considered as a small correction. That's about another 2.44% downside from where we're at now. If we somewhow get a mini correction all the way down to 50DAY EMA, this is where I would load up on calls as this has been a major major support in the past couple months.
AMEX:SPY
Spy500

US Market Technicals Ahead (5 July – 9 July 2021)US Markets will be closed on Monday in observance of Independence Day. Investors will be waiting for the FOMC minutes due on Wednesday for further clarification on the next monetary policy steps after a hawkish shift prompted market turbulence last month.
Elsewhere, the European Central Bank (ECB) will also publish the minutes of its latest meeting, while China will release what will be closely watched inflation figures.
Here is what you need to know to start your week.
S&P500 (US Market)
The benchmark index $SPX rallies furthered its all time high establishment, gaining +1.48% (+63.4 points) to close at 4,439 level during the week.
The price ascend have allowed $SPX to break out of its trend channel resistance for the 3rd time in since February 2021. It is important to remain cautious of the existing rally, as every breakout of the highlighted channel is met with price-volume divergence weakness, along with a correction towards its channel support.
The immediate support to watch for $SPX this week is at 4,220 level; a resistance turned support level, also an approximate of 4 ATR14 away from existing volatility, which is unlikely to be tested this week.
Fed minutes
The minutes of the Fed’s June meeting, when officials opened talks on tapering bond-buying and indicated interest rate increases could come sooner than previously anticipated, are due to be released on Wednesday.
The minutes are coming on the heels of Friday’s nonfarm payrolls report, which showed that the U.S. created the most jobs in 10 months in June, indicating that the economy closed out the second quarter with strong momentum as the reopening continued.
The robust data did little to ease concerns that a strong recovery and rising wages could prompt the Fed to begin unwinding its easy money policies sooner than expected.
ISM services data
The ISM index of service industry activity is set to be released on Tuesday and is expected to show continued strong growth after hitting a record high in May amid a reopening made possible by vaccinations against the coronavirus. The report could also underline ongoing labor constraints as hiring continues to lag, leading companies to offer higher wages to attract staff.
ECB minutes
The ECB is to publish the minutes of its June policy meeting on Thursday. ECB-watchers will also be on alert for news of several meetings due to take place in the coming weeks as part of the banks review of its monetary policy strategy.
The bank wants to revamp its inflation target – currently set out close to but not above 2% – and is aiming to get the review done by September.
On Wednesday, euro zone powerhouse German is to publish industrial production figures and the European Commission is to release updated economic forecasts for the European Union.
China inflation
China is to release data on both consumer price inflation and producer price inflation on Friday. Market watchers will be paying close attention to the cost of raw materials, which have soared due to higher commodity prices, and whether these increases are being passed onto the consumer.
Prices are jumping in China and around the world, adding to fears that a wave of inflation could threaten the global economic recovery if it continues.


Bullish for the weekModerate bullish expectation on the SPY till the end of the week.
Expected 1sd deviation range (based on options): $421 - $430 range.

US Market Technicals Ahead (28 June – 2 July 2021)The second quarter is ending. Global stocks are on track to post their second strongest H1 gains since the turn of the century, but the second half looks harder to predict.
All eyes turn to the US employment report on Friday, with investors hopeful for signs of improvement in the labor market after two months of slower than expected jobs growth. Meanwhile, the ISM Manufacturing PMI survey should point to a strong pace of expansion in factory activity, not far from March's 37-year high and despite the ongoing supply constraints. President Joe Biden’s $1.2 trillion infrastructure deal will continue to boost U.S. markets, but other concerns remain.
Elsewhere, OPEC+ meets on Thursday with expectation to offer guidance into the coalition's production plan. Energy traders are anticipating another production increase as the demand outlook continues to recover.
Here’s what you need to know to start your week.
S&P500 (US Market)
The benchmark index $SPX rallies to all time high, posting a weekly gain of +3.17% (+131.8 points), closing at 4,285 level. It is important to remain cautious of last week's rally as volume displayed was lacking, and seasonality is still in play. End of quarter 'window dressing' by portfolio managers could be a reason for the 'mark-up'.
$SPX have now rebounded off the breach of its 20D and 50DMA (key levels highlighted last week), remaining within the trend channel established since early November 2020. The immediate support to watch for $SPX this week is at 4,135 level; a pivot low confluence with trendline support break.
Jobs report
The June nonfarm payrolls report is expected to show that the economy added 675,000 new jobs, pushing the unemployment rate down to 5.7% from 5.8%.
With concerns over rising inflation and the strength of the recovery to the fore of investors’ minds, markets will also be looking at other labor market statistics, including wage growth and labor force participation.
Last week Federal Reserve Chairman Jerome Powell reiterated the central bank’s commitment to encouraging a "broad and inclusive" recovery in the labor market, adding that there is still a long way to go, and that support is still needed.
Economic data
Ahead of Friday’s jobs report, markets will get updates on pending home sales, ADP private sector payrolls, jobless claims and ISM manufacturing activity.
The ISM data is likely to underline strains on the supply chain that are pushing up costs, boosting the chances that inflation will remain at higher levels for longer.
OPEC+ meeting
The Organization of the Petroleum Exporting Countries and allies, known as OPEC+ will hold a series of meeting in the coming week to review the situation in the global oil market ahead of an official meeting on Thursday.
Thursday’s meeting is expected to result in another boost in output as the demand outlook continues to recover.
Oil prices climbed to their highest since October 2018 on Friday, putting both benchmarks up for a fifth week in a row.

SPY (Impulse Wave Complete) Following a completion of the Elliot Impulse Wave comes an ABC correction. Looking like a dip to the 419-420 range is likely in the next couple of days.

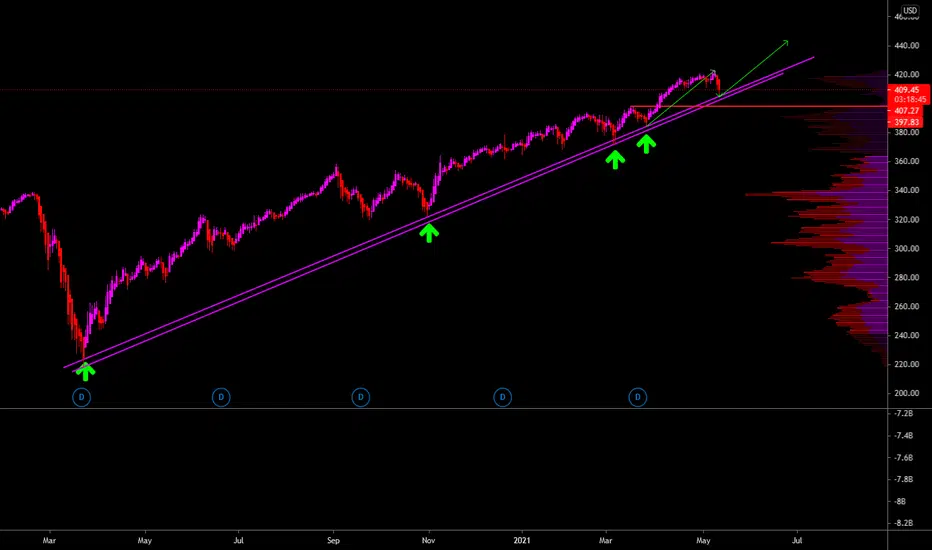
$SPY in a trying areaThe $SPY is in a very trying area.
The last 6-7 times we moved at/below the 50 moving average, we were able to bounce back up to new highs.
Bulls needs to reclaim the $419 area. If we can't bounce from this level, would not be surprised if we see $412 and $405-406.

US Market Technicals Ahead (14 June – 18 June 2021)
The Federal Reserve two-day policy meeting is the main event event for the markets this week, although the central bank is not expected to take any action but maintain an ultra-loose monetary stimulus. All eyes will turn to comments from Fed Chair Jerome Powell for clues about the central bank's latest view on inflation.
While the outcome of the Fed meeting will take the limelight, investors will also be looking closely at economic data on U.S. retail sales and producer prices for an update on the strength of the economic recovery.
Here is what you need to know to start your week.
S&P500 (US Market)
$SPX rose +0.41% (+17.4 points) for its third straight positive week, closing at a all time high level of 4,250. Investors are giving growth stocks another chance as bond yields come down. The 10-year Treasury went below 1.43% on Friday, a three-month low.
Stock markets are likely to tread water, with investors reluctant to take new positions ahead of Wednesday’s Fed statement which will be scrutinized for clues regarding its timetable for raising interest rates. $SPX continues to reflect a minor bearish divergence as highlighted last week.
The immediate support to watch for $SPX is now at 4,165, a breakdown of its classical support, along with 20D and 50D major moving averages.
Fed meeting
Investors will be zeroing in on the Fed's statement at the conclusion of its two-day policy meeting on Wednesday against a background of persistent concerns over whether inflation spikes could pressure the central bank to start tapering its stimulus sooner than expected.
The Fed has repeatedly said that near-term price spikes will not translate into lasting inflation and Chairman Jerome Powell is expected to stick to this stance and reassure markets the Fed’s policy will remain accommodative.
While inflation numbers are rising, the recovery in the labor market remain sluggish. The economy added 559,000 jobs last month after gains of just 278,000 in April. That left employment about 7.6 million jobs below its peak in February 2020.
Most analysts are not expecting the Fed to begin discussing scaling back its asset purchase program before its annual conference in Jackson Hole, Wyoming, in late August.
Economic data
Away from Fed meeting, the U.S. is to release May data on retail sales and producer price inflation on Tuesday.
Also out on Tuesday is industrial production data which will be closely watched amid issues over supply constraints and labor market shortages. This could translate into increases in producer price inflation.
The economic calendar also features reports on housing starts and initial jobless claims. Data on Thursday showed the number of Americans filing new claims for unemployment benefits fell last week to the lowest level in nearly 15 months as the reopening continues.
Meme Stocks Mania
Meme stocks could also remain in the headlines after a volatile ride last week. GameStop ($GME) hit a high of $344.66 Tuesday and dropped as low as $206.13 Friday before closing at $233.34 per share.
Besides meme stocks, Treasuries could also be in focus after an unexpected slide in yields. There was a major move in the rate of the benchmark 10-year, watched most closely by investors, as it influences mortgages and other important lending rates.


Emini (SPY500) : Bullish trade setup4H ran into bullish weekly OB and reacted, giving yet another 4H bullish OB to trade from.
GLGT

SPY 422.60 + 0.91 % SHORT IDEA * REVERSAL PATTERNS & PRICEHELLO EVERYONE
HOPE EVERYONE IS DOING GOOD HAVING A GOOD ONE IN THE MARKET THIS WEEK, HERE'S A LOOK AT THE S & P 500 INDEX. That has been trading in a rising wedge looking for a shift in momentum of the index should we push down with the bears to see a break below of structure looking for sells on the index a break above of the support level signals continuation and cancels the trading idea.
* follow your entry rules on entries
* significant moves with the bears change the plan.
lets see how it goes.
many stars must align with the plan before executing the trade, kindly follow your rules.
HAPPY TRADING EVERYONE & LET YOUR WINS RUN...
_________________________________________________________________________________________________________________________
ENTRY & SL - FOLLOW YOUR RULES
RISK-MANAGEMENT
PERIOD - SWING TRADE
__________________________________________________________________________________________________________________________
If this idea helps with your trading plan kindly leave a like definitely appreciate it.

Emini! (ES1!) : 2 areas of potential bullish reactionPrice could dip into discount, mitigate some 4H zones and then go higher.
Wait for confirmations before going long. GLGT.

$SPY falling out of rising wedge after a doji candle on the 1M This bull run over the last year or so has been inside a rising wedge. On the 1 month chart we can see a beautiful doji candle which symbolizes the top. I am going to start shorting this trash, I expect a bloody month ahead.


$QQQ $DJI $SPY $IWM Major ETF's Show Same Setup (UPDATE)Video up date on the major ETFS as all of them are pushed up against resistance.

SPX could be targeting 5k by September/OctoberIf markets can remain in the blue megaphone, we can see a push towards year end to 5k.I do expect some choppiness in the short term and can see us pulling back to ~3800 or even backtesting the green trendline.
A move to 5k would be the measured move on this bull flag we are in

AMD PUTS - TRADE OF THE YEAR IF IT BREAKS 300% GAINERGuys,
If this breaks under this is a MASSIVE gainer on PUTS. Massive. Not only will it full fil the trend bounce at $60 and the possibly descending broadening wedge which overall tends to be bullish with big break upside. It gives you the possibility to not only be short but confidentially swap short to long at $60.
MASSIVE PLAY HERE.
ONLY WORTH TRADING IF IT BREAKS UNDER THE HEAD AND SHOULDERS.

$SPY Market Update Doji Day 5/17Video update and technical analysis breakdown on $SPY after a choppy day. Looking for some potential movement going into to tomorrow

S&P 500 - Elliott Wave Analysis - CorrectionHi All,
What a strong close today for SPY. It certainly took Bears on surprise, the bigger surprise was Nasdaq strong pull back to green as there's a lot of FUD around inflation, which is true but FAANG stocks are too cheap to be ignore for long.
Again, correction can be very tricky, I'll not assume or jump into any conclusion, we're still sitting in correction, and there're various ways Eliott's Correction can take place in ABC pattern, so place your bets accordingly. Good luck.

$SPYSlight downtrend and then will reverse towards resistance within the up trending Parallel Channel


SPY IMPORTANT LEVELSThe whole week spy has been pretty choppy but managed to stay above the critical 416.32 support. If bulls manage to keep it above that level, we may get to see SPY fill that gap to the upside.
The critical level SPY needs to pass is 420. If it doesn't I suspect we will see this choppy market continue and spy will likely trade between 416.32 and 420 until it breaks to the upside or downside.
We saw good earnings by companies only to sell off (AMD, AAPL, AMZN for example). I think we will likely see more selling on good earnings and remain choppy until earnings season is over.
Just some quick thoughts.
