SPY - too short time to go shortIn my humble opinion, 2nd wave of Covid19 compress the time to folds the final 5th wave into 89 bars (top-to-top distance very close correspond to Fibonacci numbers) and stops slightly above 360$ per share. In other words, I don't expect the shorting market crawls up to the price when IV wave end, on the contrary, I expect direct movement at new ATH (truncation or ending diagonal formation are very likely). If this presumption will be violated, in such a case, also counting is invalid and should be revised. When new ATH reap the glory, the significant sale will be followed where 3 possible gradual levels are also marked.
New recounting can be realized like this www.tradingview.com however the waves marked 1-5 will not be motive waves, rather B wave of the folding corrective wave (in this time 3-3-X where X is currently unknown wave formation for now leading to long-time short position). More specifically waves 1-3 forms A wave, wave 4 forms B wave and, 5 wave forms C wave of ZigZag formation of lesser degree.
Forecast:
Short time - go long
Long time - go short (in both cases the deep correction is expected)
Please keep in mind, it's not a suggestion, just observation. Any comments are warmly welcome.
Spy500

SPY SPX Short term short tgt 3289seems as if the market may not be finding fair value at current levels. looking for 3280 on break of 3322. long if daily close above 3280 to break 3363 resistance


$SPY INDEX TECHNICAL BREAKDOWN | OCT 2020Friday was the quarterly event known as quadruple witching where S&P 500 (SPY - Get Rating) futures, options on those futures, options on individual equities, and single stock futures all expire. In the past, these ‘witching’ days have been characterized by above-average trading volume and increased volatility. But, in the current environment, those are relative terms as both have been elevated for the past few months. Still, expect some wild gyrations, especially as we head into the close today, which could carry over into Monday’s opening as positions get squared away, hedges get established and positions are rebalanced. Data suggests that there are some 90 million options contracts likely to settle in-the-money and approximately $32 billion in index rebalancing, which needs to occur.
~
SPY currently sits above what has proven to be strong support @ $327 which could offer as a decent entry point considering our next support is at $324.
Possible long on a break and hold of resistance @ $332.
Upside targets: $340, $344, $347
Possible Short Entry pn break and hold below $327
Patience will pay, be very patience with these levels.
DotcomJack | Michael Jordan of Stonks

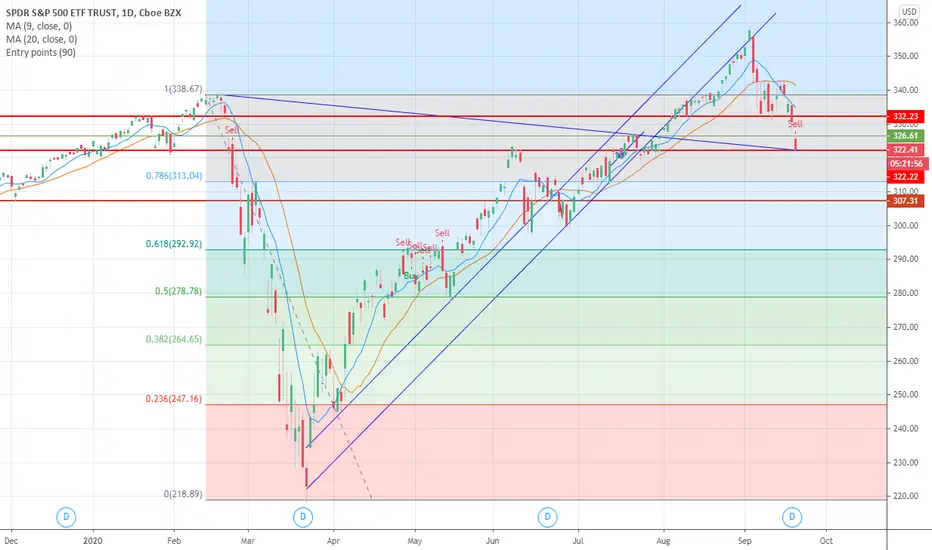
The moment on SPY i have been waiting for - 322.20This is the moment on Spy I have been waiting for a long term trend line from the last top and a long term support line has been met.
322.20 is the number for me. If we hold then we could see a return to the upside. If we cannot hold then a downside turn with next level at 307 is in the cards.
Timing for shorts and longs in SP500. ExplainedAdvance Decline Line has been one of the best indicators recently for SP500 traders. And again we have to watch it. I think we can see a very short-term rally (if the 4h trendline breaks up). If SP500 rallies without a similar move in the Advance Decline Line, it will set up a short entry. It seems to be a very possible scenario based on other studies:
Cycles – top between 17 – 24 of September, followed by a decline till the middle of October
Seasonal – down from September 17th
Intermarket forecast – down till October

SPY - SP500 ETF s/r analysisHello traders,
Description of the analysis:
SPY support zones ideal for timing long positions (gray). Trade what you understand, trade carefully and sparingly according to the business plan.
About me:
Hi, my name is Jacob Kovarik and I´m trading on stock exchange since 2008. I started with a capital of 3000 USD. My first strategy was based on OTM options. (American stock index and their ETF ). I´ve learnt on my path that professional trading is based on two main fundaments which have to complement each other, to make a bussiness attitude profitable. I´ve tried a lot of techniques and many manners how to analyze the market. From basic technical analysis to fundamental analysis of single title. My analytics gradually changed into professional attitude. I work with logical advantages of stock exchange (return of value back to average, volume , expected volatility , advantage of high stop-loss, the breakdown of time in options, statistics and cosistent thorough control of risk). At the moment, my main target is ITM on SPM index. Biggest part of my current bussiness activity comes from e mini futures (NQ, ES). I´m trader of positions. I´m from Czech republic and I take care of a private fund (over $4.000.000 USD). During my career I´ve earned a lot of valuable experience, such as functionality of strategies and what is more important, control of emotions. Professional trading is, in my opinion, certain kind of mental training and if we are able to control our emotions, accomplishment will show up. I will share with you my analysis and trades on my profile. I wish to all of you successul trades.
Jacob

Emini : Trapped sellersSunday gap up caught a bunch of sellers by surprise. Their desire to exit is our long trade!

SPY500 : Another breakout to the top to trap more buyers?The volume of trapped buyers above Jan 2020 time high is very low (both on weekly and daily charts). I suspect that we'll see more topside so that market traps more buyers above all time highs before it reverses down violently!

SPX Gives Bulls a glimmer of HopeAt first when the price action fell below the 200 MA on Friday, I was a bit nervous. Luckily we had a bounce back above the 200 hundred. Which then left the price action stuck between the 50 MA and the 200 MA. Leaving it a guessing game as which direction we might be heading. Oddly we have settled on a support line... which is the same suppot line when Biden accounced harris as his running mate. Yup, the 11th of August.. that big red candle I have circle. I'm not exactly sure what that means. But hopefully that wil be the last support line we'll see for a while. Which is why I saw it's a glimmer of hope. Yes, we've closed below the 200 MA on the 4 HR. Now we just need a comeback.
AAPL Fell to the 50
MSFT Fell tpo the 618
I think the worst is over... I hope.


Advance Decline Line did great job. What is next?Last week was hot for stock traders. As we discussed SP500 rallied a bit higher and was rejected. The Advance Decline Line did its job perfectly. I think the market can retest 3500 or higher and if rejected, we can sell for 3200. We still can see a big rally this year. Cycles and Fed Funds forecast indicate the beginning of an uptrend at the end of September. Besides, the stock market is usually strong before Elections. But for now, let's focus on very short-term trades.

SPY - BE CAREFUL SHORTINGHello Traders,
First official publish today!
Let's take a look at the SPY on the 4 HR chart. No fancy charting needed. Our strategy follows simple market structure.
BIG question leading into next week...IS THIS THE SELL OFF?!
We're Bullish.
We were expecting some sort of a pullback and it's nice that this "major" sell off took us back to simply retest our last ATH breakout zone. We are buying into this retest where we see a range of support from $331 to $340 area. There could be a further sell off down to those levels coming into next week. Be careful shorting this market. There's a lot of bearish sentiment and that's totally understandable due to covid and election fears. However, US equities still lead the global markets and we believe that more foreign money will pour into the US stock market this year to make positive yield as the rest of the global market underperforms.
WATCH OIL THIS WEEK!
We saw a bit of a continued sell off on oil this friday. This could potentially bring us closer to the lower support areas and put us in a grim environment during the early trading days this coming week.
Take your profits on short term trades and never chase these moves until a full confirmation. Other than that, trading volume should pick up next week and we'll have to observe how the market comes back after labor day.
Have a nice weekend!
*NOT A FINANCIAL ADVICE, THIS IS JUST OUR PERSPECTIVE AND WE DO NOT RECOMMEND ANY TRADES WE PUBLISH ON OUR CHANNEL. YOU WILL LOSE MONEY.


SPY AnalysisPrice has been on a long bull run so its about time for a pullback. Price made a big move to the downside but is still in an overall uptrend. Although I know price is still in an uptrend I am looking to go short on SPY if it pulls up into my sell zone before reaching one of my buy zones. I am also not going to just buy SPY at those zones just because price comes into them. I will wait for price to show strong signs of a continuation in the uptrend.
Hope this helps you in the coming weeks!
Don't forget to like and follow!

My guy RTY BACK AT IT AGAIN. GOOD OL' RUSS!LONG @ 1570.0 (4HR)
SL @ 1558.0
TP @ 1605.5
HELD ABOVE SESSION POC (GRAY LINE)
LOOKING FOR RETEST OF POC (RED LINE)@ 1580.20
IF IT REJECTS THEN PRICE WILL LIKELY PULL
BACK TO SESSION POC (GRAY LINE)
OR BELOW TOWARDS VWAP (PURPLE LINE).
IF IT DOES NOT HOLD VWAP I WILL BE LOOKING TO GO SHORT.
LETS SEE HOW THIS TURNS OUT

SPXUSD, If the price will show a pullback...The best Buy pattern will be if the price will show a pullback and false breakout of the All-time high level.
We can't know how long this rising will continue but the entry point will be with low risk and huge potential profit.
Push like if you think this is a useful idea!
Before to trade my ideas make your own analysis.
Thanks for your support!


Good old M2K!Failed to break and hold POC @1580.40 testing vwap @ 1578.90 if it can't hold VWAP then it will likely retest previous POC @ 1576.5 and if that doesn't hold then the daily open @ 1575.1 will be the next test on on its way to daily low @ 1572.9. lets wee what happens

SPY - Rate of Change..room to riseSPY - Rate of Change..room to rise
Take a look at the line I drew at the top indicator. Notice the recent rise is going towards that line as in the past you will notice it acted as resistence and support.
Market should take an aim at ATH and some is my take on this. Watch this play

SPX getting heavy up here. No one expects this to breakdown Bearish butterfly forming around the gap. Don't think we fill it before we collapse back down to support.

! Key factor being disregarded during stock rally - The DXYToday is the 30/7/2020. The S&P500 dropped even though the dollar index got slaughtered. If you weren't aware, the S&P500 show it's price in US Dollars . What does this mean? It means that when the dollar weakens, stocks should go up and the inverse for the opposite scenario. However, seeing the dollar getting weakened AND stocks dropping is very bad. This means that although the dollar got demolished, stocks STILL dropped . As soon as the dollar stops the downwards decline we will see a strong drop, perhaps even a second (smaller) leg down for stocks.

SPY:Does it know where it will go?This week won't be complete with some volatility because of unemployement rates,vaccine news and also elections. SPY has gaps to fill on upside and also downside. Down it has to go to 320.20,up to 325.11. 321.28 seems to be where things are bouncing PM so that would be a good level to watch. If we go bellow then 320.20 will be for sure there as well to fill the gap.
Any opinions on this chart will be gladly appeciated! Stay safe and happy trading!
