Expired SPY Weekly outlook 1st WK SEP 2023Expired SPY Weekly outlook. 1st WK SEP 2023
> NEUTRAL 📊 CORRECT
Closed Price: 451.19
Target Price: 450.92 | Strike Price:449.24 SEP5
Upper Range: 468.34
Lower Range: 433.49
Spyanalysis

SPY UPDATESIf only I predict the future.
Made a predictions last month but price goes below on my predictions, but the main reason is still valid to clear 456$ deviation on trap buyers.
This idea is base on deviation on traping both buyers and sellers.
Im waiting for price to break . or the price to consolidate.
IF price breaks above 456 then we see bull to the previous high 479$
If not break. then price could test only the 456$
This is not a financial advice.
Follow for more.
For me it will break 456. once it breaks then we might see a new HIGH this year.
Trade at your own risk

Michael Burry Executes Massive Short of SPY and QQQIntroduction:
In recent news, renowned investor Michael Burry has made waves by executing a massive short of the SPY (S&P 500 ETF) and QQQ (Nasdaq 100 ETF). Burry's move has garnered significant attention, raising concerns about the future performance of these major USA stock market ETFs. This article aims to provide traders with a cautious analysis of the situation and present a call to action for those considering shorting these ETFs.
The Burry Effect:
Michael Burry, famously known for his accurate prediction of the 2008 financial crisis, made a bold move again. By shorting the SPY and QQQ, Burry is signaling his belief that the current market conditions may be overvalued or potentially face a correction. Traders should take note of his historical accuracy and consider the implications of his actions.
Understanding the Risks:
Understanding the associated risks is crucial to approach any investment decision thoroughly. Shorting ETFs like SPY and QQQ involves betting against the market's overall performance, which can be highly volatile and unpredictable. While Burry's track record is impressive, conducting independent research and analysis is essential before making investment decisions.
Considerations for Shorting:
1. Diversification: Traders should ensure their portfolios are well-diversified, spreading risk across various asset classes and sectors. Shorting ETFs like SPY and QQQ should be considered a strategic move within a broader investment strategy.
2. Risk Management: A clear risk management plan is crucial when shorting major market ETFs. Setting stop-loss orders and regularly monitoring positions can help mitigate potential losses.
3. Expert Advice: Consult with financial advisors or professionals specializing in shorting strategies. Their expertise can provide valuable insights and guidance tailored to individual trading goals and risk tolerance.
Call-to-Action: Proceed with Caution
Considering Michael Burry's recent shorting activity, traders are encouraged to proceed cautiously when contemplating short positions on SPY and QQQ. While Burry's reputation for accurate predictions is noteworthy, conducting thorough research and analysis is imperative, and assessing the potential risks and rewards associated with such trades is imperative.
Ultimately, the decision to short these significant USA stock market ETFs should be based on an individual's risk appetite, investment strategy, and market outlook. Traders should carefully weigh the potential benefits against the inherent risks, seek professional advice, and consider alternative investment options.
Conclusion:
Michael Burry's massive short of SPY and QQQ has undoubtedly sparked interest and raised questions among traders. However, it is crucial to approach such investment decisions and conduct thorough research cautiously. By considering the risks, diversifying portfolios, and seeking expert advice, traders can make informed choices that align with their individual trading goals. Remember, shorting major ETFs is a complex strategy that requires careful consideration and may only be suitable for some.

SPY wanting to repeat history. BEAR MARKET TO RETURN 🐻AMEX:SPY approaches supply from 2022. We have a solid rejection candle and have closed last week below the supply zone. Reversal is imminent - supported by heavy absorption of buyers at the ask on the cumulative delta volume chart.

SPY - Wyckoff DistributionSPY potentially could be in the beginning stages of a Wyckoff Distribution phase. Predicting price to gravitate between golden Fib zone for the UT & eventual UTAD before price falls in line with trend line ~320-330

S&P 500, 6/29/23For Thursday, 4426.75 can contain session strength, 4341.25 in reach and able to contain session weakness. A settlement today below 4341.25 signals 4263.00 - 4284.00 by the end of next week, where the market can bottom out on a weekly basis - possibly through July activity.
Upside Thursday, closing above 4426.75 signals a good low through next week, the 4530.50 formation then expected over that time horizon, able to contain buying through next week and the level to settle above for yielding the more meaningful 4616.50 over the following 1-2 weeks, where the market can top out through Q3.

S&P 500, 6/23/23For Friday, 4467.50 can contain session strength, below which the market remains the defensive into next week, possibly yielding 4257.50 over the next 2 - 3 weeks.
Downside Friday, 4416.00 can contain intraday weakness, while breaking/opening below 4416.00 allows 4357.75 intraday, where the market can place a daily low.
A settlement today below 4357.75 signals 4299.50 on Monday, 4257.50 by the end of next week, likely contain weekly selling pressures when tested, possibly into later July.
Upside Friday, pushing/opening above 4467.50 allows 4509.00 intraday, able to contain buying through next week and below which 4257.50 is attainable over the next several weeks.
Inversely, a daily settlement above 4509.00 will keep the longer-term objective at 4616.50 in reach over the next several weeks.

SPY - Wyckoff DistributionSPY potentially could be in the beginning stages of a Wyckoff Distribution phase. Predicting price to gravitate between golden Fib zone for the UT & eventual UTAD before price falls in line with trend line ~320-330

SPY: Support Becomes Resistance (Macro)SPY has reached the .618 Fib retrace level and we are definitely at a crossroads. If price break through
this level and flips resistance into support, then the macro measured move on the monthly, puts price in
the $700s. If resistance holds then we have a measured move to the $330 level, before hypothetically
resuming this trend. If resistance holds and we resume our downtrend over the next few months than it is
hard to say how things will play out from there. The upward channel could be considered broken and we
form a new trend going forward. Although, another measured move down to the $330 level does seem
to form a macro bullfrog on the SPY which is bullish.
Given the warnings that the macro data has been flashing as far as manufacturing and china and consumer
credit card debt and drop in savings accounts, etc. It is very likely resistance will hold and we continue
downward temporarily from here. It is honestly a best case scenario because equities are fairly expensive right now.

SPY Upside & Downside Reaction ZonesWhat follows is a high level analysis of the AMEX:SPY using the RD Trade System.
Overview
Since around March 29th 2023 the AMEX:SPY has been momentum and bias long the last RA check was on April 23rd and May 23rd both of those bias checks held up it's also maintained momentum throughout this whole time.
There is no reason to short the market at any point in time and buying pullbacks is what the trade system suggests.
The one thing that would change this would be a close below the 410 handle. A substantial close below this price level and this price level being tested would signify a change in market sentiment.
Outside of that trading this is straightforward.
Upside Zones
On the chart we've outlined the high probability by zones 1through 3.
To the upside we have target 1and target 2.
Target 1 is rather wide that's because our upside indicators and rules within the system give us multiple areas where it could fail.
If and when price gets to this zone this would be a fade trade so if you are not experienced with fade trading, it's not a trade I would recommend.
We would be fading this market in this zone. A close above this zone virtually guarantees it would take out the all-time high with a target zone between 499 and 510.
Target two is also another zone where we expect a reaction.
System Trade Plan
How does our system tell us to trade this?
Very simple. We wait for the price action on Monday and either enter what we call a participation trade or we simply wait for a pullbacks to our buy zones.
If and when price hits the buy zones we then wait for simple confirmation using what we call the four chart setup.
A close above 450 would be a big deal and would signify especially if it's tested multiple times that the all-time high will be taken out.
The bottom line as long as momentum and bias remains long we will be buyers in this market.
I say this often-- don't argue with the chart, it's clear where bias and momentum lies within the SPY at this moment.
If you have any questions or feedback please leave a comment down below. It literally took me 90 seconds to put together this analysis it actually took longer to dictate this and share this idea than it would for me to devise a trade plan to trade this.

$SPY (SPDR S&P 500 ETF TRUST)AMEX:SPY (SPDR S&P 500 ETF TRUST)
Next Target $440.08
If you had invested $1,000 in AMEX:SPY on June 10, 2013, at a price of $164.80 per share, you would have been able to purchase 6.06 shares. As of June 6, 2023, the price of SPY was $428.03 per share. If you had held onto those shares and not reinvested the dividends, your investment would have grown to $28,997.22. This represents a total return of 190.06% over the 9.99 year period. SPY paid a total of $49.99 per share in dividends over this period of ten years. Therefore, if you had held onto those shares and not reinvested the dividends, you would have received a total of $302.94 in dividend payments. However, if you had reinvested all dividends, your investment would have grown to $31,289.39. This represents a total return of 212.78% over the 9.99 year period.
This week is packed with news and events. The FOMC is the big one of the week, but we also have CPI, PPI, Bond Auctions, Oil Reserves (which may be important with the OPEC cut), and plenty of other big news. Any unexpected changes or hints about future interest rate decisions could significantly influence the stock market behavior due to their implications for rates, timing, and monetary printing.
*Disclaimer*
The information is purely for *entertainment* purposes, and is not meant to be, and does not constitute, financial, investment, trading, or other types of advice or recommendations. Do Your Own Due Diligence (DYODD)

SPY/SPX 500 UPDATES
Hello Traders. I made a prediction last month of May on SPY/SPX500 that price can go to 430$.
Im waiting to break of structure @444$ supply zone. before it goes below.
This ideas are mostly base on nasdaq stocks also. If you compare it. same scenario.
On a bearish side, Wait for the previous High on left side to be break, and its originality of the price below, Thats the target zone for bearish.
This is not a financial advice,
Lets goo 400 followers soon.
For free content and daily ideas check out my signature.
Follow for more.

Is there stock market drop based on around SPX possible? As we have all seen, the stock market has been on a steady rise for some time now, but I fear that we may be on the brink of a significant drop.
There are several reasons for my concern. While governments and central banks have taken measures to mitigate the effects of this past pandemic disruption, the long-term impact on the economy is still uncertain.
Secondly, we are seeing signs of overvaluation in many sectors of the market. Companies that are not yet profitable are seeing their stock prices soar, and the valuations of some of the largest tech companies are reaching levels that are difficult to justify.
Finally, we are seeing a significant increase in market volatility, with large swings in both directions becoming more common. This volatility is a clear sign that investors are becoming increasingly uncertain about the future of the market.
Given these factors, I believe it is important for traders to be wary of the current stock market rally. While it is always difficult to predict the future, I believe that the risks of a significant market drop are high.
As such, I encourage you to be cautious in your trading decisions and to consider taking steps to protect your investments. This could include diversifying your portfolio, investing in defensive sectors, or even reducing your exposure to the market altogether.
In conclusion, I urge you to take these warnings seriously and to be prepared for the possibility of a significant market drop. While I hope my concerns are unfounded, I believe it is better to be safe than sorry.
SPY Key Support | QQQ Size of Pull Back is Key for me- SPY double bottom with Fridays low bouncing off key support
- QQQ bears play defense on double top high of today
- potential rising wedge resistance on QQQ
- NVDA ER Wednesday AH

Stock Market Weekly Outlook | Rising Wedge Volatility coming |- QQQ Rising wedge pattern about to break soon
- QQQ bulls still in full control on daily chart daily uptrend intact
- QQQ needs to break May 9th pivot low for us to go from up trend to neutral trend
- Does XLF XLE sector join team bull when QQQ pulls back or they all pull back together?
- Size of the QQQ pull back will be most key for me next week if QQQ can hold above May 9th pivot low and bounce we can potentially head for 330 level.

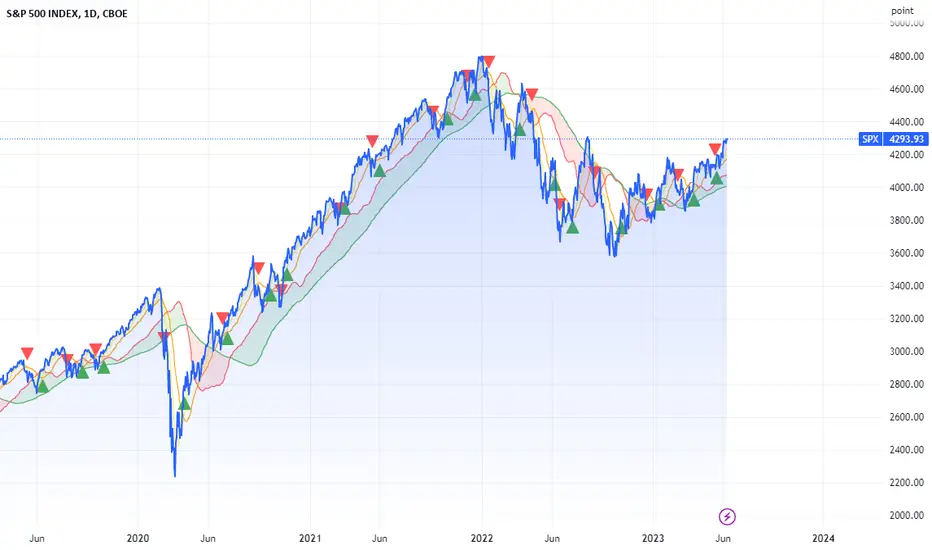
Current daily channel on spy hope it helps you understand the current volatility rnage of the asset.
keep in mind that he can change profiles quite easily (a good indication of this is a sudden increase in "speed" and volume).
I personally like the idea of looking for entries with confirmation at the bottom (aimed at the top of the channel), but also gives an idea of the area where more attention is needed

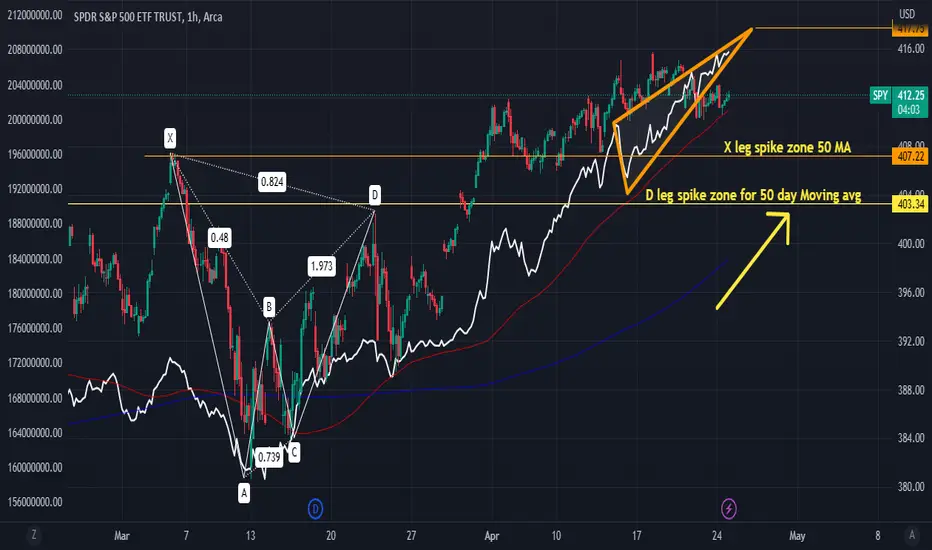
AD Ascending Triangle 1hr Chart target $417The 50 Day Moving avg is looking to cross both D leg, and X leg of the Bearish Cypher pattern. These are past resistances levels, once both these levels are crossed over. I fully anticipate price action to go higher. In Fact the AD has an ascending Triangle Pattern to 417 on the 1hr time frame. For short term traders and swing traders this is a bullish set up
Challenge my Elliot Wave Count looking for $406 $spy Posting this, because they're so many Elliott Wave Experts on Trading View. They always come to my posts to challenge my wave count, and it always goes in my favor. However, they never stick around when the trade goes in my favor, and worst they dont post any charts of their own when I challenge them..
So I'm doing an open invination for all $spy, $spx $es traders to post a chart w/ their wave analysis. I stand by my charts and analysis and I trust the money flow. I'm looking for $406 soon on $spy
keeping it simple, we close above yesterday which is extremely bullish. We had a bullish ABCD pattern, which based in a cup/handle pattern w/ a bull flag .. I ran my Elliott Wave Count from the ABCD pattern to the cup/handle pattern. We're now at an Apex...
Either The Bull Flag/handle pattern is incorrect of $spy Drops to $370-380 starting tomorrow... I'm following the Money, what are you doing. Lets see some charts, and I welcome feedback...

Price action needs to close above X leg & wave 4 $412im a buyer of the dips. looking for previous resistances to become future support . The uptrend is intact , in fact this is a bear trap. Notice how buyers stepped in on C wave of the ABCD pattern, when it retraced. Bears are trying hard to push this to wave 2 near b leg of the bearish cypher pattern around 409.36... A massive short squeeze will occur...

Daily SPY technical analysisSPY sell/ short zone 412.80 to 413.61. stop-loss 414.14. take profit zone 410.11 to 409.04

Cracking the Code: Analyzing SPY Trends Across Multiple TFLets take a deep dive into the SPDR S&P 500 ETF Trust (SPY) and examine its trends across weekly, 4-hour, and 1-hour charts. Using technical analysis tools and strategies, we uncover insights into how SPY is behaving on different time scales and what that might mean for traders. Whether you're new to trading or a seasoned pro, you'll find valuable insights and actionable tips in this comprehensive analysis of SPY price action.

SPY S&P 500 ETF Analysis Monday, March 20th, 2023Today market is more volatile for high-impact news, so look at the mentioned level to trade entry.

SPY is Doing ABC Medium Term CorrectionTechnical Analysis:
- As you can see in the chart, SPY is doing a short term wave 3 in red
- We expect that it will extend lower to finish correction around $300 ~$310 in the orange circle to complete the ABC correction of the wave II in red
- H1 & H4 Right Side is Turning Down
Technical Information:
- SPY is a ETF and it has a very strong correlation with SPX Indices
