SPX500 weekly has just turned bullish$SPX weekly is showing bullish signs.
$AMZN $AAPL $GOOG $GOOGL good earnings can boost the market further.
Spylong

SPX TOP!! Final leg to 6100 by July 22nd 2024This just lines up so perfect for me. A measured move from the March 2020 lows would be 6100 in July 22nd ish 2024. That would line up with the tops from 1929 and 2001, oh man. At that point I'm selling it all and running for the hills cuz it could get REAL nasty.

SPY OPTIONS TRADINGFollow for more.
Some DEgen here trading SPY.. lets goo.
Trade base on your own decissions.

Powell's Power!As of recently we have been in a small bull run. Bulls have been pumping on bad news, being dumb and relentlessly rallying. This is normal for bulls though so what can we expect? Bulls gonna do what bulls gonna do! We are at a strong resistance/supply level however, the bulls have been very violent and are out for blood as they aim to plow through this resistance/supply zone. In a few days we get the new interest rate numbers and if the FED decides to pause the rate hike then the bulls will go crazy and pump spy even higher. A rate hike will most likely drag spy down a bit and put us into lower 400s or higher 390s but, lately bulls have been pumping on bad numbers so we cannot accurately determine their next move. The bulls are at the end of a tunnel and they see the light so they will not stop at any costs, join the rally or get stomped shorting. I'm not a bull or a bear but the trend is your friend, that is if you can spot it.

Looking at current trend $SPY can hit $114 in coming weekLooking at current trend $SPY can hit $114 in coming week

Time For Bears To Feast? $SPY Heading to $385 By Feb. 10th.It seems like it's following the same pattern as the past two rallies. If you look closely, each time it rallied, the volume was declining and same is happening with the current rally as well. The first rally hit the bottom trendline in 36 days, the second rally hit the bottom trendline in 18 days (in exactly half the amount of days it took the first one to touch the trendline) and if the algos are following similar pattern we should see $385 by second week of Feb. Close above $405 invalidates this probability for me.

Next week for spyTop of the week will start on a RSI cool down followed by a trip into bull territory. things cool off after new highs back down to support to prepare for the first day rally in Feb.

SPY $ Target 2023we got rejected for the 5th time at our bearish channel, if we don't clear that channel above the 400$, is means we going to have a test first for the support above the 355$ then to the bottom price around the (320$/340$) .
on the other hand if we broke that channel , is means that will be the first sign for bullish reversal , and the second signal which is the most strongest one is breaking the 430$ resistant .

SPY - Price Targets & Stop Loss📈 What’s up investors! 📉
Welcome back to another one of
💡“Mike’s Ideas”.💡
I post as I find signals… these signals are based on the personal rules I have built and follow in order to make up what I call the “SST Strategy”. Follow for more ideas in the future!!
I have 4 levels marked and colour coded on the Chart.
These levels are:
⚪ White = Entry Point
🔴 Red = Stop Loss
🟢 Green = 1.2:1 Risk Reward Ratio
🟡 Yellow = 1.5:1 Risk Reward Ratio
🔵 Blue = 2:1 Risk Reward Ratio
👀 So what are we looking at today…!!!
🚨( SPY ) SPDR S&P 500 ETF Trust🚨
The Trust seeks to achieve its investment objective by holding a portfolio of the common stocks that are included in the index (the "Portfolio"), with the weight of each stock in the Portfolio substantially corresponding to the weight of such stock in the index.

40 Bar Cycle Chart - S&P 500 SPY SPX - Updated 011423Leading up to the December Inflation CPI Report that was released this last week (Thursday), markets (at a macro level) have been rallying into this last Friday — which also was coincidently the start of earnings season as banks such as J.P. Morgan (JPM), Bank of America (BAC), Citi (C), Wells Fargo (WFC), BlackRock (BLK), & others.
Now that the Inflation (CPI) Report is out of the way & earnings season is full steam ahead, markets look to the next big event(s) which include the Federal Reserve February Interest Rate Decision coming our way on February 1st, 2023.
That said, here's what is happening in the charts with the S&P 500 SPY SPX ES1! as it relates to our "40-Bar Cycle" 📊:
📉 *CHART NOTES* 📈
As I mentioned above, we did break out of the sloppy trading/consolidation range that the S&P 500 SPY SPX ES1! was kept in throughout the holidays, & into the new year. Now that we've broken out of that & reached back above the 50-Day Simple Moving Average (SMA50 = Red Line) on the daily chart, SPY is sitting just below the 200-Day Simple Moving Average (SMA200 = Green Line). Also note that we did close above the SMA200 ($397.21) to finish up the week at ($398.50) on SPY. Now that we are above this key level (on a daily close), question is will we re-test this level & drift higher into the February Federal Reserve Meeting? OR, are markets setting up for a further (or short-term) pull-back using the timing & levels included in the "40-Bar Cycle" 📊 ?
Keep in mind too that we did get a positive MACD crossover (buy signal) on the daily chart, as featured below. However, looking at the charts (including 4-hour MACD) I would conclude that this is likely an invalid buy signal — based in-part on other factors including January Options Expiration (OpEx) next week, 'VIX Compression', & also Federal Reserve 'Net Liquidity', which is still "risk-off" on a macro level as the Federal Reserve looks to keep a lid on asset prices, & of course Inflation (CPI).
Chart #1-2: SPY Consolidation Breakout (Daily, w/ & w/o Falling Wedge Pattern)
Chart #3: SPY Consolidation Breakout (4-Hour)
Chart #4: SPY Consolidation Breakout (1-Hour)
Chart #5: SPY 40-Bar Cycle (Daily, note that we are now clearly above the 50SMA are converging on major resistance of the 2022 downtrend & the 200SMA ).
Chart #6: SPY 40-Bar Cycle (4-Hour, note the 50SMA did not cross below the 200SMA)
Chart #7: SPY 40-Bar Cycle (1-Hour, note the 50SMA vs. 200SMA buy-signal & upward regression channel)
What are your predictions for the rest of January 23'?
Camp A: We are short-term overbought & a pull-back is in order, before we re-test & break out of this $380-390-400 range on the back of better than expected earnings, less than hawkish Federal Reserve, & more "resilient" macro data.
Camp B: We may continue to short-term rally, however market liquidity is still too strong & the Federal Reserve is likely to continue with .25% — in addition to maintaining their hawkish tone so that excess market liquidity does not run away from them with higher asset prices. Macro data will continue to be mixed, if not trend-downward, & earnings will start to come in softer than people expect as forward outlooks raise the red flags for investors.
Let me know your prediction in the comments below! 👇🏼

Investment Opportunity in Spy - LongIt is important for investors to have an understanding of the factors that can influence SPY price movements and to be able to accurately predict future prices.
I focuses on analyzing SPY price movements and patterns in order to identify potential trading opportunities.

SPY S&P 500 ETF Santa RallyU.S. stocks tend to rise during the Santa Claus rally period.
The Santa Rally is considered the last five trading sessions of the year and first two of the new year.
Since 1950, the S&P 500 has traded higher 78% of the time during the Santa rally period for an average gain of 1.3%.
My price target for SPY is $384.
Looking forward to read your opinion about it.

Spy is headed to 300 this year baby Golden pocket on the weekly and 400 period ma
The fed pivot and earnings season will cause this

I think this roadmap is doable for ES & SPX - Seasonality WorksUp for a measured move in the channel to 4400's until Feb 22nd ish, Down to retest the channel and bottom around March 10th. Up until May 10th ish, bottom in June 1st for a great buy.

next possible spy box range.up, down, up, down. it all repeats itself. As we near a possible breakout from this annoying range here is my speculation of the next range if we break to the upside. We may not break upward this time though as markets conditions get stricter and interest rates harsher all this noise about the FED and their power may force spy down making it a bystander to this range expectation. Happy trading!

40 Bar Cycle Chart - S&P 500 SPY SPX Q - Updated 010323After a sloppy last few weeks of trading to wrap up the year-end 22', SPY closed right around the (Q4/22') SPX JPM J.P. Morgan Quarterly Collar sitting right at $3,830.
Looking ahead to the month of January, we have lots of upcoming data including December Inflation CPI, Jobs Report(s)/Unemployment Data (UNRATE), Producer Price Index (PPIACO), Leading Economic Data such as the OECD Composite Indicators (USALOLITONOSTSAM), Upcoming Q4/22' Earnings Releases, etc., of which is seems markets are staying relatively "pinned" for the time being until this data starts hitting the markets & investors come back from the extended holiday season.
Per our "40-Bar Cycle" chart, while I expect that this next down-leg in SPY SPX will likely play out as shown in the in the charts. However, do keep in mind that there are some seasonal tailwinds & also some tailwinds for markets regarding mid-term election cycles.
Here is what history tells us about pre-presidential election mid-term seasonality: 🇺🇸🗳🗓
“Third year pre-presidential election is the strongest.” (Up Double Digits, Historically)
Dow = 19.3% (Since 1949) Dow Jones Industrial Average
S&P 500 = 20% (Since 1949) SPY SPX ES1!
Nasdaq = 29.3% (Since 1971) QQQ NQ1!
Election Cycle Data 📊: twitter.com
Election Cycle Data 📊: twitter.com
Election Cycle Data 📊: twitter.com
Election Cycles Data Explained via Twitter Space 🔊: twitter.com
SPY Daily Chart Template
www.tradingview.com
Which camp are you in on the short-term (Q1/23') direction of markets?
Camp A: We are likely we headed for new lows in Q1/23 (Lowering, But High Inflation aka Stagflation + Persistent Price/Wage Pressures + Hawkish FED + Downward Earnings Revisions/Misses).
Camp B: We are likely to break the downtrend into Q1/23', as mid-term election/pre-presidential cycle seasonality kicks in & also as the economy proves more "strong" than many are discounting (Peak Inflation + Light Deflationary Forces + Dovish FED via Pending 'Pause' + Nominal Earnings "Resiliency").
Let me know your prediction in the comments below! 👇🏼

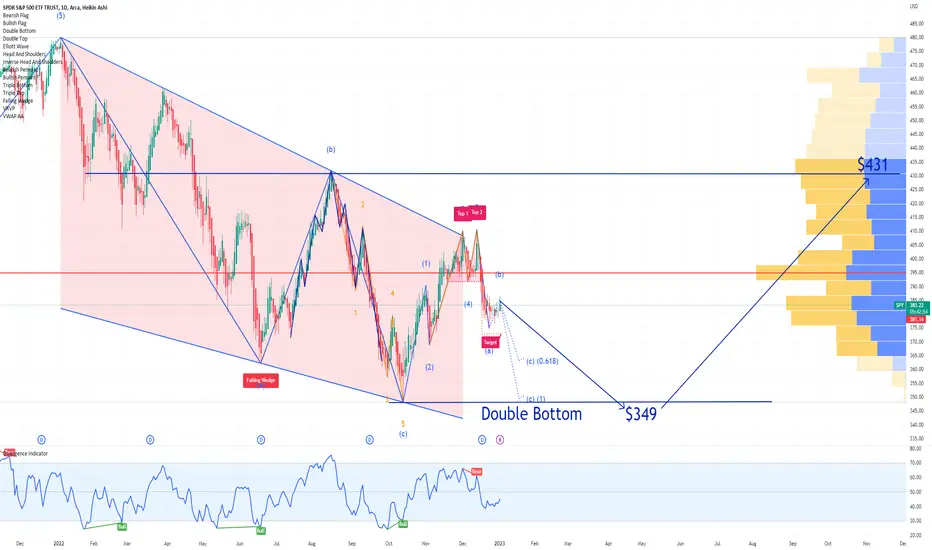
SPY S&P 500 ETF Price Prediction for 2023SPX S&P statistics the year after a drop:
81% chance of a rise and 14% average gain.
I expect a Double Bottom by mid year, Price Target at $349 and a year close at $431.
I think it`s reasonable.
Looking forward to read your opinion about it.
SPX500 Headed To Supply Zone Above 3950Price target at 3930 will follow the current bear channel. once price gets to the supply zone we wait for a bearish setup if any and go short. Bullish before FOMC meeting on Wednesday and then a possible reversal.

1871-2022 S&P 500 Secular Bull vs. Bear Markets SPX SPY I wanted to share this chart, as a couple of things stood out when thinking about past bull & bear secular market cycles vs. the current secular bull market that we’ve been in for the last 10+ years since the 08-09’ GFC (Great Financial Crisis).
First , for those who say “investors can't or shouldn’t time the markets", I very much disagree with this logic (or Wall Street marketing) as there are plenty of signals, cyclical trends, leading indicators, etc., that give investors clues as to what likely lies ahead — based on probabilities.
And while nobody can be 100% certain as to the exact pathway of markets, given the macro cross-currents that are in front of us — we can 100% say that we have been & still are in a secular bull market. Until this trend changes, the “crash” that many were calling for in 22’, if not expecting for 23’ could possibly take longer to play out than many realize when looking at previous bull vs. bear secular market cycles.
Second , looking at the attached chart(s), this is also why timing and duration matter.
If you are entering retirement toward the latter part of a secular bull market, it might be best to reduce risk & shift from capital appreciation to capital preservation. Examples of this include leading up The Great Depression, 1950’s post-WWII boom prior to the 1970’s Stagflation Era, & into the end of the Tech Boom of the .com era leading into 2001.
On the flip side, if you are in your saving years (20’s-30’s+), then it is during these secular bear markets that you really want to be accumulating & building your asset base for the next bull market phase that is likely ahead in the coming years as the trend higher always begins during the bear market bottoming process (see dotted black lines on charts).
Third , looking at the current cycle & zooming in on the charts from yearly (large picture) to monthly chart — we can see that we are still technically in a secular bull market. And considering the previous two major bull market cycles of the 1950/60’s (18 years) & 1980’s up until the early 2000’s (19 years), one could make a case that we are only about halfway through this current bull cycle (9 years).
Do I think this is absolutely the case? Personally , I do not as there are issues regarding demographics, de-globalization, inflation/stagflation/deflation, boomers retiring en-masse, etc., that will likely put further pressure on asset markets throughout this decade.
What do you think about this historical analysis?
Are we going to break this secular bull market cycle & enter a secular new bear market?
Or, are are just in a corrective phase within the broader bull market cycle?
CHART NOTE: Recessions = Shaded Red Areas
Chart #1 (Yearly): *1871-2022* 📊
*Inflation Adjusted Returns Chart Data via Advisor Perspectives*
www.advisorperspectives.com
Since that first trough in 1877 to the March 2009 low:
Secular bull gains totaled 2075% for an average of 415%.
Secular bear losses totaled -329% for an average of -65%.
Secular bull years total 80 versus 52 for the bears, a 60:40 ratio.
Chart #2 (Yearly): *1871-2022* 📊
*Inflation Adjusted Secular Highs & Lows via Advisor Perspectives*
www.advisorperspectives.com
Chart #3 (Yearly): *1871-2022* 📊
*Inflation Adjusted Regression to Trend via Advisor Perspectives*
www.advisorperspectives.com
Chart #4 (Yearly): *1871-2022* 📊
*Inflation Adjusted Regression Channel via Advisor Perspectives*
www.advisorperspectives.com
Chart #5 (Monthly): *1920-1972* (Great Depression & Post-WWII) 📊
*Note that during the Great Depression/WWII, as Ray Dalio has pointed out in his recent book "The Changing World Order" this was a prolonged period of negative to very low returns.*
📖 www.economicprinciples.org
Chart #6 (Monthly): *1972-2022* (70’s Stagflation, 80’s "Greed is Good" markets & 90’s dot.com Boom, 08’ GFC, & 2010’s QE 1/2/3, 20’ Covid Crash, & 21-22’ Inflation/Interest Rate Shock Correction) 📊
*Note that we are still in a secular bull market uptrend, when looking at the monthly charts. Until this trend breaks down, there is market support for a continuation of this trend.*
Pre-Covid High = Red Dotted Line ($3,393.52)
Post-Covid High = Green Dotted Line ($4,816.62)
Chart #6 (Monthly): *1871-2022* (MACD) 📊

SPX 2023 Trade idea...Simply follow the supertrend indicator for SPX quarterly ITM calls/puts at the given buy/sell signals. Follow the volume on larger time frames. Use any profit to first pay off 2022 debts then start building a diverse ETF portfolio with high dividend yields. 80% of portfolio going into equities 20% used for options.

40 Bar Cycle Chart - S&P 500 SPY SPX ES1! - Updated 122322With a key level of the $JPM Quarterly Options Collar sitting at $3,855 on SPX ES1!, markets seemed to have been "pinned" for the time being as market makers position for the close of business ahead of the Christmas holiday.
Question now is are the bulls hopes of a Santa Rally into year-end wishful thinking? 🎅 🎄 Or, we see another attempt at a short-term relief rally within what is likely to be a continuation of the downward "40-Bar Cycle" that is projected to continue into the first few weeks of 23'?
SPY Daily Chart Template
www.tradingview.com
Which camp are you in on the short-term (end of year into Q1/23') direction of markets?
Camp A: We are likely we headed for new lows in Q1/23 (Fluctuating Inflation + Persistent Price/Wage Pressures + Hawkish FED + Downward Earnings Revisions/Misses).
Camp B: We are likely to break the downtrend into the start of Q1/23' (Peak Inflation + Deflationary Forces + Dovish FED + Earnings "Resiliency").
Let me know your prediction in the comments below! 👇🏼

SPY potential re-accumulation pattern forming.Credits to CheddaFreeze who thought me this. Says we need more data to be confident in the development.

Possible SPY Long opportunity from smart money Please read the chart text. Furthermore we are in a box that has proved there are lots of bulls at this area hence the previous rally at this zone. Could this be the Santa rally everyone is talking about to save spy? We can hope for smart money to re-enter longs here to boost spy back up towards the top of this range otherwise, I fear spy may drop slowly into 360's or lower. There is also a chance that spy just trends sideways and ranges more into the new year. What do you guys think is brewing?
