SPY S&P 500 ETF Options ahead of the CPI reportThe Release of the Consumer Price Index for July 2022 is scheduled for Aug. 10, 2022, 08:30 AM.
Ahead of the CPI report next week, looking at the SPY options chain, i would buy the $390 strike price puts with
2022-11-18 expiration date for about $10.94 premium
or the $340 strike price for$3.29, same expiration date.
Looking forward to read your opinion about it.
Spylong

$SPY Weekly View UpdateMany bears doubting the recent market rally have failed to see the bigger picture. If you look at the weekly timeframe on $SPY you would see MACD has just crossed about the signal line and we have RSI calling for further upside after a confirmed reversal at the 200ema within a megaphone pattern. Our extention target is between $430-$442 where we would expect profit takers to give us a reversal. We are remaining long until we have a reason not to be...

SPY Trade Idea (BULL TRAP)Here Im using the trend based fib ext.
SPY is currently at the June highs and the 1.618 Fib level.
Seeing deviation with price making a higher high and the RSI making a lower low on the 4HR. (Bearish)
In June fear turned to euphoria in an instant. Talks about the bear market being over started, just like it is now.
Spy fell out of an ascending channel after initially getting rejected from the 1.618. (Bearish)
In June it took about a week to finally sell off and bull market talks faded in the. background. I think we see a similar story in the next few days and weeks.
If you're bullish i would be patient, things dont go up in a straight line. The RSI on the daily is at levels not seen since March. VIX is on a strong support which has generally marked local tops. If you notice there has been 3 times we previously touched this support and every time has been a sell signal. Same goes with the top resistance, every time we touched resistance it marked a local bottom in the stock market as you can see with the red and green arrows.
In the coming weeks I am bearish on SPY and anticipate a retest of 390, a break below that and the next level is 380.
However coming off one of the best months in a long time the medium to long term future looks bright for the stock market.
We look to be forming a possible inverse head and shoulders pattern on higher time frames and if this is the case we should see strong support in the 380-390 range. (This is where Im swinging long if the market gives us these levels). I would also like to see VIX at resistance to further confirm the trade.
I wouldn't be surprised if VIX broke out of this wedge, and give us the 40+ everyone has been calling for which if in fact we do reach those levels on VIX i think that would be the max opportunity to go long on the market. We will cross that bridge when/if we get there.
Ill soon be posting ideas on individual stocks, let me know if you guys agree or disagree!


$SPY as Predicted (So What Now?)My previous post for us to break $400 on SPY happened this week. You can see the directional arrows I drew in the past which was my thesis in how I expected the market to move at that point in time.
Where do we go from here? Ideally looking for $SPY to test $415 before entering into a large play. I'm not looking for the market to crash the next day.

Market Analysis: SPY PerformanceIn this post, I will give a market analysis focusing on the current status of the S&P 500 ETF (SPY).
As you can see in the chart above, SPY broke out above the exponential moving average ribbon (yellow and orange) lines. Increased volume confirmed the breakout. The ribbon continues to narrow which also confirms the breakout. Moving averages converge during the consolidation phase prior to a breakout. However, there are quite a few signs that are still bearish.
First, the VIX is at the bottom of its trend line and both the daily and weekly oscillators for the VIX are ready to move back up. This creates a strong directional bias toward greater volatility in the coming days and weeks.
Second, another headwind for the SPY is that we are heading into a bearish part of the year: August and September. Look at the below seasonality chart for August and September.
Third, due to extreme bearishness, market participants have begun to respond extremely bullishly to any news with a glimmer of hope, even when the news is largely bad. For example, today the Fed indicated that it would hike interest rates another 75 basis points (continuing an historic rate of change) and then, in September, start to accelerate the roll-off of assets from its balance sheet. In a normal context, the market would crash on such news, but today it rallied strongly. Even though these Fed actions will, to a very high degree of certainty, cause a recession, in the interim these actions will quell inflation, which is the market's present concern.
Few market participants have seemed to notice that the Federal Reserve has been reducing money supply at a significant rate both through direct means and through more obfuscated means. This creates a near technical impossibility for risk assets to explode higher at the previous bull rally speed.
However, there are definitely positive signs as well. After all, markets typically rise the fastest at the end of the economic cycle (after the yield curve inverts) and as the Fed signals a pivot to less tightening. Indeed, the monthly oscillators on the SPY are ready to move back up creating a directional bias for SPY to go higher in the coming months. In July, it has been steadily putting in higher highs.
More often than not, when the K line crosses above the D line on the Stochastic RSI oscillator while it is in oversold territory, the following months experience a rally. However, there are quite a few false positives of this indicator, especially in the context of a recession.
There are some important Fibonacci levels that are also acting as support. For more on SPY Fibonacci levels, you can view my prior post below:
Finally, I would be remiss not to show one last important S&P 500 chart that some may find disturbing: The yearly Stochastic RSI of the S&P 500 (see below)
This ominous chart shows that 2021 was sitting right at the top of an overextended yearly Stochastic RSI and 2022 began the process of oscillating down. In the 150 years of S&P 500 data that produced this chart, a rapid descent from this high level of over-extension has only occurred five times before. In the best scenario, the stock market only managed to go up 50% in the decade during which the oscillator corrected downward. In another case, the stock market was roughly flat for a decade (rising less than 10% for the entire decade). The other two cases were the 2000-2002 Dot Com bust and the Great Depression.
Interestingly, just last month we bounced off the third Fibonacci spiral from the peak of the Great Depression.
Perhaps this is a mere coincidence, or perhaps we'll have a mild recession like we did at the second Fibonacci spiral from the Great Depression (the recession of the early 1990s), or perhaps we are beginning a new supercycle characterized by low economic growth, recessions and stagflation.
Only time will tell.
I'm curious to hear thoughts and counter-arguments, so please feel free to comment below (but please be polite).

SPX Long -- Pull back for reset, then expect higher $41xx - $43xStrong SPX expecting higher 30F point -- looking at $41xx this week and $43xx next week with strong forecast financial report.
Tomorrow will have a pull back retest $3980 bottom -- a great chance to buy dip for Friday rally -- Apple expecting close at $160 +; Semi-conductor rally is in town!

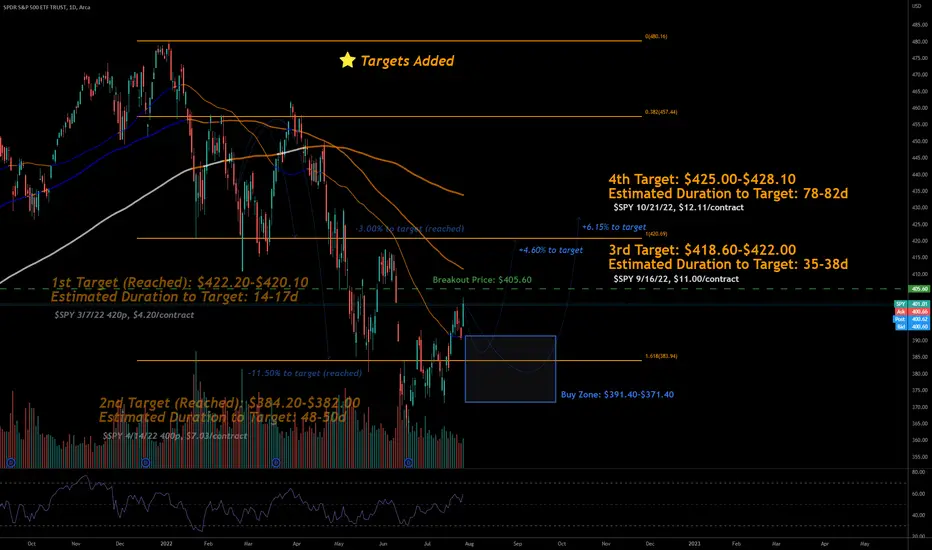
7/27/22 SPYSPDR S&P 500 ETF Trust ( AMEX:SPY )
Sector: Miscellaneous (Investment Trusts/Mutual Funds)
Market Capitalization: $ -- B
Current Price: $401.01
Breakout Price: $405.60
Sell Zone (Top/Bottom Range): $391.40-$371.40
Price Target: $418.60-$422.00 (3rd), $425.00-$428.10 (4th)
Estimated Duration to Target: 35-38d (3rd), 78-82d (4th)
Contract of Interest: $SPY 9/16/22 405c, $SPY 10/21/22 410c
Trade price as of publish date: $11.00/contract, $12.11/contract
SPY finishing off the (c) waveThe correction we have had in W-X-Y is an expanding flat that retraced 38% from wave (ii) and now after hours heading up in wave 5 to finish off the intermediate (c) wave.

SPX Long, expecting closed all week highSPX closed at $3998.95 (Almost $4000) today. Expecting a higher close point between $4010-4038.
Watch for turning point -- but mostly followed with a pull back to retest 30F(Green) pivot ZG (higher support line around $3970), and move uptrend.
Red -- drop back into the consolidation area for more wave.
-- News -- in next 10-days Xi & Biden will have a meeting (video meeting?) We'll see whether supply chain issue will smooth a little -- If works, SPX go towards $4300s.

$SPY 1D wedge/triangle breakoutLooking at the daily timeframe on $SPY we have some room to run on the upside. It's important to note 1h/4h timeframes are in overbought territory so the price could retrace temporarily before proceeding higher. The ball is in the bull's court... Also, with energy prices continuing to show bearish momentum this is a positive sign of the equity markets.

Filling the gapsAfter an impressive oversold bounce, the overall market looks set to close the last gap on the chart to $401. The earnings season is mid way through and so far the companies met the expectations. Depending on how the big guns $AAPL, $AMZN, $GOOGL and $MSFT perform, we may see a push to $407-410 in the coming week. A few digestion days above $390 will be constructive before the next leg higher.

SPX Neutral Consolidation time There area three possible way for SPX to walk - check Blue/Red/Green three way general analysis. IMHO it's going down to retest support $3900, $3940 , and even $3800, $3750 area -- most likely build more consolidation area, then decide to retest $3636, or reach for $4150 -- Follow the wave!

SPY Long towards $415Currently at uptrend towards $415 (SPX $4150-4200) . Expecting a pull back to form a 1F (blue) pivot area, then/or spike more next 1-2 days, then pull back to retest 30F ( green) pivot zone -- or build a 5F (red) pivot area for a further spike.

SPY S&P 500 ETF options ahead of big tech earningsLooking at the SPY S&P 500 ETF options chain today, i would buy the $360 puts with
2022-8-19 expiration date for about
$2.42 premium.
Looking forward to read your opinion about it.

SPX long, quick pull back towards $3880A quick pull back towards $3880 and form a 5F pivot area -- fill or not fill the gap, then keep going up towards $4150s.
overall a long trend with consolidation movement.

SPX Long structure on the wayThese couple days SPX is make it a pivot construction. Possible some consolidation, open high and close low, then breaking through towards $4150.

SPX long Builidng pivot for these couple days Today opened high, then pull back to fill the gap. Expecting another open high, then pull back for pivot Builidng. Wednesday or Thursday till Friday for a leaving spike towards $4150

Market Analysis - SPY PerformanceIn this post, I will attempt to analyze where the market currently stands, and present both a strong bull case and a strong bear case.
Bull case:
First, the chart:
The chart above shows the S&P 500 ETF (SPY) on a 4h timeframe. The yellow and orange lines are exponential moving averages that represent the MA Exp Ribbon. As noted in a prior post, the MA Exp Ribbon acts as resistance when price hits it from below. In order to pierce through the ribbon, and make a bullish breakout, a candle must do so on high volume and with strong momentum. On the bottom is the Stochastic RSI oscillator, which helps measure momentum. For the first time, in a long time, the 4h chart of SPY has seen price near the top of MA Exp Ribbon with strong momentum building to push through it. It is quite likely that the price will break through.
Second, the VIX:
As the chart below shows, the VIX has broken down from the trend that it held during its most volatile period over the second quarter. Just be cautious and patient because the VIX has not yet broken below its weekly MA Exp Ribbon.
Third, the Advance-Decline Line (ADL):
The advance-decline line has broken out and is absolutely soaring. This is possibly one of the most bullish-looking charts out there. The advance-decline line is a technical indicator that plots the difference between the number of advancing and declining stocks on a daily basis. The advance-decline line is used to show market sentiment, as it tells traders whether there are more stocks rising or falling. It is used to confirm price trends in major indexes, and can also warn of reversals when divergence occurs. Right now there is a strong bullish divergence and the major indices have yet to break out.
Seasonality:
The current period (mid- to late-July) is typically bullish from a seasonality perspective: charts.equityclock.com . Indeed, there was a bull run during this period even in 2008 during the Great Recession.
Bear case:
(Warning this part is scary - but remember never to invest or trade based on emotion)
Yield curve inversion:
The 10-year minus the 2-year Treasury yield is used to detect an impending recession. When the 2-year yield rises above the 10-year yield that creates a yield curve inversion, which can often indicate that a recession is coming. In essence, it creates the presumption that shorter-term yields are higher than longer-term yields because we're in the late phase of an economic cycle when the economy is overheating, and that soon, the economy will slow down. Right now the yield curve inversion is very steep. In fact, just last week, the yield curve inversion actually steepened to a level that was even worse than what we saw before the Great Recession.
Perhaps even more alarming is the extremely odd fact that the 10-year minus the 3-month Treasury is NOT indicating a recession. The federal reserve uses the 10-year minus the 3-month as a more reliable indicator for detecting an impending recession than the 10-year minus the 2-year.
Right now that indicator is only showing a 6% chance of a recession in the year ahead: www.newyorkfed.org
However, there's a major problem that throws into question the reliability of that indicator at the current time, and that problem is: The Rate of Change in the 10-year yield is off the charts. Look at the 10-year yield Rate of Change on a 3-month basis:
There's no way the 3-month yield could possibly invert relative the 10-year yield when the latter's rate of change is off-the-charts, unless the former's rate of change was even more off-the-charts (as we see with the 2-year, which is why the 2-year was able to invert against the 10-year).
Here's the 2-year yield rate of change:
Therefore, the 10-year minus the 3-month may be showing no inversion, not because the chance of a recession is actually low, but more likely because the indicator itself is no longer working because the rate of change in the 10-year yield is so parabolic. The 10-year minus 3-month indicator only reliably works if the assumption that the 10-year yield rate of change will be relatively stable compared to the 3-month yield rate of change holds true. In the current environment, that assumption does not hold true.
We've never seen this kind of rate of change in the 10-year yield during the period for which this indicator has been used to predict recessions. The 3-month yield would have inverted against the 10-year yield months ago, if the 10-year yield had remained relatively stable as it has during the past several decades. However, the 3-month yield cannot invert against something moving so fast to the upside. This is just simple math. This is extremely worrisome because many people are using this tool as a reason to believe that no recession will occur, when in fact, the tool has likely broken.
In the scientific community, we know that a tool only works if its validity and reliability can be established. Validity refers to the extent to which the tool actually measures what it is being used to measure, and reliability refers to the extent to which the tool consistently makes accurate measurements. In this case, the reliability of the 10Y-3M tool has broken down because the assumption that the 10-year yield would always be more stable relative to the 3-month yield is not true this time around. This time is indeed different...
So I leave you with these strong bull and strong bear considerations, and it is for you to determine how you want to play the market. Remember the rules of good trading!

SPY breakout attempt Number 1Breakout attempts can happen without any triggers but when a trigger appears and coincides with market bottom, then there is an agreement and slight trading conviction that may be worth considering into the last half of the year. There is a daily wolfe wave setup that triggered on June 21 closing day at 3767.75. The projected target is calculated by extending a linear line between pivot 1 and 4 and projecting the line. This is represented as the green perforated line, as shown in the chart. The projected target is 4332 which is expected to reach this price target before Sept 30. Projected targets are defined by identifying the apex of the wolfe wave and projecting a vertical line toward the green perforated projection tgt which is extending from left to right.

SP500 setting up for next leg upHi there,
We just completed 5 waves down, now we are changing the trend short term for the upside,
Price is inside a bullish triangle correction waiting for next leg up, up until 4300 possible
Add at spikes down longs to the target 4300, good luck

SPY About to Go Bullish? Corrections occurring in 5-3-5 patterns generally start a new rally. Wave A appears to have taken the form of a leading diagonal - Wave B (abc) - Wave C (5 wave impulse. Though we sit within a bear channel, it is possible that a new impulse has begun and that waves 1 and 2 have printed. Weekly stochastic indicator suggests that we may be primed for a move to the upside. Stay tuned for more developments.
Please let me know what you think, I am by no means an Elliott Wave pro, but aspire to be one. Criticism is welcomed!

Short week - oversold bounce?The overall market posted a higher low on Friday and closed strong as we witnessed some window dressing ahead of the July 4th weekend. For this short trading week, see if we close the gap to the 21EMA around $386. The lower than expected PCE number should offer a decent bounce at least in the short term. See how the market reacts to the FED minutes and the June jobs report.
