SPY bullish once break above hourly 100 MAThe SPY hasn't been above the hourly 100 MA for nearly a month and a half; except for a few times and it quickly rejected. It looks like we will get above that MA today and I would expect the market to really start lifting and turning bullish. This could be what is needed for the market to finally start moving high from these level. And if it does I'd expect it to be very strong.
Spylong

$SPY Let's See Where We GoCurrently, $SPY is working with in solid range, but it looks like $385 might be the bottom. If it breaks $385 we will move down to $330 but I doubt it breaks. I think is not the beginning of the end but the start of a new trading pattern. Chop possibly for the rest of the yea. Up and down movement working within the range of $450-$410, but again the market can do whatever it wants but my guess is we do not see $500 for another 2-3 years, we got some consolidation to do before we get that type of movement, the last two years are bad examples of the market volatility and movement. The market relied heavily on tech stocks to bolsters itself through the pandemic, with strong earning reports quarter after quarter from the FAANGs (largely tech companies), the "market" was able to rally. The "rally" was more so bullish sentiment built on a façade, it was like looking at a mirage of water in a desert, it looks great but when you finally get there, there is no water. That is how our market acted, we finally got to the top, we got out of the pandemic and we realized there was no water. The market was overbought, there is a myriad of reasons why: stimulus checks, retail trading boost, people staying home, transportation cost reduction, you name it. Yet no one factored any of these into their estimations, like how could you not factor in the price of gas in a company like Amazon, gas costs went down, product costs remained the same, margin increase. But let's say you did see that and factor it in, you also missed the fact that over millions Americans continued to eat, while the workers to produce food decreased, leading to a decrease in reserve supplies to produce food, leading to global shortages that we will be facing in the next couple of months. By the time most people realized this, it was too late. But none of the matters because now people overreacting, they are selling everything and that's where you the smart savvy investor come in.
Snapchat is down 40% today (5/24), oversold, when people are bearish bad news becomes the worst news in history, and this plays into my theory. That the reason the market is tanking is not due to some economic collapse, the stock market doesn't work in tandem with the economy anymore, not since 2008. If it did, 2020 and 2021 would have been much worse. No the stock market operates on it's own and is controlled by major capital. Tech stocks need to rebalance, they were overbought, this should not be a shock to anyone. In order to achieve in equilibrium in the stock market we most lower the prices of the FAANGs + MTBV, this will allow the market to find a balance to build up from. The issue with selling the FAANGs + MTBV is that drags down the entire market, which if you remove the tech sector has been down for the last couple of months, so mid-caps and small-caps have been hammered by this downward movement. Snapchat being down %40 is a buy opportunity, Pinterest losing 23% off Snapchat bearish sentiment is a buy opportunity, Trade Desk hitting almost a 2 year low, buy opportunity. Even if I am wrong, and the market turns down for the next 1.5 years, in 3 years you will have made a profit. That is the wonderful part of the stock market, in a 20 year time span you are less than 0.01% to lose money. But if I am correct and the market jumps from here you just missed your best buy opportunity.
FAANGs + MTBV:
Facebook (Meta)
Apple
Amazon
Netflix
Google (Alphabet)
Microsoft
Tesla
Berkshire Hathaway
Visa

SPY bullish divergencesSPY bullish divergences on daily times frame I'm waiting for break of the falling wedge and retest the broken trend lines might see huge market reversal to the upside

S&P 500 Bounce Expected after 8 Red WeeksSP:SPX
We are at extremes...
Bounce expected after 8 red weeks.

SPY - S&P 500Yo!
Elliot waves with fib levels.
possible outcome using fib levels.. pure technical..
remember macro economics still looks bad..
Have a nice week and Good Luck,
t347
AMEX:SPY

$SPY higher lows and the beginning of a new active sequence?The overall market posted a higher low yesterday which is reminiscent of the action from March 14th. If this pattern develops in a similar fashion, we expect to see a sustained rally in the next couple of weeks. Today's action will be very important in determining the direction for next week. Will early strength hold and build throughout the day or will the sellers reject price around yesterday's highs?

S&P 500 ( BEST Buying Area ) LONGSince we are facing a supposed Crisis, we are going to try to analyze which zones can be the best buying zones for the S&P500 and be prepared to be able to buy Shares, participations in the S&P500, etc. when the time comes.
We can see that by technical analysis, we are in an uptrend for years. The Fundamental supports are:
- 3194 : Represents the 61% Fibo of the last impulse from COVID19 + Bottom of the Channel.
- Between 2508 and 2185 : ( Zone ) Institutional Support + 61% Fibo of ALL the impulse since 2009.
- 1863 : Last Zone of Institutional Support.
- In case of a break of 1863 the next zone would be between 800 and 700 ( it would be an extreme Chaos )
All these scenarios are possible, although each point mentioned above is less likely one than the other to happen, but you always have to have a broad view of the market.
- The first buy signal to watch for is the monthly RSI. When it reaches the Low levels and we observe a Reversal in the indicator, it has always been the best buying point.
- The next buy signal to watch for are the above mentioned points. The price must converge at the same time in the zones mentioned above. We do not know exactly what point the price will reach, but we do know where we should look.
Once the two scenarios happen, we can prepare to BUY a good amount of Stocks or the S&P500 itself.
These are scenarios that happen very few times in life, we must take advantage of them. In 50 years as we can see we have had 3 equal opportunities that we can live again, from the first opportunity we had 28 years passed until we could have a new similar purchase signal, then 7 years passed until the next signal, and this time ? we are still waiting, 13 years have passed since the last opportunity, but it seems that we are closer to a new golden opportunity ... . Therefore, it is essential to have sufficient liquidity.
Good luck

$SPYThe investment seeks to provide investment results that, before expenses, correspond generally to the price and yield performance of the S&P 500 Index. The Trust seeks to achieve its investment objective by holding a portfolio of the common stocks that are included in the index (the "Portfolio"), with the weight of each stock in the Portfolio substantially corresponding to the weight of such stock in the index.

Spx500 Long SignalVery bullish close yesterday, could see this as the low of the day but we will see how it plays out. If stopped will look for another long opportunity during NY

SPY on a tentative channel bottom from POST covidGood morning friends,
I'm seeing a good starting point for a SPY rebound movement and we have a good shoulder head shoulder pattern with potential to reach 415 if breaking the support on 410.
We have until June 10th for the next CPI information which it might be interesting to close positions near those dates on some short term opportunities.
Happy Investing,
Leo!


$SPY breakout in progressLooking for the retest of 410.64 daily level. Over 410.64, expect 416 in extension.


SPY bullish to 440 in about 4-6 weeksBroke down a lot of analysis in my weekly outlook video on youtube. I looked at the 2 previous bear markets, excluding the 2020 so the '00-'02 and '07-'09. Found some very interesting similarities. But we are, at least for now, oversold on many technical indicators. And really the market over extended to the bearish side, and now we will go and over extend to the bullish side. Just the way the market works. One interesting statistic I found was that bullish moves after the bearish moves this early on in a bear market, retrace about 85%. That would get us back to the 440 level on the SPY. SPY get over 432, it will be back within 10% of all time high. You will start to here the narrative that the market is out of a correction; that will push it to 440. But that will be the time to bail. Hope you had a great weekend. Time to get back to work.

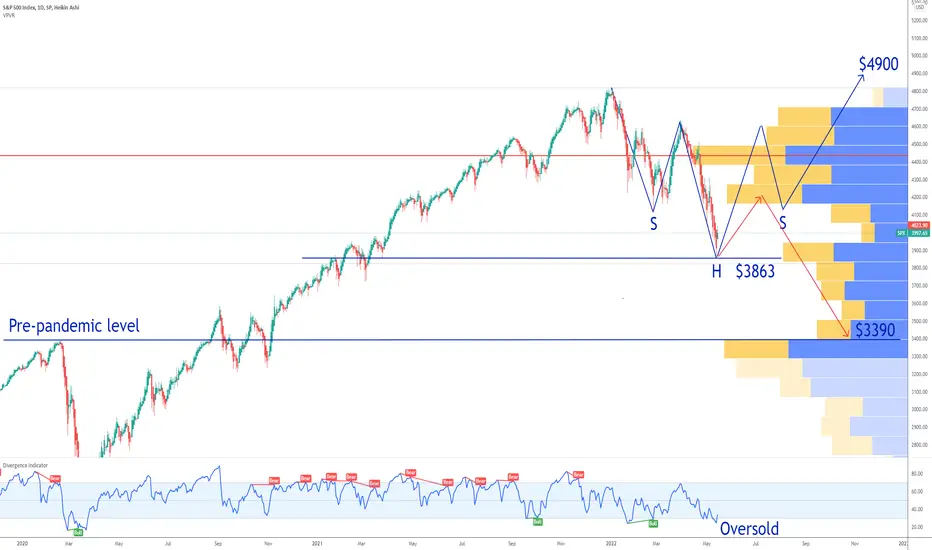
S&P 500 inverse Head and Shoulders Chart PatternWe are on the daily timeframe and we can see that historically buying the S&P index on RSI lower than 30 is an opportunity.
Current S&P 500 PE Ratio is decent: 20.34
Min: 5.31 (Dec 1917)
Max: 123.73 (May 2009)
I have 2 scenarios:
1. Inverse head and shoulders chart pattern with a price target of $4900 by the end of the year.
2. Worst case scenario: bull trap at $4150 an retracement to the pre-pandemic level of $3390. I tend not to believe this scenario because of the too low price per earnings ratio of the S&P.
Looking forward to read your opinion about it.
Has the market found a bottom?Yesterday's action in the $SPY is a bullish sign for the overall market. We put in a low around $385 which coincides with the recent head-and-shoulders pattern that had a price target around $380. With futures higher today, there is some room on the chart to $400-404 before encountering more resistance. If this was a temporary bottom, watch the semis and small caps for clues. Putting on more risk vs this level is a good risk/reward strategy for both active and long term investors. $AAPL reaching $138 and $MSFT $250 are further confirmations.

$SPY April 2022 CPI data are scheduled to be released on 5112022The investment seeks to provide investment results that, before expenses, correspond generally to the price and yield performance of the S&P 500 Index. The Trust seeks to achieve its investment objective by holding a portfolio of the common stocks that are included in the index (the "Portfolio"), with the weight of each stock in the Portfolio substantially corresponding to the weight of such stock in the index.
SPY S&P 500 Compared To 2008 - Will We Follow The Same Pattern?The daily chart for the S&P 500 looks eerily similar to the chart from the 2008 crash. We have already crossed below the VWMA 100 and VWMA 500 now which are both historically very supportive moving averages. I think it's very possible we chop around in this area for the next couple weeks while we wait for the VWMA 100 to cross below the VWMA 500, but if we can't stay supportive back above the VWMA 500, it will likely fall pretty hard. If it's anything like the 2008 crash, it should be a steep drop from here, but there are a lot of other factors at play so we will just have to wait and see.
The 2008 drop fell 56% from its high over about 510 days. If we perform the same this time, that would mean a drop to around $210 that would happen around the middle of 2023. Again this is just if we repeat the exact same thing statistically. $210 is also the low from the 2020 pandemic crash and a likely area for it to hold if it does make it down that far.
Something to note though is that when matching the two timeframe's chart patterns, the 2008 chart pattern took twice as long to play out. So with the bottom reaching a 56% drop over 510 days, it looks very extended and not very similar to the timeline from 2008. This makes me consider that if we do follow the pattern from 2008, it may happen in a shorter timeframe such as a year or so. This is purely speculative and obviously there are a lot of other things that factor into this, but I'm just comparing chart patterns here as possible outcomes.
We should see some good support in that purple cloud though on the way down. Those are the EMA 1000 and EMA 2000 which I are typically very strong support/resistance.
If we do follow the same pattern as 2008, I'm waiting for price to reclaim and stay supportive above the VWMA 100 before entering LEAP Calls when it rebounds. Then wait for price and the VWMA 100 to get back above the VWMA 500 for confirmation of another actual bull run to begin (but that could take 2+ years to happen again if this scenario plays out).
Drop your thoughts in the comments, I'm curious to hear what others have to say on this comparison.

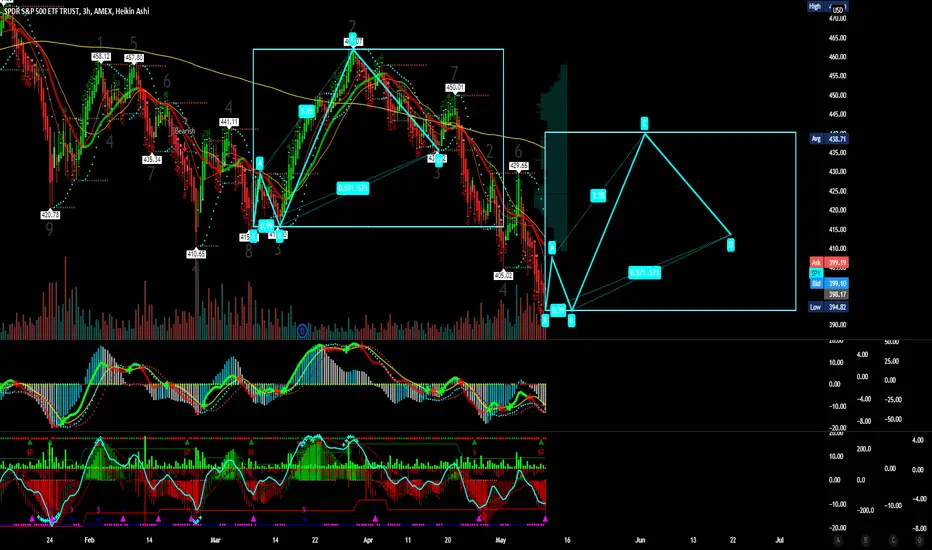
MM False Bearish Breakout (SPY) Although I am titling this idea as "Long", this is more neutral than long, although it is geared towards Long.
As we can see, many stocks such as $FB are down nearly 50%. This includes $NFLX and many others. That being said, $SPY is only down about 17% , far less compared to many other major stocks (AMZN is > 40% down from its highs!).
One of two things are likely to happen.
1. $SPY possibly falls a little bit lower, and then rips up 6-12% points before it eventually makes a longer term dive, or
2. The more likely option: $SPY and other stocks find temporary bottoms soon (not necessarily today or tomorrow, although not impossible), and then starts a new trend which is either more continued consolidation, or the beginning or continuation of the old uptrend.
EITHER WAY, stocks are likely to find some sort of temporary "bottom", and then rip from there.
Again, consult the Fear and Greed Index: 20: Extremely Fearful.
www.cnn.com
Even if we are heading into a recession (as many around me and people in the news are pointing to), even in the 2008 housing crash, on the way down the overall market made 6% jumps, 10% jumps, some even up to 15% jumps. As technical analysts we must take advantage of these swings and use them to our advantage.
We Know that stocks such as $AMZN, $GOOG, $FB will likely do some sort of DCB, or retracement. When this occurs it will propel the overall market to rip up potentially bringing it into a new uptrend thus around now and the next few weeks could be a great buying opportunity for new investors... That is of course all relies on whether or not $SPY can hold above the trend lines I drew all the way back from August 2021. If price action cannot quickly shoot up above support, and continues to fall from there (potentially coming back up to go down again) then we are in for a not-so-fun ride.
Let me know what you all think in the comments below! This post was kind of rushed since I have been off of Trading View for two years getting more practical experience and knowledge of TA, and was itching to do another post since I forgot about this site. I plan on doing more posts here in the near future to get more feedback.
I am always learning, so please feel free to reach out to me and let me know personally what you think of my TA, or just write it in the comments!
Good luck everyone!
M

SPY at 400, close bearish and go bullishPutting this out a head of time. So you can get your plan ready to go. As the SPY gets to 400, close bearish positions and go bullish. The 400 price level will fill the open gap from April 2021, and a target I have planned for since December. I'd imagine the VIX will also be spiking. I will be picking up Sep '22 430 calls, as I expect we will have a bounce that lasts probably 2 months. I will have more analysis in my weekly outlook YouTube video later today. Good luck traders.

SPY - 480 retestif war ends tomorrow and inflation drops by a magical hand, I would expect this to happen. :D
made for fun, dont take it serious!
not investment advice!

SPY Inverse Head and Shoulders PatternI think SPY is forming an Inverse Head and Shoulders Bullish Chart Pattern with a target of $480 by the end of the year.
Today the Contrarian Investing is a good idea: "Buy When There's Blood in the Street"!
looking forward to read your opinion about it.
