#SPY/SPX500 UPDATES FOR #CPI
This idea is base on previous high.
We might see a short squeeze below before it goes up to our target at 445$
This is not a financial advice, follow for more
Spylong

$SPY (SPDR S&P 500 ETF TRUST)AMEX:SPY (SPDR S&P 500 ETF TRUST)
Next Target $440.08
If you had invested $1,000 in AMEX:SPY on June 10, 2013, at a price of $164.80 per share, you would have been able to purchase 6.06 shares. As of June 6, 2023, the price of SPY was $428.03 per share. If you had held onto those shares and not reinvested the dividends, your investment would have grown to $28,997.22. This represents a total return of 190.06% over the 9.99 year period. SPY paid a total of $49.99 per share in dividends over this period of ten years. Therefore, if you had held onto those shares and not reinvested the dividends, you would have received a total of $302.94 in dividend payments. However, if you had reinvested all dividends, your investment would have grown to $31,289.39. This represents a total return of 212.78% over the 9.99 year period.
This week is packed with news and events. The FOMC is the big one of the week, but we also have CPI, PPI, Bond Auctions, Oil Reserves (which may be important with the OPEC cut), and plenty of other big news. Any unexpected changes or hints about future interest rate decisions could significantly influence the stock market behavior due to their implications for rates, timing, and monetary printing.
*Disclaimer*
The information is purely for *entertainment* purposes, and is not meant to be, and does not constitute, financial, investment, trading, or other types of advice or recommendations. Do Your Own Due Diligence (DYODD)

SPY going up based on point and figure count of accumulationThis idea is based on Wyckoff's method for calculating price targets using the point & figure method to count the difference in columns between beginning and end of accumulation prices and projecting it from the middle point of the accumulation range.
All other info is on the chart!

ES1! Bullish march continues to 4380+ as long 4230 holds/reclaimAs long 4230 holds or reclaimed, 4380 / 4395 in play
Approaching key resistance around 4315-4328 (Swing high from Aug)
Read more details on the chart.

SPY S&P 500 Index ETF and the Debt Ceiling DealThe political climate is favorable for a small rally of SPY, the S&P 500 Index ETF, towards the next resistance level of $430.
After several weeks of tense negotiations, President Joe Biden and House Republicans have reached an agreement in principle to address the debt limit and cap spending. The debt-ceiling deal is now finalized, and here are significant parts of the agreement:
First, the agreement suspends our $31 Trillion debt ceiling until January 2025, providing some relief and avoiding immediate concerns.
Additionally, the agreement ends the pause on student loan repayments, allowing borrowers to resume their payments. This decision aims to ensure the stability of the student loan system and address the long-term financial implications.
Furthermore, the agreement includes stricter work requirements for low-income and older Americans who receive food stamps. These requirements are intended to encourage self-sufficiency and help ensure that federal aid benefits are effectively utilized.
Regarding IRS funding, the agreement entails a $20 billion reduction from the initially proposed $80 billion budget. This reduction specifically targets the allocation meant to crack down on tax evasion by wealthy individuals and corporations.
Moreover, the deal puts an end to the ongoing freeze on monthly student loan payments and interest. It also introduces restrictions on the President's ability to reintroduce such a freeze in the future.
To avoid contentious debates until after the next presidential election, the agreement suspends the debt limit until January 2025. This decision provides a temporary relief from potential conflicts surrounding the debt limit.
The agreement also implements new work conditions for Supplemental Nutrition Assistance Program (SNAP) recipients, raising the age limit for work requirements to 54. This measure aims to promote workforce participation and enhance the effectiveness of federal aid programs.
Overall, this comprehensive agreement addresses various aspects of the debt limit and spending caps, aiming to strike a balance between fiscal responsibility and supporting those in need.
My overall outlook is still bearish and i think the small rally could easily turn into a bull trap.
Looking forward to read your opinion about it.

$SPY Inverse head & shoulders AMEX:SPY Inverse head & shoulders pattern still in play, target is around 425. Monday is a holiday here in the U.S. and we most likely will see a holiday hangover trading week with light volume.

The best buildup and breakout $SPY has had since the 2022 top!Is this a buy signal? Or is this just another fake out?
Risk below $403.75

Break out over resistanceYou could play this breakout or you could wait for a re-test of support before deciding to go long a swing or position trade on SPY or its holdings.

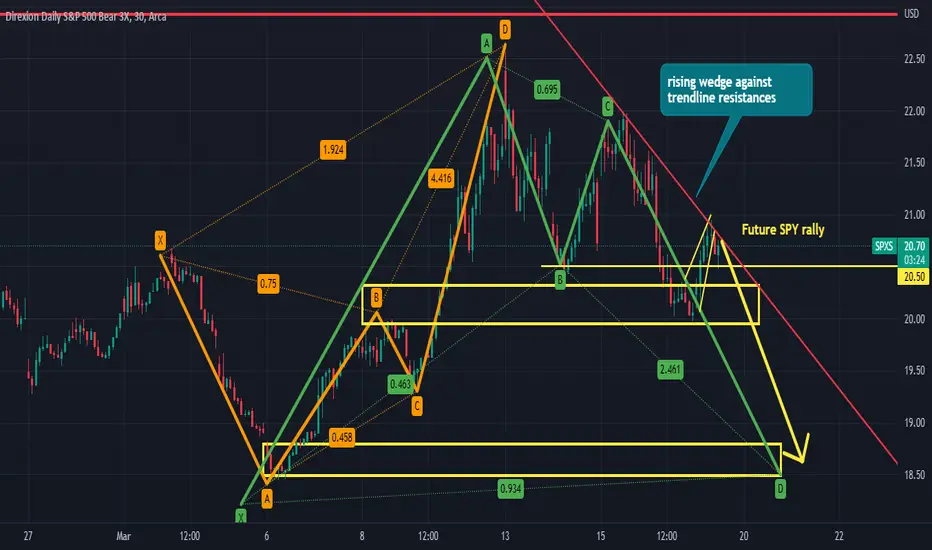
short the C leg of the bullish cypherthere is also a rising wedge into a trend line resistances. The B leg of the previous bearish cypher acted as inital bounce area, as a result I see a future spy rally set up into the close today. This can also push $spy for $400+ $4080 SPX
SPY/SPX500 UPDATES
It never change my idea on 431$ top.
ranging markets means looking for liquidity.
maybe this month the SPY could trigger our target..
This is not a financial advice.
Follow for more

Current daily channel on spy hope it helps you understand the current volatility rnage of the asset.
keep in mind that he can change profiles quite easily (a good indication of this is a sudden increase in "speed" and volume).
I personally like the idea of looking for entries with confirmation at the bottom (aimed at the top of the channel), but also gives an idea of the area where more attention is needed

Power of the Pattern inverse Head & Shoulder SPY ETFInverse head and shoulder's pattern still looks good. Federal reserve meeting on May 3rd could change that!

SPY Inverse Head & Shoulders Pattern Power of the pattern! Will the SPY ETF Inverse Head & Shoulders Pattern play out or will the Federal reserve Jay Powel and company change the direction of the stock market on May 3rd?

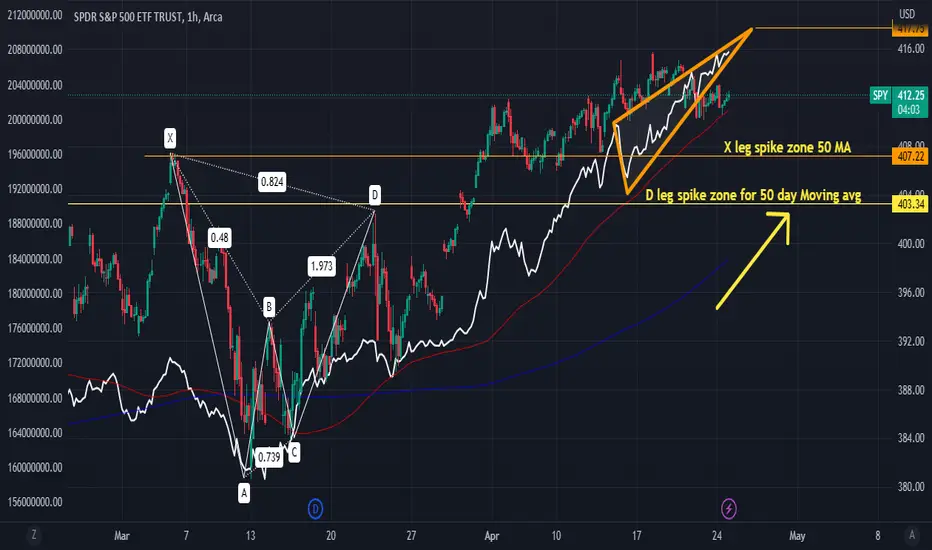
AD Ascending Triangle 1hr Chart target $417The 50 Day Moving avg is looking to cross both D leg, and X leg of the Bearish Cypher pattern. These are past resistances levels, once both these levels are crossed over. I fully anticipate price action to go higher. In Fact the AD has an ascending Triangle Pattern to 417 on the 1hr time frame. For short term traders and swing traders this is a bullish set up
The inevitable collapseDXY looks to be at a reversal point, or is it? This is why I love looking at a ticker in relation to another by using the / symbol. The way it works is ( ticker youre interested in )/( in relation to another ticker ) . For this instance we will look at both DXY/SPY and SPY/DXY. Typically SPY and DXY do not move in correlation, in fact they move in the opposite directions. When the dollar is strong, stocks fall as more people invest in the dollar as opposed to stocks. In the contrary when more people are investing in stocks, there is less money being put into the dollar.
First lets look at only the DXY chart.
Here we are looking at the weekly chart of the dollar. Although we are still in a downtrend, with the 9,21 and 50 ema stacking to the downside, there seems to be the possibility of a double bottom occurring at a previous support level of 101. By looking just at this chart, the dollar looks primed for a reversal. The question is how strong of a reversal will it be?
Next lets look at the DXY/SPY chart.
This chart is a much different story and shows tremendous weakness in the dollar in comparison to stocks. We have a head and shoulders with the last reject off of the 200ma. The candles are following the downwards momentum along the ema with the continuing lows of the MACD and RSI.
Last, lets look at SPY/DXY
As SPY and the dollar are inversely correlated its no wonder that this chart is showing significant strength in SPY. We have an inverse head and shoulders with the 9,21, and 50 ema going upwards also followed with the upwards trajectory of MACD and RSI. If there is a break of the resistance line, I am even more than certain we are on our way to another bull run. I know the thought of a bull run sounds insane with so much talk about a recession but do you think the market wont be prepared for a massive short squeeze as everyone and their mothers have gone short in anticipation of a killer recession? Remember, the market never does what the masses want it to do.
TLDR: DXY looks poised for a reversal but comparing DXY to SPY by looking at DXY/SPY and SPY/DXY shows significant weakness in the dollar in comparison to stocks. DXY and SPY are inversely correlated. All charts combined shows we may have a slight bounce in the dollar, but there is more downside still to come.

Challenge my Elliot Wave Count looking for $406 $spy Posting this, because they're so many Elliott Wave Experts on Trading View. They always come to my posts to challenge my wave count, and it always goes in my favor. However, they never stick around when the trade goes in my favor, and worst they dont post any charts of their own when I challenge them..
So I'm doing an open invination for all $spy, $spx $es traders to post a chart w/ their wave analysis. I stand by my charts and analysis and I trust the money flow. I'm looking for $406 soon on $spy
keeping it simple, we close above yesterday which is extremely bullish. We had a bullish ABCD pattern, which based in a cup/handle pattern w/ a bull flag .. I ran my Elliott Wave Count from the ABCD pattern to the cup/handle pattern. We're now at an Apex...
Either The Bull Flag/handle pattern is incorrect of $spy Drops to $370-380 starting tomorrow... I'm following the Money, what are you doing. Lets see some charts, and I welcome feedback...

Price action needs to close above X leg & wave 4 $412im a buyer of the dips. looking for previous resistances to become future support . The uptrend is intact , in fact this is a bear trap. Notice how buyers stepped in on C wave of the ABCD pattern, when it retraced. Bears are trying hard to push this to wave 2 near b leg of the bearish cypher pattern around 409.36... A massive short squeeze will occur...

spy to 420-430Spy last form meting dropped nd then with that drop lead a bullish run we can see from the same trend 420 could be the nest target. But must pass 414
Bullish 414-420-430-431

S&P Short Term ATH?The sell off that started in December 2021 and January 2022 was thought of the "crash" that most logical analyst and economist are waiting for. It was illogical for markets not only recover the March 2020 sell off but set a new ATH during a year which saw the largest unemployment event also a pandemic and recession. The rally we know was Fed induced stimulus through QE corporate bond buying.
The day the Fed announced tapering, rate hikes, and shrinking balance sheet is when the markets started selling. It wasn't ANY other reason except this. A market fueled by Easy Money will not continue to rally if the very things that fueled it are taken away.
The rallies we have been witnessing are fueled by Corporate Buy Backs. In fact, according to Bank of America data, Retail Investors and Institutional Investors are still net sellers. This rally will be short lived. The economic data is still worse than expected and getting worse.
BUT .. it seems that we will see a new ATH for the S&P500 before the actual crash happens. The Nasdaq should not make a new ATH, but the Dow has a great possibility it will. We could see a Double-Top followed by the crash or a new ATH.
A conservative 35% fall would put the S&P in the low 3,000s.

Here's Why the Stock Market is at Risk of Further DeclineThe chart above shows the S&P 500 (SPX) relative to the price of the 10-year U.S. Treasury bond (1/US10Y). As you can see, when adjusted in this way, the S&P 500's decline in 2022 is no longer apparent. This could be a warning that further stock market decline is to come.
Let's walk through why this may be. First, it is important to understand that an interest rate is simply the cost of money. Central banks use interest rates to raise or lower the cost of money, which can impact the money supply by lowering or raising it.
For details on how the interest rate can impact the supply of money, you can check out my post here:
When we look at a chart of the yields on the 10-year U.S. Treasury bond, as shown below, what we're actually looking at is a chart of the cost of money.
When the Fed says it will continue to hike rates and hold them higher for longer, what the Fed is really saying is that it will continue to raise the cost of money and keep money costlier for longer. This is bad news for the stock market because it is unlikely to undergo a massive bull run while money remains scarce. In fact, Fed Chair Powell recently stated that a high stock market valuation is a cause of the labor shortage. High stock market returns incentivize people to retire early and live off of investment income. Combined with the already difficult demographic headwind of an aging population, the economy becomes faced with too many people consuming and too few people producing. This is a major cause of the labor shortage. Thus, if high stock market returns are a cause for the labor shortage, and the Fed's goal is to mitigate the labor shortage to mitigate inflation, then the stock market is likely to face prolonged headwinds.
A massive bull run in the yields on bonds has come along with a rapidly declining supply of money. Until this trend ends, there is simply not enough money to propel the stock market to new all-time highs. Remember that the stock market is largely a measure of corporate earnings, and corporations can only ever earn some subset of the total money supply. What might a record decline in the money supply say about the future of corporate earnings?
Government bonds, especially U.S. Treasury bonds, are considered risk-free assets since the central government, which issues these bonds, has the ability to print more money and thus can always afford to avoid default. In a normal market, whenever higher interest rates are demanded by market participants for an asset the market is saying that it perceives greater risks associated with that asset. The higher interest rates compensate investors for the greater risk. Since the rates on U.S. Treasurys have soared, the market is sending the message that it now perceives these assets as riskier. Although Treasurys can be perceived as risk-free from a default perspective, there is still a risk of loss, especially when higher inflation becomes entrenched for the long term. The increased risk can actually become a positive feedback loop because as the market demands higher rates due to inflation, then the government will have to pay more to service its debt. Such an expansion in the cost of debt service can cause the market to then believe the bond risk is higher, and the market may demand yet even higher interest rates. (Although the central government can always print more money to pay its increased debt, for political reasons it may choose default instead. Thus, there is a risk of default even for theoretically risk-free bonds). Furthermore, even if the central government chooses not to default, it will be forced to print more money to service higher debt which could worsen inflation and, in turn, keep rates higher for longer.
Therefore, it is important to understand that in the face of high inflation, risk-free Treasurys have become risky relative to their historical norm. In that regard, since all other assets except physical gold (e.g. stocks, corporate bonds, cryptocurrency) are inherently more risky than Treasurys, all other assets become less stable. This concept is illustrated in Exter's Pyramid, shown below.
When an asset class lower down in the inverted pyramid becomes unstable, everything above it will experience some greater degree of instability. The most speculative fringes of the market (the top of the inverted pyramid) are likely to experience outright liquidity crises. We are already beginning to see this in the cryptocurrency space which is not pictured on the pyramid, but which if it were, would be near the top.
So a massive bull run of the S&P 500 relative to the price of 10-year US Treasurys is not a good sign.
What this chart is showing is that the S&P 500 is becoming more and more overvalued relative to risk-free Treasurys, even as the S&P 500 nonetheless sells off! The amount of capital that is currently invested in the S&P 500 is too high for the yields on 10-year Treasurys to be as high as they are. This suggests that capital will tend to flow out of the stock market and into less risky and higher-yielding Treasury bonds.
The Federal Reserve is trapped by commodity inflation because it cannot cut interest rates, or make money cheaper, without worsening commodity inflation. If scarcities of commodities continue to weigh on commodity prices, keeping them elevated even as demand cools, then the coming stagflation is likely to be severe.
Since the yields on the risk-free Treasurys have skyrocketed, this means that even after all the declines we've seen so far, most assets are still overvalued. Look how high the value of Nasdaq 100 stocks has risen relative to the risk-free 10-year Treasury.
The last time this happened was right before the Dotcom Bust in 2000.
Although this relative chart does not predict whether the price of Nasdaq 100 stocks will go down, or the yields of 10-year Treasurys will go down, it does suggest that if the yields of 10-year Treasurys remain elevated, as the Fed suggests will happen, then the price of Nasdaq 100 stocks is likely to fall even further.
In the chart below, we can see that the fastest and most extreme yield curve inversion in history is occurring right now. This could suggest that the onset of the impending recession could be as equally fast and as extreme. The abruptness of FTX's collapse due to liquidity issues could be a harbinger of what's to come.
The Federal Reserve is already adding liquidity back into the banking system.
Job openings likely reached their cycle high and will continue to decline into the foreseeable future as the supply of money remains some degree tighter into perpetuity.
In the U.S., population and GDP grew at an exponential rate over much of the past century. This, in large part, allowed for the money supply to also grow at an exponential rate without high inflation. Since the stock market tracks the money supply, the stock market also largely grew exponentially as well. However, as population and GDP growth slow, this creates the risk that an exponentially growing money supply may result in persistently high inflation.
In the coming recession, which will likely be characterized by severe stagflation, central banks will likely have to convince the market that high inflation is good.

Bullish above last month HIGH Buy signal still valid SPX SPY SNPWith all the Doom & Gloom regarding recession worries we liked our idea even more so into Q1 close last month.
So far so good however we are still very early in Q2.
We remain bullish above last months high (March 2023)
Seeking Pips will be managing our positions on the Weekly and Daily charts.
We also note that the current price is also in a key Fib retracement zone to SELL SPX on the monthly chart so we will not be surprised to see another pullback, again we would consider adding to our core position if this happens and volatility is right.
Our Bull & Bear price level is clear and as long as we above it we want to be buyers only.
A failure of March 2023 Low we would have to revaluate our current thesis.
Happy trading have a GREAT WEEK.!
===============================================================
SUBSCRIBE TO OUR CHANNEL & FOLLOW THIS TRADE IDEA FOR UPDATES.

SPY Analysis | 3.3.23Next, we should challenge 417.47 if we cannot break we can head back down all the way to 398.48. AMEX:SPY

SPY analysis, 3/30/2023 -- Inverse head and shouldersInverse head and shoulders officially confirmed and we have a clear path to 425. I don't expect it to be quick or easy, this market has been nothing but chop! This is a rally to fade but as long as retail is piling in I will as well.
