SPY MANIPULATION UPDATESThis is bullish. 427 target area.
NOt financial advice .trade base on your own decissions.
Follow for more .
Spylong

30min bull flag short scalplets see if we can get another breakout from the 2nd bull flag on the intraday... My target of $398 already high..
Dont be greedy here if you're already in good profits... I'm playing some otm calls at 398 intraday for a scalp, just sharing this trade.. be nimble, not for everyone

XLF Triple Bottom Support for SPY Bulls, QQQ Daily Bull Flag, - XLF holding triple bottom support 15m, holding above yeseterdays low bounce off of it 3 times today, first initial sign for the bulls. Now bulls need the hourly trend change for XLF back to an uptrend to help SPY
- QQQ's drop may seem a lot today due to how fast we pulled back from the morning but we are still way above 0.386 fib retracement on daily therefore QQQ is still in a bull flag zone.
- if XLF starts bouncing and changing trends i am likely going to swing some short term bull positions in the leverage 3x SPXL TQQQ TNA

Daily SPY technical analysisYesterday spy make strong support. so, it is time to pull back to the up trend. today we can find buy entry from mentioned level of the chart.

SPY UPDATES
fORGOT to update this idea, This made huge on options traders when this previous ideas posted. resistance zone hit. now im looking for a buy after the sweep before that makes ob.
Follow for more Free ideas..

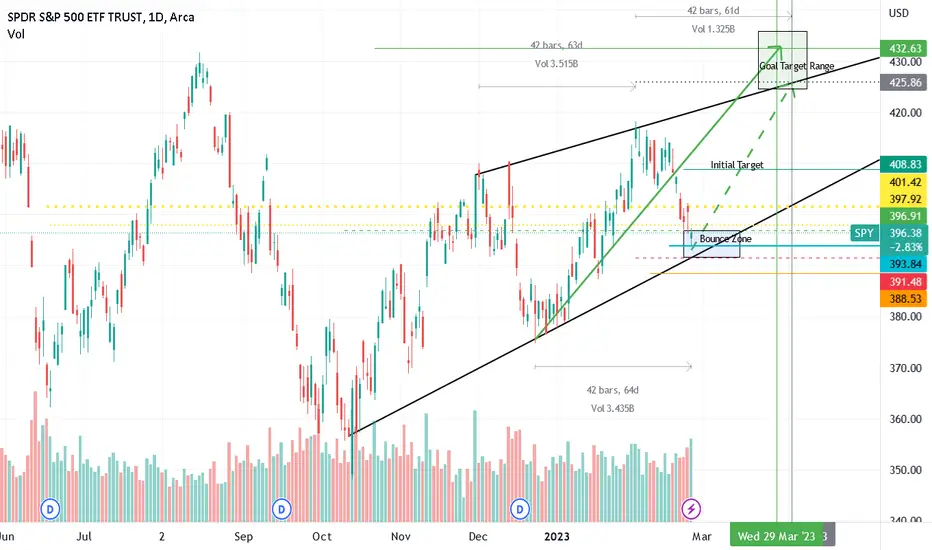
Its More Straight-Forward Than You ThinkThis is an Update to my previous SPY idea - same target/time to target, just more simplified. After the last 2 weeks there is a lot of bearish sentiment but its really just finding support at wave 4 of a leading diagonal.
The initial target is 408 in the next week or 2, and then goal target is 425-432 by late March-Early April.
The symmetry in the waves indicates this is a leading diagonal (or bearish wolfe wave that is about to complete the final wave). Either way its still bullish near-term. After 425-432 there will be significant downside risk, but for now expect a nice rally through March.
We are in the bounce zone, there is still risk to 388-391 early this week, but if any of the following occur we won't see the 388-391:
- retest and hold 393
- close above 397.92
- Intraday breach of 401.42 (above 401.42 it will turn into explosive upside)
SPY & QQQ 15m Trend Change Back to Bulls, Need 1h trend change - After this mornings hourly bear flag with no follow through from bears bulls try to play defense and we had a megaphone pattern play out in the morning.
- QQQ was holding SPY up for the entire day, then the last 30mins bear sectors in SPY joined Bull sector QQQ.
- need to confirm a hourly uptrend to set the daily higher low for bulls.
- would like to see bulls play offense tomorrow.

Spy ZonesHave Fun Getting an AP Lads! Here are The Zones That May Play Out in The Coming Days/Weeks.

15m 12EMA Perfect Guide For Both Long & Short QQQ & SPYLast week i mentioned the 15m 12 EMA guide for holding onto profits for both SPY and QQQ which we bounced off again this morning. After we broke the 15m 12EMA today i took a day trade on SQQQ and sold it close to the end of the day because we are still in a strong hourly uptrend and I do not want to hold overnight playing countertrend.
Notes:
- still need to change 4h and daily trend to uptrend, currently in neutral trend
- Even thought i shorted today im still leaning bullish on SPX and NASDAQ for longer time frame in 4h / daily and weekly. until price action tells me otherwise so would likely be looking for another TQQQ entry.
- Powell speaking this week
- we shot straight up 5.5% on QQQ into resistance a pull back for consolidation was very likely

SPY watch after a year of a down trend , and by using the wma indecatore we can see signs of reverse . we can confirm in the few next months if the price broke the support and resistance level

Gap Up or Drop Down?How's it goin traders, hope this recent rally has been treating you guys well. Here we have a potential gap up setup. We have a very aggressive uptrend currently and, we are approaching some supply zones that we will test and see if they prove to be strong resistance. Right now I see more up before we take profit/ have a small pullback. Thoughts traders? Have a good one!

SPY I Pullback and more growth to comeWelcome back! Let me know your thoughts in the comments!
**SPY Analysis - Listen to video!
We recommend that you keep this pair on your watchlist and enter when the entry criteria of your strategy is met.
Please support this idea with a LIKE and COMMENT if you find it useful and Click "Follow" on our profile if you'd like these trade ideas delivered straight to your email in the future.
Thanks for your continued support!

$14,600 Profit on TQQQ Swing Trade, What to look for next week. A deep technical analysis as to why I took profit on my 8000 shares of TQQQ and some mistakes I made on my trade that I could of done better.
- Also what to look for on Monday, Monday is likely a buying the dip opportunity day for the next move up on SPY and QQQ, i explained what we should be looking for to be buying in again.
- the weekly higher low is set and i will be playing off of it
- bulls are still in a weekly uptrend and now we have to change 4h and daily trend back to the bulls.

HOW TO RIDE Your Profits FULLY - 12 EMA BULL TRENDING $QQQ $SPYYesterday I talked about how bears had no follow though at market open and bulls took over after we broke above resistance and that we will very likely get another bull move today higher.
- Both SPY & QQQ were trending on the 12 EMA super strong and did not break below it at all
- bull 100% comfortable holding their positions throughout the entire day with zero signs of any red flags so far
- likely due for a 4h consolidation i'm looking for a 5m or 15m oversold bounce play Monday/Tuesday and ride continue to ride the bull move up until price action tells me otherwise.
- took some profit off my TQQQ position at 23.38, still holding some shares will likely add them back on a consolidation for another move up.

SPY UPTRENDOptions traders. were in a 3rd hit trendline. Resistance will be 404$
Trade base on your own decissions.


SPY LONG OPTIONSTrade base on your own decissions
Look up my bio for best setups on Options.
NOt financial Advice, be a swing trader

Spy could ripSup baby,
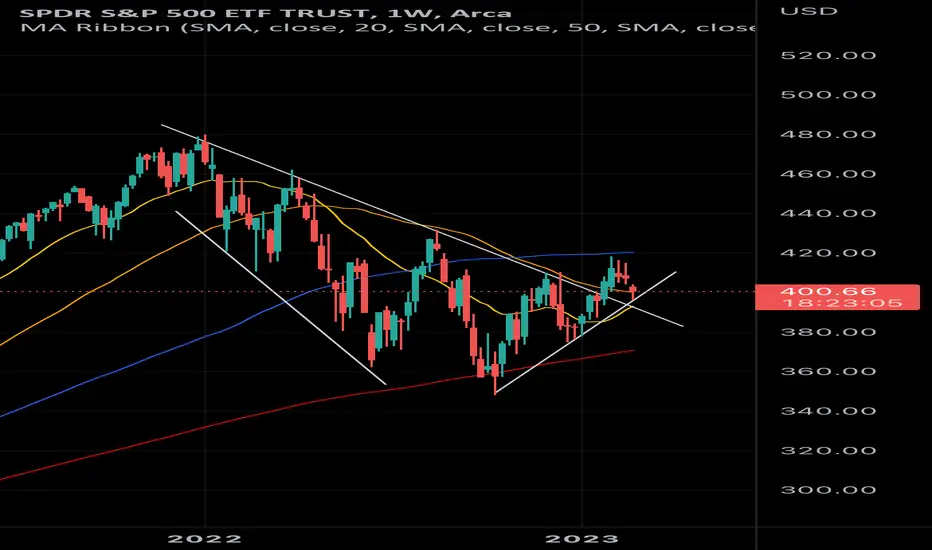
This story will be told using the weekly time frame, colourful pasta, made up lines, and a positive outlook.
If we look back some time, using the 20(yellow), 50(Orange), 100(Blue), and 200(Red) squiggles. You’ll notice we haven’t crossed the Orange, or the Blue without recovering and taking off afterwards. In fact we haven’t since 2008.
If this fails, we also know the Red pasta is bouncy! If the Red pasta fails you, just keep buying calls and eat ramen. You’ll be just fine.
Interestingly enough, the market sentiment online is rather bearish. It has been for a few months now. The rate hikes are doing a good job screwing people, how much it’s helped inflation though.. couldn’t tell ya. Point being, it’s the first time this many investors are present online and taking in all the recession crap 24/7. I honestly think there’s enough bullshit out there to cover up a good market rip.
This is pulling back to retest an old downtrend that held the market back (4 times) during this “mild recession”. AND it’s hitting a tested diagonal trend line that’s kept the recent rallies in check. The Yellow pasta could breakout , this could be nice.
Hope you enjoyed reading this! If not, buy puts what do I care.
Not investment advice
Cheers
SPY rebound short term? Looks like a dead cat bounce for SPY , golden cross, solid support until 420's

Spy Supply/Demand Zones with Support/Resistance.AMEX:SPY
Here shown are the current S/D and S/R levels on Spy. There is also an imbalance area in the middle of the chart that can be used as a support/resistance zone however, this seems to be more of a resistance level given the candles and wicks and how they set up right below this level. The candles are seemingly setting up for an aggressive leg up as that is the only way they can break this resistance and make it become a support again. Hope this chart helps you traders and remember me when you get your first AP. Remember the AP doesn't lie...

SPY WATCHLIST FEBRUARY 13TH- 17THCPI data, jobless claims, housing starts! The Economic Calendar has a full week ahead and I believe this will be one of the deciding factors into what the market will do in this pullback.
Broke an important supply zone around 408/409 and pulled back Thursday and closed on it on Friday.
This week my eye is on data and if we break above 408.85 to take profit at 410, 411.56, 415. And if we break below 404 to take profit at 402.15, 500, 398.50!

$SPY Inverse Head & Shoulders$SPY and other stocks currently have a possible Inverse Head & Shoulders pattern that is playing out right now. I expect to see $450 - $480 by May. We need to break $420 neckline and hold for a weekly close to confirm this.

$SPY leaning toward a bigger runTomorrow going to be a good day, if we rise up im looking for $430 as next target 🎯
