SPY 0DTE Bearish Setup – Max Pain in Play (Aug 7)## ⚠️ SPY 0DTE Bearish Setup – Max Pain in Play (Aug 7)
**Low-Conviction Market = Short-Term Put Opportunity?**
### 🧠 Summary of Consensus:
All major models (Grok, Gemini, Claude, Llama, DeepSeek) flag the **lack of bullish momentum**.
💡 **Key Bearish Signals**:
* 📉 Price below VWAP
* 📊 Weak volume
* 📉 RSI & flow: neutral to bearish
* 🎯 Max pain hovering near current price
---
### 🤖 AI Model Breakdown:
| Model | Bias | Action |
| -------------- | ------------------- | ---------------------------- |
| Grok / Gemini | 🔻 Weak Bearish | No trade (wait for clarity) |
| Claude / Llama | 🔻 Moderate Bearish | Buy PUT at \$630 |
| DeepSeek | ⚖️ Mixed Bearish | Monitor – no high-conviction |
🧭 **Consensus Direction**: **Weak Bearish**
---
### 🔧 Trade Setup (0DTE)
| Metric | Value |
| ---------------- | ------------- |
| 🎯 Instrument | SPY |
| 🔀 Direction | PUT (SHORT) |
| 💵 Entry Price | 0.78 |
| 💣 Strike Price | 630.00 |
| 🛑 Stop Loss | 0.39 |
| 🎯 Profit Target | 1.56 |
| 📅 Expiry | Aug 07 (0DTE) |
| ⏰ Entry Timing | Market Open |
| 📈 Confidence | 60% |
📊 **Risk/Reward**: 1:2
📉 **Time Decay Alert**: Tight stop-loss due to fast 0DTE decay.
---
### ⚠️ Key Watchouts:
* 📈 Reclaiming VWAP = **exit immediately**
* 🔊 Sudden volume spike = momentum shift risk
* 🧯 Keep position size small – this is a **scalp**, not a swing
---
### 🧠 Final Take:
> If SPY stays pinned below VWAP & max pain remains, this **0DTE put could print**. But discipline is everything — tight stop, tight leash. ⚔️
---
🧠 **Follow for daily AI-backed earnings & SPY plays**
📉 **Not financial advice – manage risk like a pro**
Spyshort

LMACD of the US02Y has just dipped bellow 0!In the past while rates have been elevated for a period of time things have gone bad for risk markets once the LMACD dipped bellow 0. Could be this time different?
$SPY rolling over, potentially to new lows?While I was early to the idea (like usual), still don't think the thesis will be wrong. I still believe we're going to see a large move down from here.
Yesterday's price action made me pretty confident a top was in (TBD). We had positive news and the market couldn't rally on that positive news and we ended up closing at the lows -- indicating to me there's no more buyers.
Today we have treasuries, the dollar and volatility all rallying while equities selloff, a classic risk off signal. You also have crypto selling off too.
I think we see a large risk off move from here on out, the target is the $440 area (extreme down to $400), but if we find support at one of the other levels above that, there's potential for us to rally from there.
Will have to see how price action plays out over the coming weeks.
SPX 0DTE TRADE IDEA – JULY 25, 2025
⚠️ SPX 0DTE TRADE IDEA – JULY 25, 2025 ⚠️
🔻 Bearish Bias with Weak Volume – Max Pain Looming at 6325
⸻
📊 Quick Market Snapshot:
• 💥 Price below VWAP
• 🧊 Weak Volume
• 📉 Max Pain @ 6325 = downside pressure
• ⚖️ Mixed Options Flow = no clear bullish conviction
⸻
🤖 Model Breakdown:
• Grok/xAI: ❌ No trade – weak momentum
• Claude/Anthropic: ✅ Bearish lean, favors PUTS near highs
• Gemini: 🟡 Slightly bullish bias, BUT agrees on caution
• Llama: ⚪ Neutral → No action
• DeepSeek: ❌ Bearish → No trade
⸻
📌 TRADE IDEA:
🎯 SPX 6365 PUT (0DTE)
💵 Entry Price: $0.90
🎯 Profit Target: $1.80 (💥 2x return)
🛑 Stop Loss: $0.45
📆 Expires: Today
🕒 Exit by: 3:45 PM
📈 Confidence: 65%
⏰ Entry Timing: OPEN
⸻
⚠️ Risk Flags:
• Low volume = fragile conviction
• Possible reversal if SPX breaks above session highs
• Max pain magnet at 6325 could limit gains or induce a bounce
⸻
🧠 Strategy:
Scalp it quick. Get in early. Exit before the gamma games explode into close.
📈 Like this setup? Drop a 🔽 if you’re playing puts today!
#SPX #0DTE #PutOptions #OptionsTrading #MaxPain #SPY #MarketGamma #TradingSetup

SPY Options Analysis Summary (2025-07-22)
🔻 AMEX:SPY Weak Bearish Put Setup (0DTE) – 07/22/25
All models agree: price is weak, momentum is limp, and VWAP is above.
But conviction? Not unanimous. High-risk, high-reward 0DTE scalpers only.
⸻
📉 Trade Setup
• 🟥 Direction: PUT
• 🎯 Strike: $626.00
• 💵 Entry: $0.57
• 💰 Target: $1.70 (+200%)
• 🛑 Stop: $0.28 (–50%)
• 📅 Expiry: Today (0DTE)
• ⚖️ Confidence: 65%
• ⏰ Entry Timing: Market Open
⸻
🧠 Multi-AI Consensus
Model Bias Action
Grok/xAI Weak Bearish ⚠️ No Trade
Claude Weak Bearish ⚠️ No Trade
Gemini Bearish ✅ $627 Put
Llama Moderately Bearish ⚠️ Conservative Put
DeepSeek Bearish ✅ $626 Put
🔹 VWAP < Price = Bearish bias
🔹 RSI = Neutral → watch for fakeouts
🔹 VIX favorable (<22)
🔹 Volume = weak = risk of whipsaw
⸻
⚠️ Risk Notes
• Bounce risk off session lows is real
• Lack of momentum may cause theta burn
• Best for scalpers who react fast — not a swing trade
• No conviction = smaller size, tighter leash
⸻
📢 Tagline (for virality):
“ AMEX:SPY is limping, not bleeding. But if it breaks, 200% comes fast. 0DTE scalpers: this is your window.” 💣

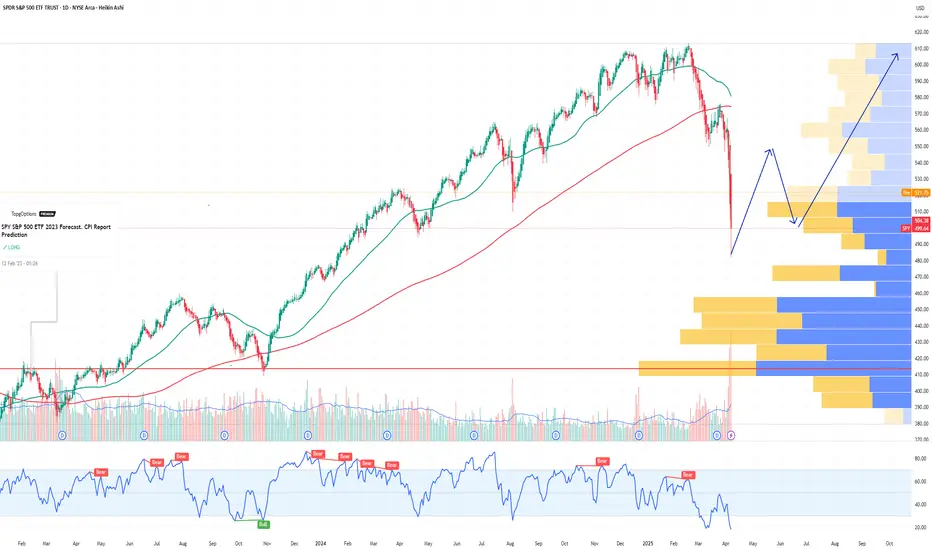
SPY S&P 500 ETF Potential W-Shaped Recovery Forming We may be witnessing the formation of a W-shaped recovery on the SPY (S&P 500 ETF) – a classic double-bottom structure that often signals a strong reversal after a period of correction or volatility. Let’s dive into the technicals and what this could mean in the sessions ahead.
🔍 The Technical Setup:
SPY recently tested key support around the $485-$500 zone, bouncing off that area twice in the past few weeks. This gives us the left leg of the W and the first bottom. After a modest relief rally to ~$520, we saw another pullback – but this second dip failed to break below the first bottom, a hallmark of the W-pattern.
As of today, SPY is starting to reclaim ground toward the $517-$520 resistance zone. If bulls can push through this neckline area, especially with volume confirmation, we could see a breakout that targets the $530-$535 area in the short term.
🔑 Key Levels to Watch:
Support: $490-$500 (double-bottom support zone)
Neckline/Resistance: $530
Breakout Target: $550 (previous highs)
Invalidation: A break below $490 with volume could invalidate the W-recovery idea and shift bias bearish.
📊 Momentum & Volume:
RSI is climbing back above the 50 level – bullish momentum building.
MACD shows a potential crossover forming, hinting at a shift in trend.
Watch for increasing buy volume as SPY approaches the neckline – that’s where the bulls will need to step up.
🧠 Macro & Earnings Angle:
Don’t forget – we’re entering a heavy earnings season and rate cut expectations are still a wildcard. A dovish tone from the Fed and strong corporate results could be the fuel that sends SPY higher to complete this W-shaped recovery.
🧭 Final Thoughts:
This is a high-probability setup if neckline resistance is broken cleanly. Wait for confirmation before going heavy – fakeouts are common in double-bottom scenarios. If we do get the breakout, we may be looking at a broader market rebound going into summer.
🔔 Set alerts near $525. A confirmed breakout could mean the bulls are back in charge.
$SPY bearish, to break April lows?Most people are thinking that we'll see a correction that goes back to the $560 area and then from there, we'll go to new highs. They also don't think it's likely that we'll retest the lows from April and think it's nearly impossible that we'll break the lows.
However, my base case is that we will break the lows. Yes, in the past, most dips like the one in April were good buying opportunities, but the chart looks different here.
You can see that ever since April, all we've done is consolidate up into a rising wedge.
We look set to break down from that in the coming days. If we do break down and are unable to reclaim the highs, then I think my base case will become the highest probability outcome.
I think it's likely that the move down will take us to the $424- 402 levels. Let's see what happens.

SHORT ON SPY (SPX/USD)Spy has given us bearish divergence at a major supply zone.
I will be selling spy to the next support level.
Today is FOMC and I expecting it to influence spy move to the downside.

Flying into the sun or about to get burnt?Market is about to reach all-time highs again. Many trade deals must have been made. Interest rates must have been cut. Wars must have been resolved. Personal debt must have come under control. Corporate debt must have been resolved.
Wait, nothing has changed? Things are worse? Well why is the index about to hit new all-time highs? My take is a major fake out. We are about to set a double top as we complete a rising wedge pattern.
The rising wedge.
What began at the market bottom on 7 April, has remained bound in a channel. If the first pump up was an A followed by the declaration of the channel bottom as B, wave C has last over a month upward. We have wave 3 signals identifying wave 3 of C ending with the high on 19 May. Last week's dip was wave 4 and now we fly high this week. It is unclear if we actually make a new all-time high or fall just short. The below chart has 138.197% extension around 610.63. Inside wave C, my wave 1 was nine days long, and wave 3 was only 8. This points to wave 5 lasting less than 8 days. A common wave 1-3-5 duration in relation to wave 3 is around 114% for 1 and 50% for wave 5.
The height of the rising wedge covers 66.82 points. This same distance should provide the first target bottom once we exit the channel, possibly as early as next week. Once the bottom falls, we then examine the double top pattern. Although the neckline stretches far backwards, the bottom is established at the 7 April low. The distance from the neckline to the all-time high in February provides the next possible minimum target bottom by taking this 131.43 drop and subtracting it from the neckline of 481.80. This puts the initial low around 350.37 sometime later this year or early next.
There is a perfect storm of calamity brewing with zero resolutions in place or even planned. Do we finally drop or keep rising into the sun?

SPY Weekly Options Trade Plan 2025-05-25SPY Weekly Analysis Summary (2025-05-25)
Model Summaries
Grok/xAI Report
Technicals: SPY at $579.11, below short-term EMAs (10/50 on 5-min), above 200-period EMA, RSI oversold on 5-min, MACD bearish. Daily chart neutral to slightly bearish. Sentiment: Rising VIX (22.29), max pain at $580. Trade: Buy 2025-05-30 577 put at $5.12, profit target ~3-point move, 20% stop loss, confidence 65%.
Claude/Anthropic Report
Technicals: 5-min and daily charts bearish but RSI oversold intraday. Volume selling peaked. Sentiment: Max pain $580, heavy OI at 575/570 puts, futures up. Trade: Buy 2025-05-30 581 calls at ~$4.91, profit targets 25–50%, 30% stop loss, confidence 65%.
Llama/Meta Report
Technicals: Moderately bearish on 5-min EMAs and MACD, daily neutral. Sentiment: Elevated VIX, max pain at $580. Trade: Buy 2025-05-30 579 put at $5.95, 20% profit target, 10% stop loss, confidence 70%.
DeepSeek Report
Technicals: Mixed signals—5-min oversold vs. daily bearish. Sentiment: Stuck between support $576.86 and max pain $580. Trade: No recommendation (confidence 45%).
Gemini/Google Report
Technicals: Daily and 5-min bearish, price under key EMAs. Futures suggest gap up to $581–581.50. Sentiment: Rising VIX, max pain at $580. Trade: Fade the open—buy 2025-05-30 578 puts at ~$2.20, target $3.00, stop ~$1.60, confidence 65%. Agreement and Disagreement
Agreement
Short-term bearish bias: Most see SPY below intraday EMAs and bearish MACD. Elevated volatility: All cite VIX rising above 20 as a risk factor and opportunity. Max pain magnet: Models note $580 as a gravitational level.
Disagreement
Directional tilt: Claude is moderately bullish (buy calls), others lean bearish or neutral. Trade entry strike: Puts at 577, 578, 579 vs. calls at 581. Risk parameters: Profit targets and stop losses vary widely (10–50% of premium). Conclusion and Recommendation
Overall Market Direction Consensus: Moderately Bearish. SPY is below key short-term EMAs, MACD on multiple timeframes is negative, and although oversold conditions could spark a bounce, the preponderance of models favors downside.
Recommended Trade
Strategy: Buy a single-leg naked put Instrument: SPY weekly put expiring 2025-05-30 Strike: 577.00 (ask $5.12) Premium: $5.12 Entry Timing: At market open, assuming SPY does not gap significantly below $579 or above $581. Profit Target: 40% gain (premium ~$7.17) Stop Loss: 25% premium loss (premium ~$3.84) Size: 1 contract Confidence Level: 65%
Key Risks and Considerations
SPY could bounce strongly from oversold levels or pre-market futures strength, invalidating the bearish setup. Theta decay accelerates late in the week; monitor time decay. VIX spikes could amplify premium and widen bid-ask spreads.
TRADE_DETAILS (JSON Format)
{ "instrument": "SPY", "direction": "put", "strike": 577.0, "expiry": "2025-05-30", "confidence": 0.65, "profit_target": 7.17, "stop_loss": 3.84, "size": 1, "entry_price": 5.12, "entry_timing": "open", "signal_publish_time": "2025-05-25 21:27:17 UTC-04:00" } 📊 TRADE DETAILS 📊 🎯 Instrument: SPY 🔀 Direction: PUT (SHORT) 🎯 Strike: 577.00 💵 Entry Price: 5.12 🎯 Profit Target: 7.17 🛑 Stop Loss: 3.84 📅 Expiry: 2025-05-30 📏 Size: 1 📈 Confidence: 65% ⏰ Entry Timing: open 🕒 Signal Time: 2025-05-25 21:27:49 EDT
Disclaimer: This newsletter is not trading or investment advice but for general informational purposes only. This newsletter represents my personal opinions based on proprietary research which I am sharing publicly as my personal blog. Futures, stocks, and options trading of any kind involves a lot of risk. No guarantee of any profit whatsoever is made. In fact, you may lose everything you have. So be very careful. I guarantee no profit whatsoever, You assume the entire cost and risk of any trading or investing activities you choose to undertake. You are solely responsible for making your own investment decisions. Owners/authors of this newsletter, its representatives, its principals, its moderators, and its members, are NOT registered as securities broker-dealers or investment advisors either with the U.S. Securities and Exchange Commission, CFTC, or with any other securities/regulatory authority. Consult with a registered investment advisor, broker-dealer, and/or financial advisor. By reading and using this newsletter or any of my publications, you are agreeing to these terms. Any screenshots used here are courtesy of TradingView. I am just an end user with no affiliations with them. Information and quotes shared in this blog can be 100% wrong. Markets are risky and can go to 0 at any time. Furthermore, you will not share or copy any content in this blog as it is the authors' IP. By reading this blog, you accept these terms of conditions and acknowledge I am sharing this blog as my personal trading journal, nothing more.

Rising wedge on SPY - Melt up? or Next leg down? Immediate Bias (Tomorrow):
Scenario 1 – Bullish Continuation (Low Probability unless there's a macro catalyst):
Breaks above ~$596–$598 cleanly
Retests that zone as support (watch 595.50 intraday)
Then targets:
600 psychological
604–608 upper resistance channel
Possible end-of-month blow-off top: 612–618
Scenario 2 – Pullback / Rejection (More Probable Setup):
Rejected at ~596–597 zone (which aligns with upper wedge resistance)
Breakdown below $590 intraday
Then targets:
587.80 EMA cluster (20/50)
If lost → 576.44 next EMA + demand level
Followed by major support at 565.87 / 563.43
🔥 Week Ahead Trade Plan (May 20–24)
✅ Bullish Possibility:
If NVDA earnings, FOMC minutes, or macro data surprise to the upside
Watch for breakout above the red wedge and hold above 600
Target range: 604 → 612 max upside
🚨 Bearish Scenario:
Wedge breakdown below ~$590
Momentum cracks down to:
587
576 (watch for bounce)
If panic selling → 565–563 (larger time frame buying zone)
Volume divergence and overbought EMAs support a potential cool-off.
📅 Monthly Projection (End of May):
If wedge breaks down → consolidation range between 563 – 587
If wedge breaks out → blow-off rally up to 612–620, but likely to fade quickly
Fed commentary and NVDA earnings on May 22 will be major catalysts
📌 Key Levels
Type Price Notes
Resistance (R3) 612–618 Final upside blow-off zone (channel top)
Resistance (R2) 604 Overhead channel line
Resistance (R1) 595–598 Wedge top + major resistance
Support (S1) 587 EMA cluster + strong local demand
Support (S2) 576 Clean structure + prior breakout
Support (S3) 565–563 Confluence of long-term EMAs + trendline
🎯 Trade Setups
📉 Bearish (Favored if no breakout tomorrow):
Short 595–597 with stop above 600
Targets: 587 → 576
Optional: Add below wedge break (~590)
📈 Bullish (Confirmation-based):
Break + retest of 597–600
Target: 604, then scale out at 612
Avoid front-running long unless you see volume + price close outside wedge

SPY Broke The Sine-Wave Center - Not GoodWe see the 3 tiny arrows—proof that price was rejected by those who knew.
The Trend Barrier, once solid support, cracked without resistance. Price dropped right back into the Medianline set.
The small pullback? Totally expected—just like the Medianline rules suggest. Then came the brutal drop, textbook-style, straight to the Centerline.
The springboard move back up to the U-MLH and the Trend Barrier? No surprise—if you understand the Medianline Framework. Because this is just P2.
Also—watch the white line. That’s what I call the Sine Wave. Why does it matter? Because the center point (where the red pullback arrow is) often gets breached in a fake move... right before price reverses hard. From P2: down, down, down... lower than P1.
AND THAT SHOULD SCARE THE HELL OUT OF YOU!
…if I’m right 😈
But if it fails?
Then we’re looking at a monstrous V-shape recovery—one that could send the indexes skyrocketing.
So there you have it.
What’s your direction?
Let me know—and tell me why! §8-)

Elliott Wave top on SPY’s monthly chartTechnical Analysis:
Wave Structure (Elliott Wave)
• Wave 1–2: Early 2020 correction (COVID crash) marked a clear wave 2 bottom.
• Wave 3: Strong impulsive rally from mid-2020 to late 2021 — massive liquidity-driven.
• Wave 4: 2022–2023 pullback — clean retracement to ~0.382 Fib, validating wave structure.
• Wave 5: Parabolic final rally peaking around $550–560 (currently topping or topping out).
Bearish Signals:
• Volume divergence — Price up, but monthly volume flat-to-declining. Distribution behavior.
• Completed 5-wave structure — Indicates exhaustion.
• (A)-(B)-(C) Correction Starting: The projection shows:
• Wave A targeting ~$420–440.
• Wave B dead cat bounce.
• Wave C projecting a deeper correction into $300–340 zone (around 0.5 to 0.618 retracement).
Fibonacci Confluence Zones:
• 0.382 = ~$450
• 0.5 = ~$390
• 0.618 = ~$340
These zones will act as major liquidity pools for institutional entries or macro rebalancing.
Macro Headwinds Fuel the Narrative:
• Sticky inflation
• Rising interest payments on U.S. debt
• Deteriorating liquidity (QT regime)
• Over-leveraged consumer and commercial debt sectors

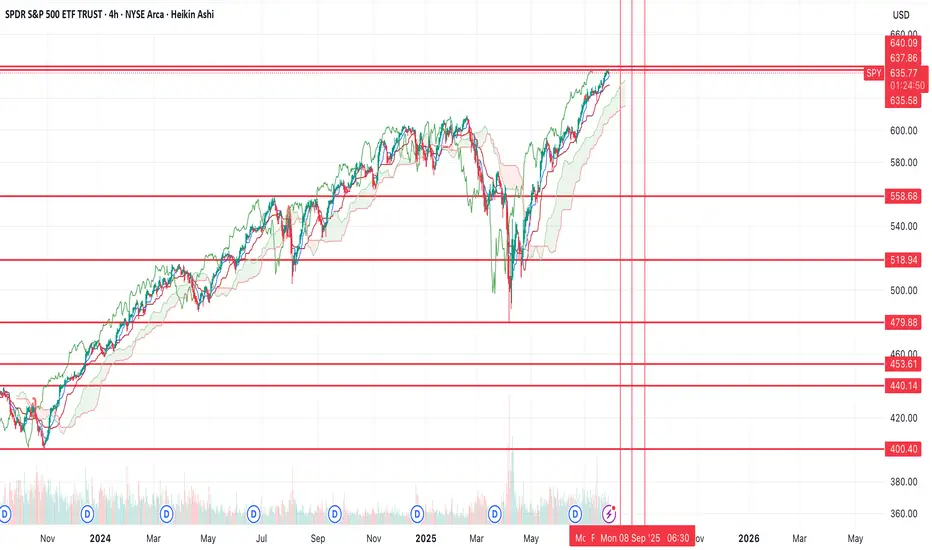
$SPY bear flag target between $387-443AMEX:SPY has been consolidating in a bear flag since April 7th. Should we break down from the flag, I can see a sharp move down to the lower support levels.
I think the most likely targets are at $443 and $409. However, it's possible we can find support at the other targets as well.
I think the move likely plays out before June. Let's see where we end up bouncing.
Invalidation of the downside would be a break over $567.

QQQ SHORT @ $448 TO $433Price also happens to be at the 60% fib level which is added confluence. Will most likely cut this trade around $435 just to secure profit and so I don't have to hold as long. If it decides to crash then of course ill hold. stop loss no higher than $450.7

Who Benefits from the Dunce Tariff Tsar? The Art of The Short: When SPY Bleeds, Dracula Drinks
Today we’re diving deep into the MAX S&P 500 4X Leveraged ETN (SPYU), the ultimate degenerate’s playground for snorting the market when SPY takes a nosedive.
Tonight, my fellow nightwalkers, I wipe my mouth after my fangs bite into MAX S&P 500 4X Leveraged ETN (SPYU) the juiciest vein in the market’s pale white supremisist neck, ripe for snorting when SPY collapses under the weight of its own mortal greed. I’m Dracula, your undead degen, and I’ve been snorting the lifeblood of Wall Street since the days of ticker tape and blood-soaked ledgers. Let’s feast.
Picture this: it’s 2025, Trump’s slapping tariffs on everything from iPhones to tacos, and the S&P 500’s staggering like a peasant drained dry. SPY’s down 5% in a day, a crimson river flowing for weeks. With SPYU’s 4x leverage, that ETN’s plummeting 20% faster than you can hiss “inverse gang rise up.” You bulls might clutch your pearls, or buy the dip but baby, you just giving me that drip, drip, drip.
Here’s the blood ritual: I summon my broker under the moonlight, borrow SPYU shares, sell ‘em at their bloated peak, and slink back to my coffin until the orange man dumps on the market. When SPYU’s rallies, I buy ‘em back, pocketing the difference—20% gains, minus the broker’s measly tithe and some bat-winged fees. The leverage is my coffin nail, amplifying SPY’s death throes into a banquet of tendies. But volatility decay’ll stake you faster than a hedgie fleeing a short squeeze. Snort quick, my pretties.
Disclaimer: This is unholy entertainment, not mortal advice. Snorting’s riskier than a sunrise stroll, and you could lose your crypt. Do your own necromancy, don’t YOLO your blood money, and maybe consult a living advisor instead of a WSB vampire. Markets are feral, tariffs are feraler, and SPYU’s the feralest. Feast wise, or crumble to dust.
What in the Nosferatu Is SPYU, and Why’s It My Prey?
Listen up, you sun-kissed ghouls. SPYU ain’t some mortal ETF and it’s an exchange-traded note, a dark pact scrawled by the Bank of Montreal (BMO), swearing to bleed 4x the daily pulse of the S&P 500 Total Return Index. Four times the thrill, you hear me? If SPY, that sanctimonious index hog, rises 1%, SPYU surges 4%, a moonlit frenzy. But when SPY stumbles 1%, SPYU’s gutted by 4%, and that’s when I, Dracula, snort its essence like fresh blood from a virgin’s neck. It’s my chalice of chaos.
Why care? Because the market’s a bloated corpse waiting to be drained, and Trump’s tariffs are the silver dagger. When SPY bleeds, SPYU’s leverage makes it a four-course meal for us snortin’ fiends. The mortals weep; I feast.
Bank of Montreal: The Crypt-Keepers Who Sip Regardless
SPYU’s birthed by Bank of Montreal—pale Canucks who guzzle maple syrup and hedge under torchlight. As an ETN, it’s no stock hoard, it’s a blood oath, with BMO bound to pay 4x the S&P’s dance. When SPY falls and SPYU’s carcass sinks, BMO’s debt shrivels, like a thrall freed from my thrall. Are they cackling over goblets? Not quite.
These coffin-dwellers don’t wager their vault on market whims. They weave dark hedges swaps, futures, maybe cursed options traded in shadow pools. When SPY bleeds, their short futures might fatten their coffers, balancing the SPYU tab. But the true leeching? A 2.95% expense ratio, sucked from your veins whether SPY soars or sinks. It’s their eternal tithe for the win, lose, or draw, they’re sipping.
And the twist of the fang? BMO might pawn some risk to swap thralls, other banks, hedge funds, or their own brood. When SPY tanks, those on the hedge’s far side might choke on losses, but their names are buried deeper than my Transylvanian crypt. Prospectuses are murkier than a fog-draped moor, and BMO ain’t etching their secrets in blood. My bet? They keep it in-clan or with beasts who can bear the bite. The real feast is mine (snorting SPYU) and theirs (skimming fees).
Trump’s Tariffs: The Rocket Fuel for SPYU Shorts
Let’s talk about the big dunce red elephant in the room: Trump’s tariffs. The man’s got a hard-on for trade wars, and 2025’s looking like a sequel to his 2018 tariffpalooza. The 25% tariffs on Mexico and Canada, 102% on China, and who knows what else. Why’s this a big deal? Tariffs jack up import costs, screw over supply chains, and make everything from cars to CPUs pricier. Companies like Apple, Walmart, and Tesla, big S&P 500 names get hit hard, and SPY feels the pain.
When SPY drops, SPYU’s 4x leverage turns a market dip into a bloodbath and that makes my fangs erect like a male pornstar on viagra. Say Trump slaps a more tariff on Chinese goods, and SPY falls another 15% as tech stocks puke. Do the math on how much SPYU goes down in a day. Scale that up with a big position, and you’re buying Lambos while the bulls are crying into their maga cool aid.
But tariffs don’t just hit stocks, they spook the whole market. Investors panic, volatility spikes, and leveraged products like SPYU get wild. That’s your cue to strike. The VIX (fear index) shoots up during tariff tantrums, and SPYU’s daily resets mean bigger swings. If you’re nimble, you can ride those red days for fat gains. Just don’t get greedy—tariff news is noisy, and markets can bounce on a single Trump tweet (or whatever he’s posting on Truth Social these days).
See that little, indicator I cant publish?
Oh, and my little bat-trick? The Sector Value Index (SVI)—my ancient grimoire. It tracks RSI and MFI across SPY’s veins, averages the pulse, and measures the gap to the index. Overbought or oversold, it whispers when the market’s ripe for snorting. When SVI screams “sell,” I pounce.

$SPY the final leg down? Bottom between $400 - $441It's looking like we're going to break the low I originally had at $481 from the top at $612.
The next most likely target is $441, and if we break that $414.
Both of those levels are good long term buys, the move should happen this week (and likely tomorrow) and that should mark the bottom for the market.

Island Bottom CONFIRMED on $SPY IF we GAP up tomorrow!Island Bottom CONFIRMED on AMEX:SPY SP:SPX IF we GAP up tomorrow!
I only believe we can GAP up tomorrow if there is news of China coming to the negotiation table with the U.S. after they raise the Reciprocal Tariffs to 104%.
If this doesn't happen, then this isn't confirmed, and we see a retest of $482, IMO!
I'm not playing this as a trade until we get confirmation! Too dangerous!
Not financial advice

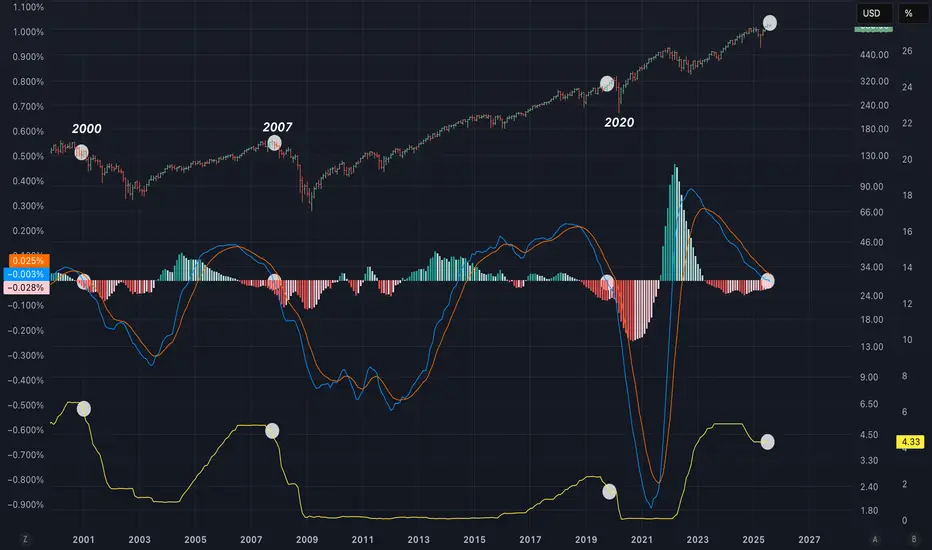
The weekly US02Y downtrend has started. As I have been expecting months ago, now the downtrend is been printed on the guppy emas. The trend is changing to red like in the past. This indicates that maybe a big correction might follow the SP500 in the coming months.

SPY: Breaking Levels; TASPY broke down the Weekly demand line and now looking to break the Monthly demand.
Looking to possibly test the bottome weekly trendline.
Possibly a 530 price target and if weakness continues, possibly below more to 520 then 510.46 to fully retest that bottom trendline.
The market has bene crazy, people calling bottom, wanting to catch the reversal. I mean, I would want to catch this “V” up too, but have to see if it keeps trending down to the bottom trendline.
LMK what you think and if you have any TA, tag me!
*Not FA

SPY: SPY looking a bit like scary hour? Continuous tariff new’s scaring the market. Many continue to say Bearish then some say Bullish.
Looking like it can retest the demand zone I see at the 1M at 584.83 but today 3/30 on AH looks like things may be gapping down already.
What are your thoughts?

Bear Flag Broken on the $SPYBear Flag Broken on the AMEX:SPY ‼️🙀
- Rejection off the 200DMA
- 25DMA Bearish Cross of the 200DMA
Look Left 🎯 is $549.68
⛳️Measured Move 📏 is $538.73
Not financial advice

End of hibernation for the bears?AMEX:SPY is at a pivotal point and could potentially be at the top of the bullish cycle that began in October 2022. If this prediction proves accurate, I think we could see a maximum low of $510 for this year. There are a couple of caveats, including one that will be a clear indicator of whether or not this wave count is accurate, which I will explain later.
On the 1000R chart ($10), this uptrend was confirmed by Supertrend and volume activity. Volume drastically increased at the start of Wave (3) in March 2023 and did not taper off until the start of Wave (4) in July 2024. This was the strongest impulse in the trend, which is common for Wave 3. You can also see the ADX line of the DMI indicator (white line) was at its highest level during that period.
Assuming Wave (5) is already complete, we can observe that the volume in Wave (3) was considerably less than Wave (5).
Other observations supporting this wave count:
- Wave (4) retracing into the territory of Wave 4 of (3)
- Alternation in corrective patterns between Wave (2) and Wave (4); flat in (2) and straight down in (4)
- Wave (5) extending to nearly 1.618 of (1)
While the points I’ve made so far suggest that the market may be on the verge of a crash, the image gets more complicated when you take a closer look on the 250R chart ($2.50). I’ll start with what I’m counting as Wave 4 of (5). The price ended at ATH in Wave 3 and then corrected in an unmistakable five wave descending wedge pattern. This can only be a fourth wave of a larger impulse, so we can conclude with a fair amount of confidence that the wave that follows will be the last.
Here is where things get interesting. The price moved from $575 on January 13th to a slightly higher ATH of $609.24 on January 24th before being rejected again. This uptrend unfolded in a typical bullish pattern and left a notable gap at $584, which is the only gap still left unfilled. The trend change is confirmed on the moving averages. Notice the serious drop in volume that followed as well.
Despite the shift in volume, there are two issues I have with this wave count that are preventing me from calling this a confirmed correction:
1. Wave 5 of (5) was awfully short and only extended roughly $2 above the end of Wave 3 of (5). This does not break any rules, but it is unusual.
2. What I have labelled as Wave B of Wave (1) or (A) of the correction made a new ATH on Friday February 14th, which should invalidate this wave count since the end of Wave 5 of (5) should be the peak.
The second point is why some may think that we are about to resume the larger bull trend, however there is a possibility that they are mistaken based off the PA on the actual index SP:SPX and futures CME_MINI:ES1! . On the SP:SPX chart, we can see that the index did not break the ATH at $6128.18 set on January 25th, and instead rejected at $6,127.24.
CME_MINI:ES1! also failed to notch a new ATH on Friday and I have observed the price action create a nearly perfect bearish butterfly pattern. Also notice how the volume is significantly lower than in the uptrend that began on January 31st.
So the question remains: are we at a tipping point or will the bulls regain control? Right now it’s unclear, but I will keep my bearish sentiment until SP:SPX makes a new ATH, which will invalidate this theory. Since only the ETF that tracks it only made a slightly higher high on low volume, I’m skeptical of the PA on AMEX:SPY at the moment. This is why I entered puts on Friday.
If the trade plays out, I expect the price to quickly move to fill the gap at $584, which is still conveniently located at what I cam considering the 1.236 extension of Wave A, which is a common target extension in flat corrections. I will keep my puts open until this idea is invalidated, as the Wave C drop will likely be caused by a news event that could come at any time. Let me know if you guys are seeing the same thing or something different. Good luck to all!
