$ES $SPY $SPX - ABCDE Wedge possibilitI've highlighted these wedges previously via our Twitter.
Currently, the ES is Extending the E leg,
Which typically extends 1.2-1.4-1.618% of C-0
I'd look for a violent reversal back to the upside at 4236 or 4178.
Further selling would invalidate the formation
Spyshort

$SPX $SPY got SLAPPED by the 200 MA $SPX got SLAPPED by the 200 MA
That's it. That's the post...
---------
I am not your financial advisor. Watch my setups first before you jump in… My trade set ups work very well and they are for my personal reference and if you decide to trade them you do so at your own risk. I will gladly answer questions to the best of my knowledge but ultimately the risk is on you. I will update targets as needed.
GL and happy trading.
IF you need anything analyzed Technically just comment with the Ticker and I’ll do it as soon as possible…

Spy heading to 465.. . then 470...As I have been stating for a while, it it not a BEAR market.
I expect Monday to be a Green day and a GREEN week.
I will not be surprised if it gaps up on Monday.
There is a resistance at 445 range but it will break through.
We will see 470 before we see 420s..but first we will touch 465 first.. One step at a time..
The stock market moves are not logical. If it was, it won't be at this price right now.
So the employment reports, inflation, UKraine crisis, Covid, etc.. is all irrelevant. Only thing it matters is PRICE action.
________________________________________________________________
Are you being led by Jesus or you? Bible says only if you are led by Jesus, you are a Christian. If you are not, I recommend you get baptized with the holy spirit. Holy spirit is Jesus.
Romans 8 14 New International Version
For those who are led by the Spirit of Jesus are the children of God.

Spx500 Short SignalPrice is showing signs of shifting down. Took this short looking to gain 3R risking 10 points targeting 30. I expect price to take out yesterday’s low atleast but we shall see.
I am not a financial advisor so trade at your own risk and always follow your risk management plan!

Heading toward 470.The chart shows it is still bullish if you look at it from larger time frame.
The resistance area has been drawn to indicate where it might fall before it needs to shoot up.
It has been numbered to show the path where the Target price might hit.
This is future prediction which can change.
If you are trading swing options, you should be buying options 4 to 6 months until expiration so your time decay does not get eaten up.
John 13 35 By this everyone will know that you are Christian, if you love one another.”

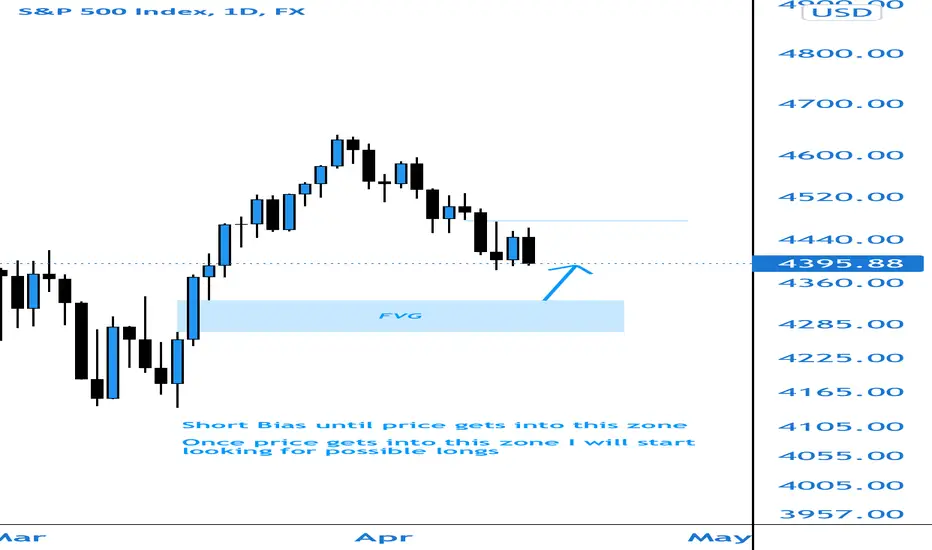
Spx500 Weekly OutlookShould start this week with 2 or 3 bearish days until we get into the FVG. From here we can look to take longs as a reaction from it being filled. Not sure if it will switch bullish but should get a good push up from there at the very least.
Goodluck this week and feel free to leave your opinion below!
S&P 500 , #SPYThe US market index is at a very dangerous postion ,
any break to 436.55 , the lowest on April 12
Potentially big price bracket ⚠️

SPY guesstimation prediction for 4/13/2022I think SPY will either trade nearly sideways or slight drop due to trend and resistance/supports
Like for a like! I am trying to build some rep points. Thank you~

Again.. heading toward 470s... What to expect next week:
Scenario 1: It will shoot up and test resistance 465 and overcome it and hit 470s
Scenario 2: It will drop to 438 - 439 and bounce off and resume bullish trend...and toward 470s..
What likely to happen: Scenario 1
What if Scenario 2 happens? I would go long at 438 -439 price range..
In general, the market goes against the mass sentiment. If the mass thinks it will go up, it will likely go down and vice versa.
Don't trust media. Don't trust the Fed. Don't even trust inflation numbers. Don't even trust the VIX.
Market is trying to make money. Anything they offer as important tool for you, it is to go against you.
_____________________________________________
Are you a real Christian of fake Christian? Here is what Jesus said to be a real true Christian.
A man’s enemies will be the members of his own household.’ 37Anyone who loves his father or mother more than Me is not worthy of Me; anyone who loves his son or daughter more than Me is not worthy of Me; 38and anyone who does not take up his cross and follow Me is not worthy of Me.
Do you love Jesus more than anyone in your life? If the answer is NO.. you are not a Christian..according to this bible verse. Make sure you pray to Jesus everyday and obey him. Learn to hear his voice and have him guide you everyday. This life is like a penny. You will die sooner or later. Life in heaven is forever.. is like a billion dollars. Invest in billion dollars rather than a penny.
Disclaimer: This is just my opinion. I am not a financial advisor. I live and die for my Lord and Savior Jesus Christ who died for my sins on the cross so I can have life. I was breathing and enjoying life but I was spiritually dead when I didn't know Jesus. Once I woke he was real, my life has forever changed. If you make money, make sure to share with the needy. Make sure you glorify Jesus in every aspect of your life by thanking him by your actions and conduct and not by just words.

SPY The Bears are Back in Action!!Happy Sunday!
Let's breakdown what happened this week with SPY and what I think will play out this week:
-We filled the gap
-Twice SPY retested the 200ema level @ $450.00 before moving back down
-Strength moved from bulls to bears once this happened
-On a 5minute chart the last 10minutes before the end of Fridays session we finally closed below the 200ema level signalling the bears are back!
Next week:
-Break of my support level @ $447.00
-We head down to test the low of the week @ $443.50
-Depending on the strength of bearish momentum I can see us heading to $440.00 which is another key level of support I have and we would be making a lower low
-If bulls come back and somehow buying pressure is refuelled and we break $450.00 then SPY can easily head to my next resistance level of $454.00. However note that on the hourly chart we're clearly in a downward channel making lower highs so a move to $454.00 would still be overall bearish
Have a great trading week everyone and please feel free to share your opinions in the comments :)

SPY - Waiting for PullbackLooking at SPY, the only thing holding it up is the 20DMA. Once it breaks through, I'm expecting massing panic.
Stochastic and MACD have already signaled a bullish trend. I'm just patiently waiting for the calls I sold to go worthless.
I don't think it will be long.

$UVXY entry PTs 11.50-12-13 Target PTs 20-23 and higherThe index seeks to offer exposure to market volatility through publicly traded futures markets and is designed to measure the implied volatility of the S&P 500 over 30 days in the future.

$SPY^ 2022 FOMC Meeting
January 25-26
March 15-16
May 3-4
June 14-15
July 26-27
Sept 20-21
Nov 1-2
Dec 13-14

Spy retracing before next leg higherbearish leading into tomorrow April 6th, short until the 442 area.

S&P500 Short SignalJust set my sell limit. Price has made a new swing low and will likely pullback into the 15m order block and make a lower swing high in comparison to the previous one. We then enter there and target a newer swing low. Goodluck and have proper risk management!

SPY Short TargetI believe we will drop to atleast $400 in the coming weeks/months. Be careful as volatility is at an extreme. Goodluck everyone!

4/3 - Is Going to be a GREEN WEEK ..Hitting toward 470s..Now it has stopped to refill the Gas tank, ... It is going to test ATH...
I was hoping for a pullback this week so I can cash out my CALL position last week but due to pullback last week, I will be cashing out my call position this week since my CALL expiration is coming up... .
If you are shorting, I recommend you cash out your PUT position on Monday ASAP... or you will lose more money as days go by..
The BOTTOM has already hit few weeks ago so you are not going back..
))))))))))))))))))))))))))))))))))))))))))))))))))))))
Hebrews 13:5 ESV
Keep your life free from love of money, and be content with what you have, for Jesus has said, “I will never leave you nor forsake you.”
Proverbs 19:17 ESV /
Whoever is generous to the poor lends to the Lord Jesus, and he will repay him for his good deed.

$SPY | MODEL POINTS TO LOWER LOWSHello Traders,
The targets on this chart are produced by a proprietary model. Data is fed into the model, the output is the targets you see on the chart. The resistance zone is also defined by the model. A break of the resistance zone nullifies this set up.

The market turned bearish 3/30/22My goal of this week was to have SPY hit 460 and SPX 4626 . Both goals have hit and was well on its way to 470/4700 when the market closed bullish a couple of days ago. The price needed to reach 465/4640 to confirm the continuation of this price movement.
However,
Bonds have become bullish and we aren’t going to reach our target of 4700 anytime soon. The beginning of further downside officially begins today.

Market turned bearish 3/30/22My goal of this week was to have SPY hit 460 and SPX 4626 . Both goals have hit and was well on its way to 470/4700 when the market closed bullish a couple of days ago. The price needed to reach 465/4640 to confirm the continuation of this price movement.
However,
Bonds have become bullish and we aren’t going to reach our target of 4700 anytime soon. The beginning of further downside officially begins today.

SPX vs M2 Money SupplyInflation adjusted, the stock market peaked in the year 2000 and a little over in 2022. With bonds yielding absolutely nothing worth while and any increase of .25 .50 basis points + will crash the markets, especially low end bonds. I argue the stock market inflation adjusted, offers such little upside while offering severe risk to the downside, especially over a multi year period. Trading on moving averages rather than buy and hold is probably the best bet to manage markets these coming years. Black Swans are more prevalent than ever too.
Weekly chart, trendline starts from 1982.

Target reached 3/29/22, bullish close = final bull move (470)At the beginning of the week, I called SPX hitting 4626 and SPY 460 by the end of the week but it seems it has reached to the price a lot faster than expected.
Moving forward, todays close is imperative to future movement as one more bull run might be imminent before the eventual correction. If SPX is to close around the 4620s, I could see it pushing one last time up to a total price of 4700+ specifically 4707. Once reached, there may be more of a reason to short the entire market even if temporarily to 4504.
As for SPY , 470 is possible given the price closes bullish today and follows SPX movement.
Thank you for reading.

Target reached 3/29/22, bullish close = final bull move (4700+)At the beginning of the week , I called SPX hitting 4626 and SPY 460 by the end of the week but it seems it has reached to the price a lot faster than expected.
Moving forward, todays close is imperative to future movement as one more bull run might be imminent before the eventual correction . If SPX is to close around the 4620s , I could see it pushing one last time up to a total price of 4700 + specifically 4707 . Once reached, there may be more of a reason to short the entire market even if temporarily to 4504 .
As for SPY, 470 is possible given the price closes bullish today.
Thank you for reading.
