Spyshort

Vix Bullish/Spy May Pullback?We see Vix dropping for a while now while spy is reversing up. As vix approaches its support/demand zone we could see vix pushing back higher, Also might bounce off 200 MA. For that to happen. I want to see vix bounce off of 200 ma and breaking 24.07. This might be a small pullback for vix and instead might reject.

SPY Continued Downside - Hidden DivergenceChart Even t: Bearish Divergences on multiple timeframes. Rising wedge pattern on 65m and lower timeframes.
Confluence : Bearish Divergence on 65m timeframe. Hidden Bearish Divergence on daily timeframe. Rising Wedge pattern (bearish) on 65m and lower timeframes. MACD very wide. Volume decreasing. Death Cross moving average event occurred a few days ago. Price action is nearing old resistance levels along with the 61.8% Fibonacci Retracement level. RSI overbought on 65m timeframe.
Trade Idea : Put Swings
Contract Suggestions (depending on Monday's open) :
Best: 4/8/22 450P
Riskier 4/6/22 450P
Riskiest 4/1/22 450P
I will likely buy both the 4/8 and the 4/1 contracts, heavily weighted to the 4/8 contracts to allow this time for this move to play out.

Next week .. we should see 460 range.. Keeping my eye on 464We were about 1 or 2 pip away from 155. Next week I expect to see somewhere between 460 to 470
I will be keeping my eye on target price of 464.
DO NOT SHORT. Just my opinion. I am not a financial advisor.
_______________________________________________________________________
Are you a "real" Christian or fake one? Here is what Jesus said to be a "real" Christian.
"37 If you love your father or mother or even your sons and daughters more than me, you are not fit to be my disciples. 38 And unless you are willing to take up your cross and follow me, you are not fit to be my disciples. 39 If you try to save your life, you will lose it. But if you give it up for me, you will surely find it."
Matthew 10 37
Are you living your life for Jesus or for you? I hope you are living your life for him. That is a real Christian according to this bible verse.

SPY still heading to 455 to 460 range... No worriesA little pullback today.. No worries.. It is going to be a Green day tomorrow...
Matthew 12:36-37 ESV
I tell you, on the day of God's judgment people will give account for every careless word they speak, for by your words you will be justified, and by your words you will be condemned.”

Resuming to 455 to 460 range Bottom is already in. No crash this month. I will not be shorting at all unless you were scalping in pullbacks.
For right now, TP is 455 to 460 range.
You must receive the holy spirit as a proof that you belong to Jesus. If you don't have the holy spirit living in you, you are no different a Muslim, Buddhist, or an Atheist. It doesn't matter how many times you say you believe in Jesus. Jesus will send the holy spirit to you acknowledge you belong to him.
Romans 8 16
The Holy Spirit himself bears witness with our spirit that we are children of God

SPY heading to 456 ....Not time to short yet.
No crash this month...according to TA...
Make sure to look at both perspectives before you buy or sell.
Luke 13:3
"You will perish unless you repent of your sins and turn to God."

sp500The correction from ATH 4900 looks to be complete, the labeling as of today would be a double. Flat (3-3-5) Zig Zag (5-3-5) the Wave 1 (projected not confirmed) off the c wave low looks impulsive and also looks to have more running room. A break of the top TL on W3 would confirm my count.

SPY short again.Since the SPY had an aggressive week, last week, and it has contacted the daily 200 MA. I am going to short the SPY again with a 29 Apr 431 put position. Looking for the SPY to move to the 400 level over the next 2-3 weeks but will trail a stop loss above the previous day high.

Top of the Top of the TopTake your seats and Prepare for the 4th Turning.
De-dollarization is occurring before our eyes.
The game of musical chairs is coming to an end.
We will be lucky to get away with a debt crisis.
The more likely outcome is a currency crisis.
Your currency is not money, it is fiat. It is important you understand the difference. The thing we call money is fiat credit created by banks via loans. Everything is driven by debt and loans. AKA your life is driven by debt and loans. AKA your life is debt and loans.
How did it get this way?
www.atlantafed.org
But don't you know the Wonderful Wizard of Oz?
Remind me... what does the wizard do in the end?
Note: This is Not financial advice. Just what I see.

SPY Update! Looking attractive here. The trend is a good friend.SPY had been on this strong up trend since the COVID plummet in March 2020. On this chart you can see how it broke the regression trend to the downside.
How low... can you go...?
Notable things to watch:
- The gap that MAY! fill at $400 that can be seen on the daily & weekly time frames.
- FOMC this week; for shits n' giggles.
- Short term outlook - on the Daily time frame the 200 sma (in red) is sitting in the $400 area where the gap MAY! fill.
- Long term outlook - on the weekly time frame you can see that the 200sma (in red) is coming up on the 61.80% ($318.17). (chart attached below)
Just ride the trend & enjoy the ride but use proper risk management. Its all about the journey & the mulah is a by product of it all.
This is not financial advice. This is to be taken as my opinion only!

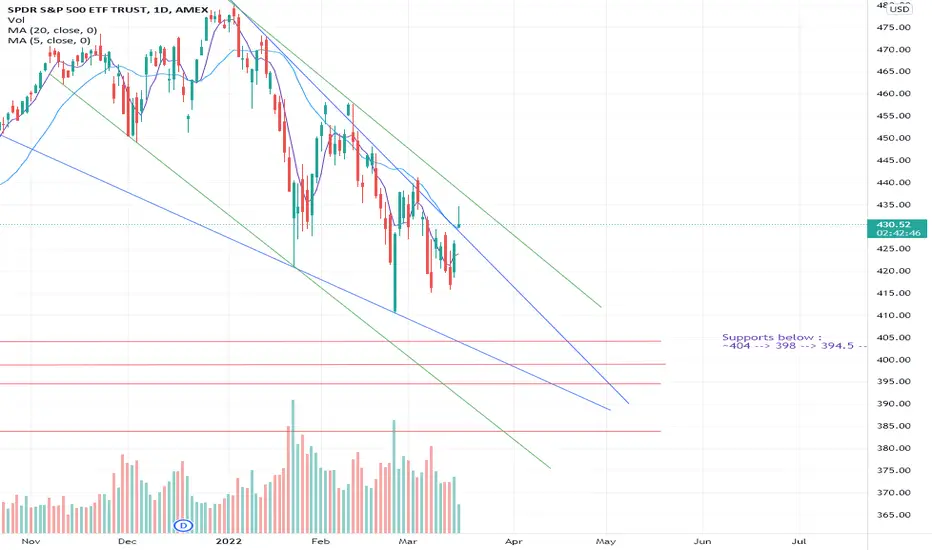
SPY DIEStill PRE-FOMC so take this with a grain of salt.
What have we seen thus far? Reclaim of 20sma? Kind of... hasn't closed above it in the time period of supportive flows.
Where's it at now? Still in pattern of downtrend.
My supports as listed for the next few weeks. I'm still short.
FOMC may alter short term momentum and price, but medium term --> I think SPY dies to 404, 398, etc.,
Trade idea (IF FOMC goes as planned and FED raises 25 bps) : 03/25/22 SPY 420p
Good luck traders.
Bearish ABCD pattern, keeps price action in downward channelSPX, is stuck in a downward trend Channel. Price action sold off from The Bearish Bat Pattern, and price temporarily rebounded but was quickly met w/ sell action on the ABCD pattern.. We're currently at the C leg sell off

15min bear flag on sp500, do we crash at open15min charts shows a bear flag. I see strong resistances to the A leg, which needs to be taken out.
1st target is 4150

S&P500 calls for short - Head & Shoulders TOPFollowed by the Rising Wedge Breakout, we can see very clearly that SP500 lost some momentum - all of this on the background of Fed's Rate Hikes Expectations.
The Head and Shoulders pattern is clear and obvious - let's dig some more important details:
1.Volume Distribution:
The volume distribution in a proper H&S Top should be concetrated on: The left Shoulder, The Head, or both of them - but never high on the right shoulder.
Note that high volume on the left shoulder and on the head are not that significant, while majority of the volume concentrated on the second bottom of the H&S.
The volume distribution here does not support the expected implications of an H&S breakout, and therefore, we should consider a short trade with a bit of suspicious.
2. The Breakout
The first breakout of the Neckline occurred with a little peak in volume - this situation tells the trader to wait for new lower top to test the Resistance of the Neckline.
And indeed, the patient trader received the expected new lower top, and on Friday the power of sellers was present.
The inability to raise above the neckline and the fact that the price rejected from there - was a strong tactical signal for those wanna dive deep into profits.
3. Price Target
By H&S Measurement rules, the objective of minimum potential is 3,865.
When considering the overall Technical picture, the historical resistance from September 2020 (3,592) looks very solid to serve as strong support level.
Conclusion:
Technical wise, the picture is very clear and convenient to initiate a Short trade while maintaining a Stop Loss above the last minor top.
Fundamental wise, the Fed is about to hike 25bps on coming Wednesday, and expected to hike 6 times along 2022.
The collision of Russia-Ukraine sets a descent platform for inflation super nova on commodities whom which cause a liquidity problems and chaos on international trade.
Reversal:
There is might be a scenario in which the Fed will flip over and suggest that the "unexpected" war developments will require the take the leg of the pedal of Monetary tightening and go for more dovish policies in form of QE and maybe keep IR low, I think the possibility of such scenario is low, but still - In such case, all the short thesis is canceled and we should wait to see how the markets react to such case and trade accordingly.
Good Luck!

4 Hour Chart For SPYIn an earlier post I mentioned that SPY looks really bearish for the short term. However, this sideways move looks corrective for the first wave and looks like a C wave will begin next. Looking for 430-432 before we start making the big move down to 400. Check out YT channel with link in profile for more details.

SPY LONGRAGINNNNNNGGGG BULL coming. Shorts are about to lose their cheese. Elliot wave is something special that many people will miss right here when this bull market takes off on its last and final leg up BEFORE the real CRASH!!!

SPY Prediction for 2022Please see chart. This is my views only based on previous trend that I notice.

Bearish PossibilityThis is a potential path for the bearish theory.
As we can see on this downtrend, every time we retrace 0.618 of the previous move we down.
First confluence : FED meeting goes bad, we drop to fill the gap that are not filled near 400, this lead to around 395. Let's say we go down the same % as the last drop, this also lead to around 395.
Second confluence : I took the volume profile indicator from pandemic bottom to previous market top, we have a little air pocket which could lead to more volume support at 380. This is also a fib retracement staring from pandemic low to previous market top, but also the mark for a 20% drop which lead to the bear market.

Bearish Over Next Couple Of WeeksElliot Wave showing this is going to 380-390 most likely over the next couple of weeks to a month. Expecting a big dip into the fed interest rate raises next week and then a further slide after. Tomorrow is the start of a big move down to low 400's.

$SPY and $ES_F I try my best to stay away from "call-out" type posts because that's not really what I'm about. That being said, I'm doing one today in conjunction with an educational post because they fit together pretty well.
Note: on the main chart I'm submitting with this, the topmost moving average (where price is resting as I write this) is the 200HMA using daily candles. The bottommost moving average is the 200HMA using monthly candles.
SHORT VERSION
The short version is that I'm looking for a short entry on CME_MINI:ES1! and/or AMEX:SPY .
THE LONG VERSION
In roughly the past 10 years, ES futures and SPY have fallen below the 200HMA on the weekly candle a handful of times. My data plan on TradingView I guess doesn't give me far enough data to show it, but on my other charting platform you can see that as far back as 2011 almost every single time ES has fallen below the 200HMA on the weekly it has been caught by the 200HMA on the monthly. 100% of the time that price has fallen below the 200HMA on the weekly it has resulted in a sustained period of volatility.
Currently, ES has not breached this sufficiently but it looks to be close. What I'm looking for as confirmation before entering is:
the weekly candle for the week of 1/23/2022 opens below the 200HMA on the weekly candle
daily volume on ES has not fallen below 1.2mn (click the related idea for my overview of using volume to help time when the bottom may be in)
If this criteria is met, I'm going short on ES selling short contracts but also buying puts on SPY as well. While you don't want to buy calls as a way to "buy the dip" due to the impact of elevated TVC:VIX after a sell-off, you may want to buy puts if you are expecting a sell-off due to the impact that an exploding VIX will have on your options premiums.
To be clear, I am not calling for some catastrophic market crash. I'm calling for a technical correction to a regularly established baseline that's all.
PT 1 for me would be 4100. PT 2 for me would be 3400. For context 1 contract for CME_MINI:MES1! (the little brother to ES) nets you $5 per point. If I were to enter at 4400 then by PT 1 (if I'm right), that results in $1500/contract excluding fees.
CLARIFYING STATEMENTS
This is a play I'm entering with or without posting this. If you decide to follow along, you're making a conscious decision of your own. If you decide to enter and this fails, you will get no sympathy from me, I will award you no points, and my God have mercy on your soul.

I SPY danger... final pre-updateIf you've been keeping up with my charting, you know that I am still majorly bearish going into March FOMC, OPEX, and even beyond.
There are plenty of reasons.
MACRO: HOT inflation print --> FED is forced into a corner where they have to raise rates
LIQUIDITY: End of QE from the FED (no money printer)
STRUCTURAL FLOWS: Supportive flows end on 03/16 (VixEx)-03/18 (OPEX) and there is essentially a week and a half afterwards where bears will have their chance to pounce prior to supportive EOM/BOM flows coming on again.
PRICE/TA: 20sma has NOT been regained in this period where supportive flows WERE PRESENT. Bulls have had their chance, and have failed at every chance they had to get above the 20sma close and sustain it.
RETAIL POSITIONING/SENTIMENT:
There were 5 weeks straight of inflows from retail. Major bottoms do NOT have INFLOWS. It's quite the opposite. You would have major outflows to signal a bottom. Go to @Norseman1 on Twitter to see his lipper fund flows equity chart.
Continued pouring in of inflows entails that retail has not yet capitulated. Without capitulation, no bottom.
Retail traders are still trading under the mentality of "BTFD" and it shows in the amount of inflow over the past few months.
And what's happening? They're getting absolutely F*'d. Market is down tremendously, but there's still zero fear.
They will continue to buy the dip until they will be forced to capitulate. Once down hard enough, they will liquidate their positions and get out (hence outflows) --> then and only then can we have a major bottom.
That is my honest view and why I have been posting primarily bearish charts.
Please listen :(
------------------------------
PLAN
Whether it's the blue line or the green line overhead as resistance: I don't really care. The bottom line is that SPY has room for more upside in the next few days (remember the original calendar had until 03/14 for bulls to regain). Spy can potentially move up to 432 (blue line resistance) or 440 (green line resistance). IF it even gets there, that is where you open up positions. You can open tomorrow if you wish, but you'll likely have to hold through some major volatility to the upside unless you hedge with shorter dated call options.
Position:
03/25/22 SPY 400p
Targets: 404, 398, 394.5, 383
I'm not saying we get there, so do NOT go all in on your port please for the love of all that is good.
You do NOT need to play big to win big with puts.
You should be primarily cash as I have warned in the previous months.
Play it lightly to the downside. When you start to see actual fear in the markets (news headlines talking about worst crash in history, people calling for SPY below 380, permabulls switching to all in their port on puts, etc.,) - that is when you flip long.
From 03/16-03/18 onwards to EOM/EOQ ~ 03/30, bears have the opportunity to pounce. Structural flows will not be as supportive.
BUT Everything is dependent on the FED. Watch closely for what they do on 03/16. That will determine the course.
If hawkish, my position will win big.
Best of luck traders. Stay nimble :)

SPY bounce off from the support what's next?Today $SPY bounce off from the support line after wallstreet turns bullish in the market with no positive news. i mention this before from the last analysis, that market could bounce around the support line.
the support line is very visible on the 1hr, 4hr and Daily chart. its also very visible that market is making lower highs ( see my trend line in chart ) a possible sign of short term bullish before it head back to
lower again. keep in mind also that FAANG stocks is following the same chart pattern and trend line with SPY. to continue its momentum SPY needs to break the resistance around 437-440 to continue its momentum.
Overall market still looking bearish. swinging will be tough specially with geopolitical issue going on that could shake the market anytime of the day even in pre
Day trade or scalp target play: 03/ 10 /22
Buy call above 430.34 sell at 433.07 or above
Buy puts below 424.65 sell at 421.89 or below
Hello everyone,
welcome to this free technical analysis . ( mostly momentum play )
I am going to explain where I think this stock is going to go over the next day or week play and where I would look for trading opportunities
for day trades or scalp play.
If you have any questions or suggestions which stock I should analyze, please leave a comment below.
If you enjoyed this analysis, I would definitely appreciate it, if you smash that LIKE button and maybe consider following my channel.
Thank you for stopping by and stay tune for more.
My technical analysis is not to be regarded as investment advice. but for general informational proposes only.
