SPY short idea bearish trade set up for the spy that was under heavy pressure into the close last friday
breaking below the 200 day moving average and breaking below a local support
also showing bearish divergence on the MACD on the daily.
just an idea here. shorting the SPY has not worked out for most but with the recent turmoil in the markets sentiment could change
if we have a gap up on monday morning this idea will be quickly invalidated
what do you guys think? green day or red day for the SPY on monday??
HAPPY TRADING
Spyshort

SPY Definitely in downtrend until ~400-420Most probable path. Expecting it to go to ~420 range before deciding upward or further downward movement.
It may even go to ~395 range too.
Definitely wont happen in straight line. Next FOMC meeting is around 26 March so Feb seems to be sideways and March seems RED.
So far my PUTS have been paying decently. Buying PUT on every GREEN days and dumping on RED.
Note : This is not investment/trading advise. Please do you own DD.

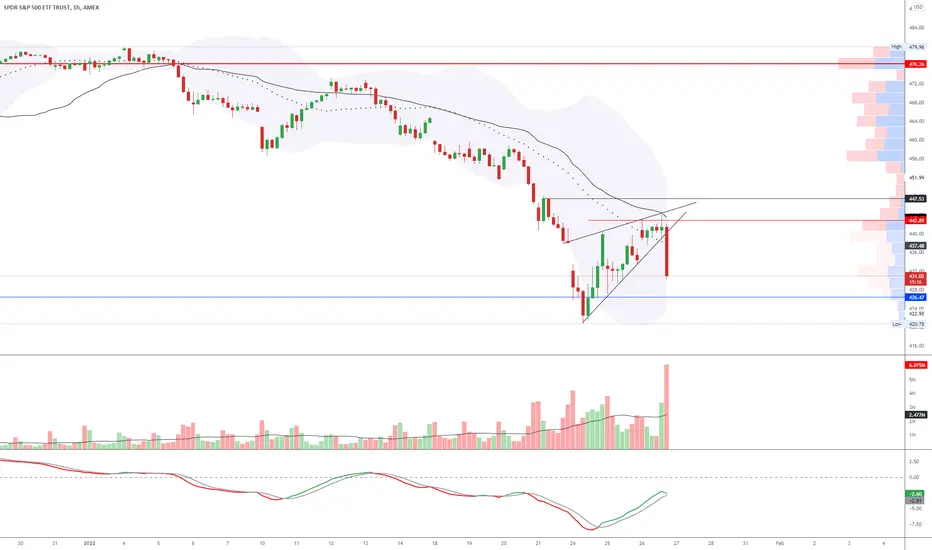
SPYNice double top on SPY , had the 458 trend line drawn last week. I did play some QQQ calls that went to 600% earlier in the week. Took some puts Thursday and Friday and made 200%. There is a fed meeting Monday. I did swing very small puts into it. Anything can happen though over the week leading up to the FED. Important to hold 440 or we could easily see January lows being retested.

S&P 500 DROP expected = 3900-4000 ZONE after small POP to ~4500!I have been looking at charts all week and what looked like major rotation from Growth stocks and crypto to "Value" stocks and crypto it appears to now not be the case.
MAJOR Supports zones were broken in just about EVERY sector in stocks and just about EVERY crypto out there except $ADAUSD and $LINKUSD which are not far off from breaking their support as well.
I am expecting there to be some news from the FED next week that may bouy stocks and crypto to bounce up to the $4500 level in S&P 500 and possibly $43-$46K level in $BTC before I think there will be HEAVY resistance at those levels. I would expect a DROP to the 3900-4000 range in S&P and possibly retest $28k in $BTCUSD. I am posting this S&P chart but the BTC chart looks similar except that it had the massive double top everyone has been watching. Cryto has been a bit of a LEADING indicator on the stock market but they have been correlated for the most part so I am showing why I think there will be at least another 10%-12% drop in stocks before they get major support. Crypto has led the way down and I would expect to bounce before stocks do.
The Chart pretty much says it all but EMA 39 has acted as support and resistance every time over last several years and I woould expect it to do the same now. Resistance is at ~4500 in S&P 500 and the LAST time this sort of "tightening" occurred in 2018 the chart looked eerily similar with a 20% drop from the highs. Coincidentally a drop to 3900-4000 zone woud be about 21% DROP from recent highs.
Trade what you see...

Double topIt would be hard to ignore this double top. However not a big one.
Btw a lot of indicators (Squeeze momentum, MACD) are still bullish or neutrals.
There is not (for me) enough strength in this sole pattern to short SPY and NDX, but you should think to close your long positions.
It reminds me this double top:
It could bounce on the support as it could break trough.
Wait for a confirmation of the bounce if you want to long from ~430$.

DOA trading Strategy - SPY#SPY - Red DOA sniper have been holding strong, we rejected at DOA confluence
We're now respecting that double top on the 3rd point 🙌 that i mentioned in voice chat.
We should see it follow the trend line and the LL

S&P CorrectionAs with my last chart with the Nasdaq, I believe we will see the same with the S&P. The market is struggling to gain momentum and even experts on CNBC/Bloomberg are finding it hard to encourage investors to "buy the dip" because they too are uncertain. If we compare the reasons for a correction vs continuation of a bull market it goes as follows:
Bear Market:
- Fed Interest Rate Hikes
- Fed Tapering (2013 Taper Tantrum, example)
- Inflation
- MACD Crossed
- RSI
Bull Market:
- Low Unemployment
- Retail is Healthy
- $2 Trillion in Savings/Checking in US.

$SPY Looking Bearish -We are bouncing off the cloud here on the daily chart
-Also closed below 26-day ema
-Now we need conformation for the 9-day break and we will go Full port puts
-CPI data on consumer goods will be released next week as well doesn't look too good on my end
-Looking to stay below $458.46
-To top it off looking for a break below $442.42

S&P500 , spy&P500 US Market Index..
Struggling to survive!
It is worth noting that the movement of Bitcoin recently "according to my opinion"
She has become very sensitive to the movement of this indicator, especially in the recent times.
All eyes are on the market opening tomorrow .

Predictive power of US10Y on SPY in 202216 of the first 18 days of this year, SPY moved in the direction opposite of what US10Y did the previous trading day.
I have been using 1/US10Y to get a rough idea of where the market is heading in the next day. The correlation to SPY is immediately obvious upon just visually comparing the 1D candles.
If this paradigm holds up, next week will be... interesting, to say the least.

The bottom is NOT in on SPYSPY appears to be in an ending diagonal, like many other stocks, including AMD. I expect this to resolve with a double-bottom or a slightly lower low by February 18. After that, SPY will be set to set new ATHs.
spy outlookThe sellers seem to have all the control they need. If they continue to show strength get ready for a bounce to the upside around mid 440s. Many retail traders will be looking to get in here. Around 442 many "big boys" with shorts will begin to defend their short positions by adding more. Should be some solid opportunities both ways.

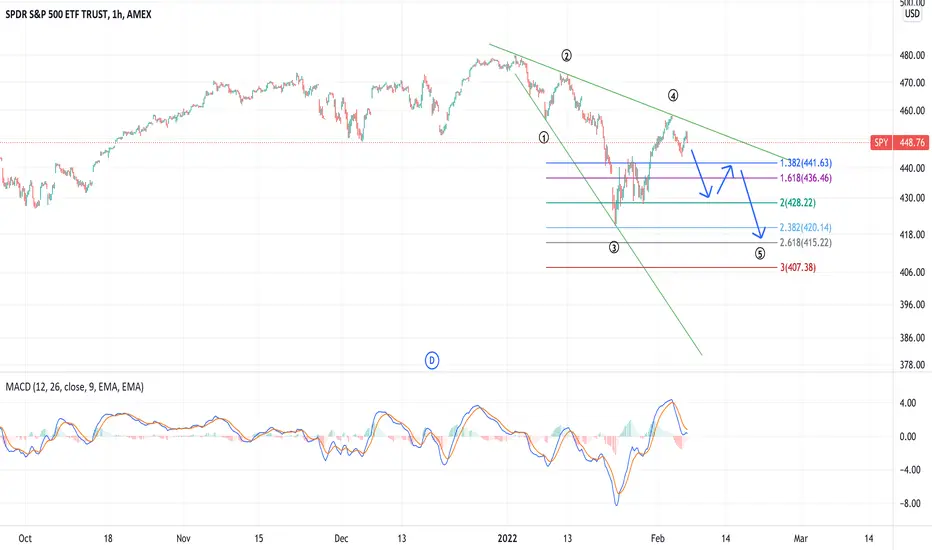
If the bears take over, is this what happens to $SPY?Fib retrace on SPY. Hopefully this doesn't happen, but if it does then there's another pullback that's going to happen later this week or early next.

SPY Financial Crisis to $365Fed sold, SPY broke support at $427 I am expecting a dip to $365 ish with rate hikes next month. I am buying 415 puts tomorrow

OhS**** Bull Trap S&P Market Breakdown Monday. Premarket Upd TraderMan PennyPorkChop looks out for opportunity to survey and examine the latest value activity in the market in a way that makes it helpful to you.
Utilizing Technical Analysis, I play out an insiders view of the activity in the financial exchanges today and gives you my investing 6 years of Trading Volatile current market , examining market patterns , and interpreting of where the market is going.
TraderMan PennyPorkChop Focus incorporates - Specialized Analysis - Exchange and market Education - Pattern and Pattern Analysis - Market Psychology - and Trading Mental Health.
. My Ideal Views are looking for new ways to think about Trading.
. No BS Technical Analysis that works, period.
. Day Trading and Swing Trading.
.New Traders Welcome.
.Swing Traders Welcome.
If you need long term and Value investing your probably not going to learn what I have to share. My Trading periods are 1 min to 21 Days. But you are still welcome, because we do have valuable Lessons for all traders

WHERE IS SPY HEADED - SHORT TERM? In the chart above, I have marked two separate trends/ wedges.
SPY loves to form wedges. The orange, diagonal line is a trend that has been followed since January 10th. The orange horizontal line is a key support range. I expect both of these to conjoin, forming a wedge in the next few days.
The yellow lines showcase a wedge that has already formed, and that SPY has been contained in since January 24th.
I expect SPY to test the 420 range two more times. The first time, rejecting and bouncing back to the top of the orange trendline. The second time, possibly breaking through to 416, and then further to 410.
On the 1hr chart, we also finished with two Hammer Candles, that both have long wicks and a bit of a Morning Doji Star. In the premarket so far, we are .22% lower than the previous day.
Unless these wedges have a complete break, I will shorting (at least until the 420 price range.)

Recipe for Disaster VIX and it’s futures chart indicate a long term pennant ranging from the beginning of this week to today. With most daily pattens forming a wedge and some even a bear flag. Does not look good moving forward. Expecting another leg down for the indexes and stocks next week.

SPY not getting above the 200MA; BAIL on longs; Buy some putsI think the market is mostly waiting for AAPL earning, which come out after the bell. Whether they gab up or down, I think selling will come in. And by selling I mean, "Man overboard". 400 price level on the SPY will be an easy target. Good luck.

$SPY The end of the longest bull run in history confirmed?AMEX:SPY has broken out of the ascending trendline that has held it for the past 2 years.
We saw a bounce on the nearest support level of $424, but it doesn't look good for bulls. Without much strength and with the Fed meeting out of the way, there doesn't seem to be much catalysts to drive the price back to bull market levels.
While RSI is at oversold levels, it does not like we're going to break the support turned resistance trendline anytime soon. Definitely short biased at this point in time, and conservative traders can look to enter when price comes close to resistance ($455-$460 levels). Otherwise, it can be a good idea to start scaling in now for shorts as we're currently at retracement levels.

SPX GANN Scenariosyou may heard about the hyper inflation, end of the Super elliot cycle structure that comes to end, 2022 crash, news....
well basically this analyze focus on bearish Scenario, if price exceeded the gann will invalidated.
gann is easy if we know how to use it, its easy because we dont need to do anything, magical numbers do it for us.

SPY reversal areaLooking for SPY to pull back to the potential reversal area. Several big S&P stocks looking to pull back to the trendline.

SPX500 short Things are not looking very good for risk assets after the break below 200 MA.
FED interest rate increase is a headwind for stocks generally and growth stocks in particular.
It seems to us that things are going to get worse over the coming days.
Stay away from the growth stocks and darlings of low interest rate environment.
Most important -> manage your risk.
