SPX looking weakAlthough the S&P 500 has been pushing hard for the last year, I think the omicron shakeout has brought a new short term correction.
I have laid out the wave count in the chart. This was the 5 wave cycles of the intermediate wave 5 of the primary wave 3 (not highlighted here). This is also been confirmed by the EW channel drawn in the chart. I expect S&P to finish this correction when it hits 4330. However before dip further there will be a relief bounce which will create a lower high at around 4700. Then after hitting the resistance we will have wave C which will bring extreme fear in the market to terminate at 4300. There the sentiment will be rock bottom, However, it will hide great opportunity for the grab pushing the S&P to new highs in q1 and 2 of 2022.
I drew two different scenarios for this.
Why do I care about S&P? Because it directly affects the crypto market.
FOLLOW ME, SHARE, LIKE AND COMMENT
Spyshort

I AM SHORT ON $SPY I understand that the market is waiting on the FED to speak however I believe that there is a Gap that is about to be filled and then the market will surprise me like it always has. I'm really just posting this to get an idea of what others are thinking


$SPY KEY POINTS-SPY has taken some hits as fear rises due to the new covid variant scare
-These past 2 weeks are strong Red candles which show the strength of the bears
-SPY bounced off the 9-day ema on the weekly chart clean this week we will see how it plays out next week
-fib levels indicate that we will retrace back to the sweetspot if we break this support we will see $444.30s very soon
TWO THINGS can happen here:
1) SPY can bounce from that $449 level we talked about since it is acting as strong support and didn't seem to make newer lows Friday. We can see if we make new highs and just bounce from here
2)We are looking to see how spy plays around that $448.96 level IF she decided to break through that pricepoint on monday then we shall see $444 then $426 easily. Fibs are also indicating that one level was hit but the .618 level is down at $444 so we shall see how it plays out
IN SUMMARY: SO here's the game plan If we put all in all together the chances of scenario 1 (BULLS) are slim and with the new variant just breaking out but we can only wait. SCENARIO 2 now is very convincing and we can see SPY pulling down a little more down to $444 levels.
**Key levels to break**
1) $448.96 Below this we can see $444 then $426
2)$461 NOW if we break this level we can go pretty green on this bad boy pretty quick.

Feel Like I've Seen This BeforeTrend is your friend. I'd believe a break of the premarket high would invalidate the channel. Tight stop here. Good Luck.

The Trend is your friend. Friday going to be fun.The last hour will see if we hit the trendline either today or tomorrow. The last test showed a false breakout and even a false breakdown on the lower trendline. Good Luck!

S&P500 - Short IdeaThis is a Monthly chart, kicking off 2022 may be a rocky road for some.
This is a "shooting star" on a monthly chart with bearish divergence highlighted.
Price has yet to "revert to mean" for such a long time.
1% risk 2:1RR
Welcome to December!

Short $SPY CMP $436.58Short $SPY CMP $436.58. Appears to be head and shoulder formation on daily chart. Rejected from long term trendline. Next support ~$420-$425

SPY 4 month forecast 4 month spy forecast, featuring labels with potential entries and exits.(not financial advice lol)

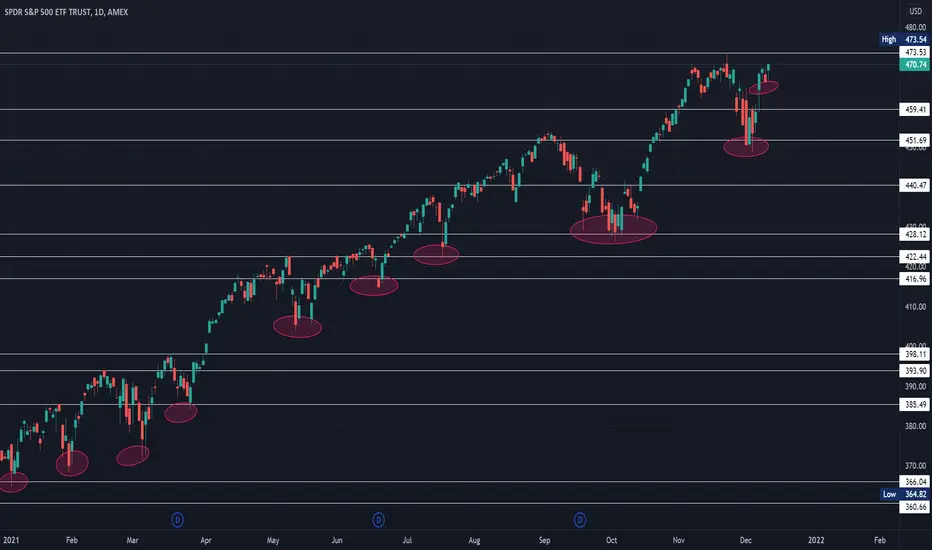
$SPY SHORT AF swing term short Green lines are major support lines which cause them to be Potential profit targets where we can bounce the red is our stop loss
This is a high risk high reward play especially since the market is booty rn BUT Below $459.28 is a safe zone Less Risk if you enter here

Another Day of Selling: Using Volatility adjusted RSI I like this down-sloping resistance and believe this falling wedge is the most likely pattern. The day will start green and maybe even break-through the trendline due to the first of month inflows via mutual funds. However, this will be a false breakout and come back within. The hourly volatility adjusted rsi is overbought. See you down 2% either today or tomorrow.

S&P500 - Short IdeaI lay it out in the video, I just can't get behind longing at these levels.
Spinning Top, Bearish Divergence (not discussed), Crazy run-ups.
Time will tell.
1% Risk | 2:1 RR

$SPY Pull back - Bearish Winter?Out look on $SPY. Could this be the beginning of a Bearish Winter?
Not financial advice!

$SPY GONNA BE RED NEXT WEEK!!!!-Make sure Y'all stay strapped with that BP ready to attack starter puts then she should bounce later on in the week
- As we notice here we broke below the 26-day ema now on the daily which isn't good at all
- We are looking to have a pretty red week But here we have some clear direction so I will be Playing puts on SPY all the way down to around $450
-Going to watch how Monday plays out SPY might go a little green for a bit but over all we gonna see some RED RED next week. Stay Strapped
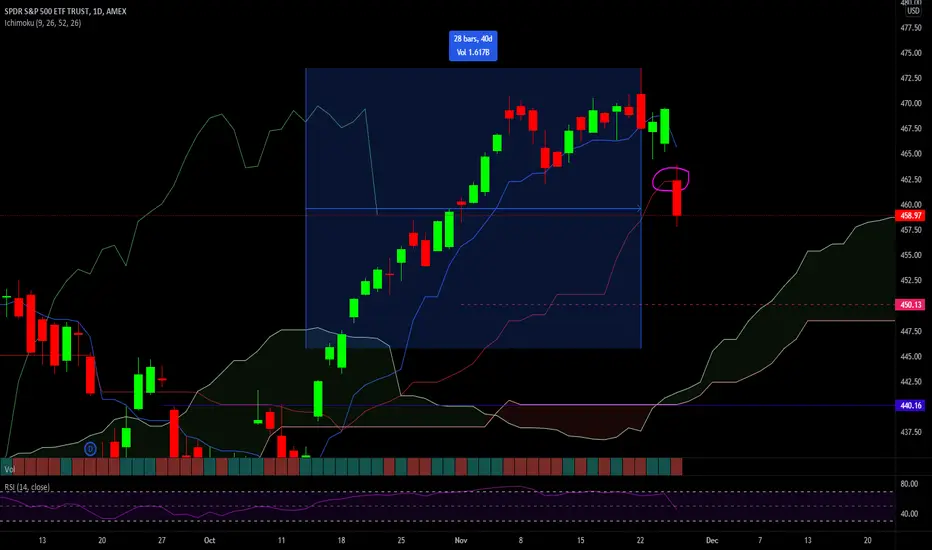
I SPY WITH MY LITTLE EYEExpecting price to hit the $455.50 support before pushing back up to retest the $464 level. Price will either break or fail this $464 level. Personal, it looks like a break and retest could play out but there is also a gap to fill at the $469 level. What do you think?

$ES1! - H&S to 4540??Betting that this forming H&S pattern will complete and we could see a pullback to 4540 levels. Confluence with the .382 fib retracement as well. We'll see!! :D

Stocks Future will be based on 10 Y BondThe movements of the stock market and digital currencies will be dependent on the head and shoulders pattern on the US Treasury bond index, which gives an indication of the imminence of a major price explosion if it is broken upwards, which means without any doubt a significant decline in the stock market and digital currencies as well. also keep buying stocks as long as the resistance still hold , we need a real weekly break

It's going to be a red Christmas...As you can see... the spy is having trouble breaking the $470. I believe we will see one more hit at $470 and a slow selloff. but who really knows? probably the elites...

SPY Oulook 11/8/21SPY is looking for a touch of the 8D at $462.39 which is roughly 4621 ES_F. Would be a great place to long off of. Expecting some weakness the first few days then to go back to the santa rally.

US Market Technicals Ahead (8 November – 12 November 2021)Investors are to take note of the end of Daylight Saving Time (DST) that will effectively have the US exchanges open at an hour later, depending on your time zone starting today.
$SPX is currently closed at 200% ATR(14) away from its 10 days moving average, the first time since September 2020. Data on inflation will be the highlight of the U.S. economic calendar in the week ahead as investors continue to digest the Fed’s decision to begin tapering stimulus measures, marking the beginning of less accommodative monetary policy.
Earnings season is winding down, but there are still several companies set to report during the week. China’s Communist Party looks set to green-light a third term for President Xi Jinping.
Here’s what you need to know in the coming week.
Market Technicals
The benchmark index $SPX continues its high octane rally with a fresh new high established at 4,718 level, gaining +2.00% (+92.15 points) during the week.
$SPX is currently closed at 200% ATR away from its 10 days moving average, the first time since September 2020.
The immediate support to watch for $SPX this week is at 4,660 level, a break of its short term uptrend momentum.
Inflation data
Data on producer price inflation for October is scheduled for release on Tuesday, followed a day later by figures on consumer price inflation.
The CPI numbers are expected to hit their highest levels so far post-pandemic, with economists forecasting an increase of 0.6% month-on-month and 5.8% year-on-year. Core inflation, which excludes food and energy costs, is expected to rise by an annualized 4.3%.
At its latest meeting the Fed stuck to the view that high inflation would prove “transitory” and is not likely to require a rapid increase in interest rates, prompting investors to call it a “dovish taper.”
While the central bank has so far managed to communicate plans to begin scaling back its monthly bond purchases without triggering a taper tantrum, elevated inflation figures that fuel rate hike speculation could change that.
Earnings
Better-than-expected third-quarter earnings have boosted equities and Wall Street’s main indexes closed at record highs on Friday following a strong U.S. jobs report and positive data for Pfizer’s ($PFE) experimental antiviral pill for COVID-19.
Companies reporting in the coming week include entertainment company Walt Disney ($DIS), drugmakers AstraZeneca ($AZN) and BioNTech ($BNTX) along with Softbank ($SFTBY), PayPal ($PYPL), Coinbase ($COIN) and AMC Entertainment ($AMC),
China
The top leaders of the Chinese Communist Party are set to meet in Beijing from Monday through Thursday, where the decision-making Central Committee could give the go-ahead for an unprecedented third term for President Xi Jinping.
The meeting comes at a time when growth in the world’s second largest economy is faltering amid stringent measures to curb virus outbreaks, a clampdown on the property market, energy shortages and disrupted supply chains.
Data on Sunday showed that Chinese exports slowed in October, but still beat forecasts while imports fell short of forecasts, pointing to continued weakness in domestic demand.

Serious divergence on S&PWhat a crazy ride this has been the past week.
life is funny and makes things a little more difficult right before there is a break through.
IDK what the narrative will be here in the next couple of days/weeks though this is coming down no matter what.
The music will stop all together or pause briefly for a quick rush to the chairs like a nice game of musical chairs.
Technicals are all mostly bearish and even though markets have been pushing to ATH theres a serious divergence in technicals.
VIX is noice and cheap and a good time to take some profits off the table.
Good ol Jeffery Bezos sold 166,000,000 worth of stock on the first of this month along with other major CEOs that have been selling the past couple of weeks.
"A CMF sell signal occurs when price action develops a higher high into overbought zones, with the CMF diverging with a lower high and beginning to fall."
www.sec.gov AMAZON CEO
www.sec.gov GOOGLE CEO
www.sec.gov FACEBOOK CEO
www.sec.gov FACEBOOK CEO
That's all folks

The correction's finally there? Watching SPX forming a rising wedge for a couple of weeks. Nowadays might be a good possibility to look for a short position. Watch closely reactions on marked areas. As a target, I would look at the confluence zone of 236 fibo retracement with GAP structure that SPX left behind.
