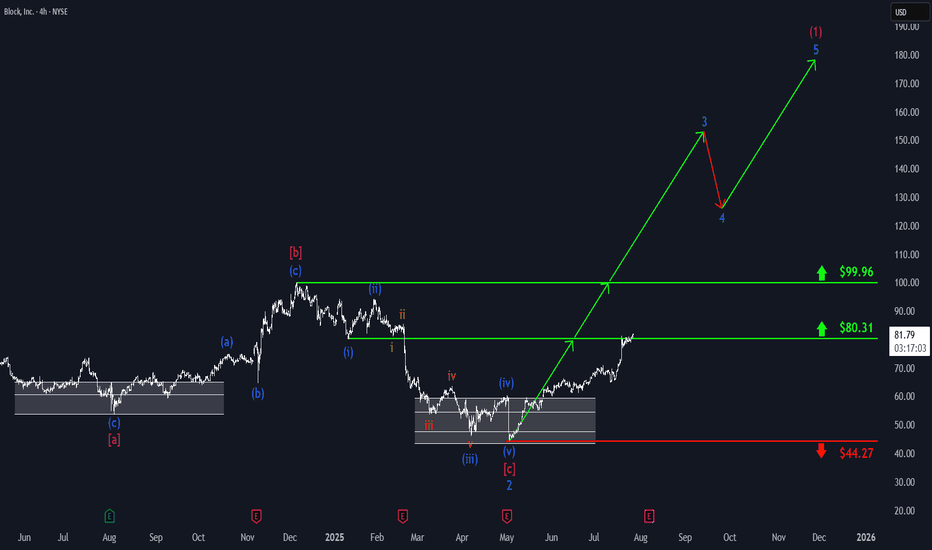
Block: Key Resistance HitBlock has made a strong upward move, reaching resistance at $80.31. Thanks to this positive momentum in our primary scenario, we fully focus on further gains as part of turquoise wave 3, which is expected to push the price decisively above the next resistance at $99.96. The subsequent pullback in wave 4 should also occur above this level, before wave 5 ultimately completes magenta wave (1) – marking the first major leg up in the ongoing bullish impulse.
📈 Over 190 precise analyses, clear entry points, and defined Target Zones - that's what we do (for more: look to the right).
Square
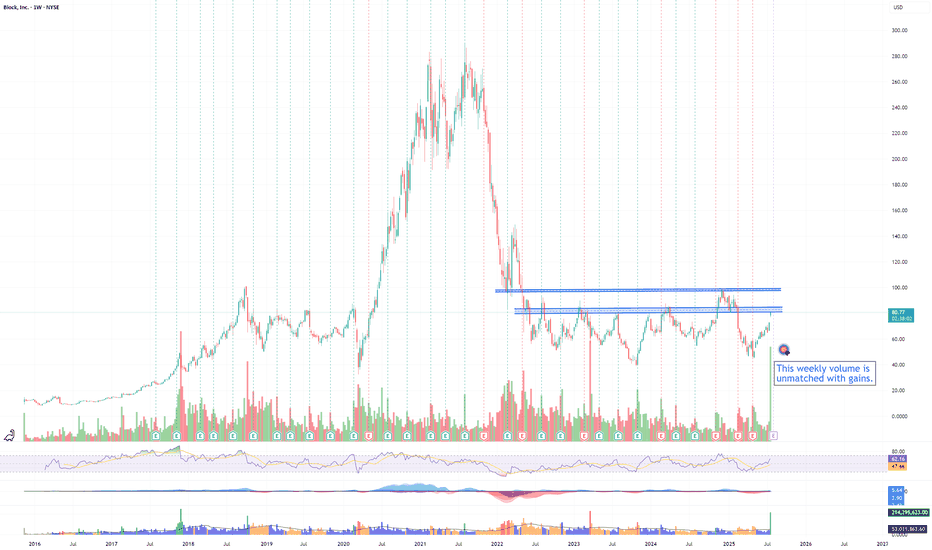
XYZ momentum is buildingXYZ positive weekly volume this week is a first in its history! Even though it has never had this much 'green' volume in its weekly history, there is plenty of resistance to be overcome for this stock
$81-85 will be challenging as sellers all the way from 2022 will begin dumping shares, especially when uncertain market conditions will be pushing them to sell. If it consolidates at 85, plan for a move to 98, where there will be another wave of sellers from Dec 2024 and 2022.
XYZ moves will parallel the BTC market with a lag. When BTC breathes, XYZ will breathe. With a BTC bull, expect XYZ to run.
Rating is neutral as this needs to break through resistance prior to accumulation, not the other way around.
Block | XYZ | Long at $64.84Block's NYSE:XYZ revenue is anticipated to grow from $24 billion in FY2024 to $32 billion in FY2027. With a current price-to-earnings ratio of 13.8x, debt-to-equity ratio of 0.36x, and rising cash flow in the billions, it's a decent value stock at its current price. Understandably, there is some hesitation among investors due to competitive fintech market and economic headwinds. But, like PayPal NASDAQ:PYPL , growth is building.
From a technical analysis perspective, the price dropped to within my historical simple moving average bands. Often, but not always, this signals a momentum change and the historical simple moving average lines indicate an upward change may be ahead. While the open price gaps on the daily chart in the $40s and GETTEX:50S may be closed before a true move up occurs, NYSE:XYZ is in a personal buy zone at $64.84.
Targets:
$80.00
$90.00
$100.00
[*) $134.00 (very long-term)
XYZ breakout imminent? Block NYSE:XYZ looks like it's getting ready to breakout.
It was impressive to see this stock holding relative strength today as the markets were under pressure and selling off.
The OANDA:SPX500USD & NASDAQ:QQQ sold off and this stock closed green.
2 bullish patterns can be observed on the daily chart. A bull flag and and inverse head and shoulders.
The major indices broke key ranges to the downside and this stock has traded in a tight range.
#SQT/USDT#SQT
The price is moving within a descending channel on the 1-hour frame, adhering well to it, and is on its way to breaking it strongly upwards and retesting it.
We are seeing a bounce from the lower boundary of the descending channel, which is support at 0.001300.
We have a downtrend on the RSI indicator that is about to break and retest, supporting the upward trend.
We are looking for stability above the 100 moving average.
Entry price: 0.001320
First target: 0.001357
Second target: 0.001387
Third target: 0.001430
Square ($SQ) Set to LAUNCH! 84% Upside!🔥 Square ( NYSE:SQ ) Ready to Skyrocket! 84% Upside! 🚀
📢 High Five Setup Alert on Block ( NYSE:SQ )!
My H5 Indicator is flashing green, signaling a prime opportunity to take a position in $SQ!
Key Highlights:
Bullish Breakout: We’ve broken out of the Bullish Falling Wedge pattern and successfully retested.
Volume Ignition: Launching off the volume shelf with a volume gap to fill, setting up for a powerful move.
📈 Price Targets:
Primary Target: $149
Main Move Target: $162
This setup is primed for action! Will you be adding NYSE:SQ to your watchlist? Stay tuned for more insights!
👍 Like | Follow | Share 👍
Stay updated with weekly trade ideas using my HIGH-FIVE SETUP trading strategy. Don’t miss out on the next big move!
SQUARE is retesting the Inverse H&S before heading 80% higher! NYSE:SQ SQUARE (BLOCK) is retesting the Inverse H&S before heading 80% higher!
The trading gods have blessed us with a pullback to around $90ish, as requested. This is the retest of the Inverse H&S pattern.
-H5_L indicator is GREEN
-Already broken out of falling wedge.
-Launched off Volume Shelf and filling the GAP.
-Fintech is starting to run
-Stage 2 is just starting!
Buying more here!
🎯$110
🎯$149
🎯$162
NFA
#SQT/USDT#SQT
The price has broken the descending channel on the 4-hour frame upwards and is expected to continue
We have a trend to stabilize above the moving average 100 again
We have a downtrend on the RSI indicator that supports the rise by breaking it upwards
We have a support area at the lower limit of the channel at a price of 0.00490
Entry price 0.00500
First target 0.00552
Second target 0.00582
Third target 0.00621
High Five Setup Alert on Block $SQ !! 84% Upside!🔥 Square ( NYSE:SQ ) Ready to Skyrocket! 84% Upside! 🚀
I posted this earlier, but a couple of people requested a video analysis on Square (BLOCK), so here it is; enjoy!
📢 High Five Setup Alert on Block ( NYSE:SQ )!
My H5 Indicator is flashing green, signaling a prime opportunity to take a position in SQ!
Key Highlights:
Bullish Breakout: We’ve broken out of the Bullish Falling Wedge pattern and successfully retested.
Volume Ignition: Launching off the volume shelf with a volume gap to fill, setting up for a powerful move.
📈 Price Targets:
Primary Target: $149
Main Move Target: $162
This setup is primed for action! Will you be adding
SQ
to your watchlist? Stay tuned for more insights!
👍 Like | Follow | Share 👍
Stay updated with weekly trade ideas using my HIGH-FIVE SETUP trading strategy. Don’t miss out on the next big move!
BLOCK INC $SQ #SQ Inverse head and shoulders could see $200In the fast-paced trading scene, the inverse head-and-shoulders pattern is a key sign for spotting bullish reversals. This pattern features three distinct dips: a lower "head" nestled between two higher "shoulders." When the price breaks above the "neckline," it hints at a possible change from a downtrend to an uptrend.
Traders usually jump in at this breakout point, placing stop-loss orders just below the right shoulder. They also rely on technical indicators like moving averages, the Relative Strength Index (RSI), and the Moving Average Convergence Divergence (MACD) for extra confirmation, creating a well-rounded strategy to seize these trading chances.
Key Takeaways
The inverse head and shoulders pattern is just the upside-down version of the regular head and shoulders.
It can help forecast reversals during downtrends.
Once this pattern is complete, it indicates a bull market ahead.
Investors often take a long position when the price surpasses the neckline resistance.
SQ - Square LongSQ is showing accumulation within this broadening structure.
We're looking for a higher low to change this bearish trend on the smaller timeframe and then can set up with a stop loss below the support.
The current low here could become a partial rise which would give this structure a 70% chance of breaking to the upside as per Bulkowski.
We await the higher low and monitor closely.
#SQT/USDT#SQT
The price is moving in a descending channel on the 12-hour frame and is sticking to it to a large extent and it was broken upwards
We have a bounce from the lower limit of the channel at a price of 0.00367
We have an upward trend on the RSI indicator, which supports the rise
We have a trend to stabilize above the moving average 100
Entry price 0.00380
First target 0.00415
Second target 0.00447
Third target 0.00490
SQ Block Options Ahead of EarningsIf you haven`t sold SQ before the previous earnings:
Now analyzing the options chain and the chart patterns of SQ Block prior to the earnings report this week,
I would consider purchasing the 60usd strike price Puts with
an expiration date of 2024-8-16,
for a premium of approximately $3.72.
If these options prove to be profitable prior to the earnings release, I would sell at least half of them.
BLOCK (SQ): Major Buy Zones Identified Amid Potential Upswing!BLOCK (formerly Square) has experienced a significant sell-off since its all-time high of $290 in July 2021, dropping to a low of $37. This marked the completion of Wave 2 in its price cycle. Currently, we are observing two critical zones:
Must-Buy Zone : Between $33 and $51. Historically, the price has spent minimal but crucial time in this range, indicating strong market movement always follows a dip into this zone.
Okay-Buy Zone : Between $51 and $87. This broader range also saw significant accumulation periods, specifically from May 2018 to March 2020, and again from May 2022 to the present.
BLOCK's price dipped to the Must-Buy Zone recently but quickly reclaimed higher levels, suggesting a potential upswing. Additionally, a clear bullish divergence on the RSI (3-day chart) indicates a possible new momentum phase.
Potential Scenarios:
Retest and Reclaim : On the 12-hour chart, a retest of the high-volume nodes and Points of Control (POC) on the daily and 3-day charts might occur. If BLOCK retests these levels successfully, it could signify a sustained upward movement.
Dip and Buy Opportunity : Should the price fall below these POCs, another dip into the Must-Buy Zone could present an excellent long-term buying opportunity, especially if the RSI indicates oversold conditions aligning with these price points.
Given the bullish divergence on the RSI and historical support levels, there is a strong case for a potential upward movement. However, the risk of a further dip remains, making it crucial to monitor these levels closely for a strategic entry point.
SQ Block Options Ahead of EarningsIf you haven`t sold SQ before the previous earnings:
Then analyzing the options chain and the chart patterns of PSQ Block prior to the earnings report this week,
I would consider purchasing the 72.50usd strike price Puts with
an expiration date of 2024-6-21,
for a premium of approximately $5.25.
If these options prove to be profitable prior to the earnings release, I would sell at least half of them.
Block $SQ - When will SQ flip to the upside?Block NYSE:SQ - Block has been consolidating in this 50% zone for some time now. We are looking to see if it can flip to the upside of that zone. If it can flip to the upside, then there is 250% potential move to the all-time high. Block is one to keep an eye on.
Bullish Cypto Gaming Gods UnchainedIf alt coins are going to rip the biggest hype for the upcomming market cycle has been on crypto gaming.
This chart is a daily line chart for Gods Unchained a popular web3 based game in progress.
Measuring time vs price from past price data in 15% degree intervals typically provides valuable levels and piviot dates.
Each spot a yellow angle meets the circle is not an exact day and price rather measures a significant price level and significan cycle date. Each can and typically have a reaction regarless of where price is on the date or what date it is when it approaches a level.
Cycle end dates are from simply squaring the range by measuring from the cycle top to the point of brakeout at the bottom and doubling this time period.
PAY YOUR PAL - WITH GAINS? EARNINGS CHART & TRENDSI could see it playing out something like the ghost feed, but idk yet.
Watch the trends, watch the breakout from that strong resistance, look for a rejection coming from that strong resistance. This is a great long position, especially should we see that 45 mark.
Not much else to explain.


