Ready to LaunchThis is the beginning of a short squeeze. Can tell by stochastic and DMI. Let’s roll. Next stop high 380s.
Squeeze

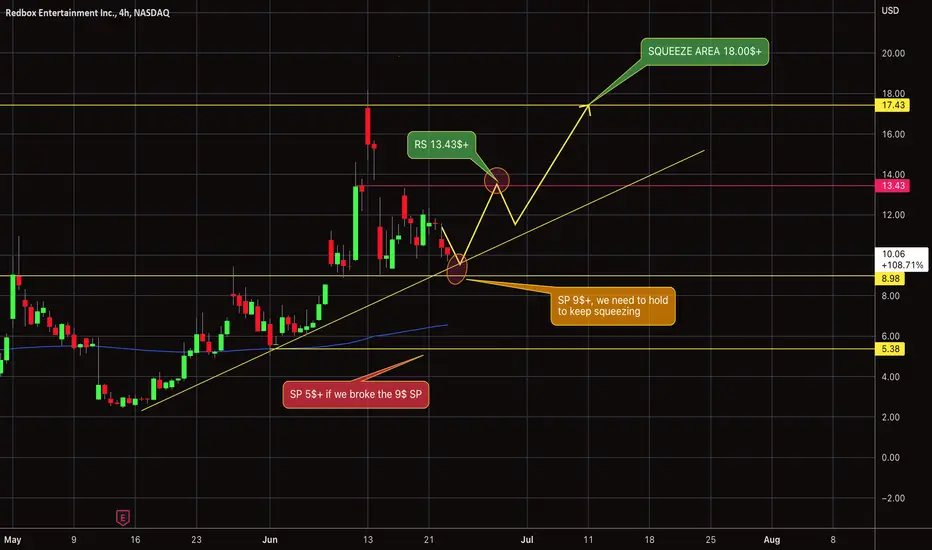
RDBX $ Target Level'swe entrained a consolidation mode the moment we met with our RS level around the 13.50$, and holding above the current support above 9$+, which show us that there's a balance between the selling pressure from above and buying pressure from below, we will confirm the strength of either side by over coming the resistant above 13.50$, which show us the potential squeeze at 18.00$, and going to the 25$ price target , other wise we will see a sell of the moment we break the 9$ SP, and going to the 5$+ SP, and confirm the short control .
NASDAQ:RDBX
BTCUSDT PRICE SQUEEZE + QQQ CORRELATIONImportant things to note:
This is just a small update with small adjustments to my targets.
If you would like me to make a video version of these updates, let me know in the comments.
A quick video overview of BTC and the markets would be easier for me to put out more often via video.
We are currently going on our 9th red week and I have to be honest, I just do not see another down week happening.
Price has been staying in area of interest and squeezing.
QQQ correlation has been falling daily since May 12th.
I have adjusted the price targets by a small amount.
The Volume we had on the drop across all markets is significant.
I have also adjusted the symmetrical triangle to account for the price movements.
It would make sense that the price would squeeze higher and test the trendline.
I expect the trendline test to get rejected due to the overall bear market.
Tightening starts June 1st which would spike the price is the market shutters.
Hey everyone! I just wanted to give you a quick update since I have adjusted a few things and have looked at the overall market during the weekend. Also, it would be easier on me if I could just make a video update every few days going over the tradfi market, derivatives, crypto and anything else I see going on. If this is something you would rather see versus reading me ramble on, please let me know in the comments. I would still put out charts, but it would save me some writing time. Anyways, so I have been thinking about the fact that we are going on our 9th red week and to be honest, it cannot sustain the same momentum forever. I think this would be a good time for the price to squeeze upwards towards 33k while simultaneously testing the trendline. I also expect that the trendline test would be rejected. The lows will need to be tested eventually and that would also fall in line with the fed tightening. I do not expect the market to puke the very day that the tightening begins, but that week or the following week seems likely if the credit market starts to shake. I have also put the downside risk on the chart as well so you know where I expect price to go if things go wrong. I should also note that you can clearly see the correlation to QQQ start to fall little by little. The thing is, BTC is cheap compared to QQQ if you look at the average distribution. So I expect that at these levels, people are going to keep stacking. The volume across all exchanges should also be of note because it was absolutely massive. It is clear the market panicked hard during the last drop, and that makes people oversell. As a bull, that is exactly what you want to see because it creates a price floor that is difficult to break. That's it for today folks! Thanks again and let me know what you think about quick video updates! It will just be me going over things I am looking at currently. Till next time!
So tell me what you think?
Not financial advice. Do your own research.

"GME" - Gonna Have A Really Good Time Hello GME chads!!!
2:61 c/p ratio
derivative settlement
MOON PHASE
We are primed for a run.
My call for the top is 230 as of right now.

Simple Monthly AMC TASimple monthly AMC TA. Parabolic descending curves show duplicating pattern. Second curve pattern being compressed shorter in time. MACD giving insight more time needed. But, Rev stoch RSI showing insane bottom forming with massive historical bounce. Patience.

Hidden Elliot Wave on $AERC - Leg (3)After spending a long time analyzing ticker $AERC, we found some anomalies that may have skewed detection of a proper Elliott wave pattern. The long short of it is that outliers, two events; the massive sale of short exempt shares, and consecutive market crashes caused anomalies in the formation of the Elliott wave pattern skewing it from showing where the move is in relation to the overall movement of the ticker. In short, those events act like a finger pulling down a string or a rubber band "the chart."
On its head the chart appears as though the Elliot wave pattern has completed its (5th) leg and is in consolidation before its next move up or collapse, however several other technical indicators contradict this. When taken into account massive sales of short exempt shares totaling well over 3 million shares in addition to 3 separate market crashes and recoveries of the ticker from the market wide gap downs over the period of only a week, divergence on the on the OBD with the RSI, the stock being on the SEC threshold list, the dips in the awesome oscillator, and finally the move being confirmed with the fibonacci extension hitting and bouncing at the appropriate levels, some of us at HTF have determined a strong possibility that we are in fact finishing leg (3) and preparing to make the move up to (5) before consolidation.
Aeroclean recently received FDA Clearance Provided After Review Of Patented Germicidal UV-C LED Air Purification Technology Proven Effective At Eliminating Harmful Airborne Microorganisms and meets the air quality safety standards outlined by ASHRAE and the CDC for hospital patient rooms, providing powerful protection for patients, including the immunocompromised.


Home WreckerWhen I was a kid my parents and teachers used to tell me silly things. Like...
"You can't beat the system."
"Don't bet against the house."
...
"Pull your pants up."
------------------------------
And I went through life... well, just playing video games and beating everyone on every system.
------------------------------
And then I met GME... so now i'm going to beat the house, with my pants down, and I'm going to bet on it.
That pasted image of the weekly chart... look familiar?? HA HA HA
Sincerely,
Frank Underwood
P.S. this vision came to me in the flames within a dream within a shroom trip within a peyote trip at a campfire within a reservation where its legal (double combos everywhere)
357
357
357

Getting excited for Silver?So with much elation those that were pumping silver over the weekend cheered a 7% gap open on futures. However, this move fails to break the most recent high. If traders are looking for technical confirmation first then this would be the high to mark as the breakout level. Jumping in at the open Monday would be doing so at a dangerous level.

PETZ $ ALERTAfter revers split 1/20 , we have a new resistant to test and break to stop going down furtherer , which is the 3.50$ RS, if we got rejected , we will go down near the 1$, if we broke it , will go to test the 6$ resistant and first sign for bullish reversal if we closed 4h candle above it .

USD/Eur Possible Breakout/squeezeDue to upcoming eu tightening and energy crisis, faster pace of US interest rate rase the squeeze becomes highly likely

BTC - such amount of leveranged long Never seen before. This could lead us to a massive drop.
It needs be wipe out, do not be one of them.

Bullish Long $BBBYBullish Everywhere + Short Squeeze potential…Double bottom, bullish divergence on daily RSI & MACD.

PHUN Bullish Run If...as you can see we have 2 circle areas, 1 is down above the 1$, which is our bottom to confirm that we still respecting our ascending line, and 2 is up just below the 2$ resistant level, and there where we going to see a massive bullish volatility if we broke it and hold above it .

MULN Bullish Run If...yesterday we tested our resistant at 1.55$ and got rejected, now the premarket testing again this resistant, the one signal for the price going again around the 2$, is breaking the 1.55$, and holding/ consolidating above , which will confirm the bullish momentum to take us to test first around the 1.90$ then the 2.16$, where we going to see another squeeze foe the price if we broke it .
if we opened the market and didn't clear this resist at 1.55$ , we might see the price going back to test the support above the 1.25$, and we need to hold above this support to confirm the bullish momentum, and not having a sell off.

Hope you enjoyed your gains as notified, prepare for more!I predict the stock. I know the stock. I’m 8-Ball for stock :)
I’ve been watching this stock for 17 months. Almost every. Single.. day..
I can say a few things… I confidently understand algos being used. I confidently understand MOASS is tomorrow. I confidently understand apes are unmatched. I confidently understand we can buy more each day and it will still be a good price no matter how many digits..
No cell. No sell.
DRS DRS DRS.
Follow me for more GME posts, to the moon gentlemen. I’m proud to be sharing knowledge on my favorite stock in existence and I can’t wait til we are all as rich as they are, without cheating.
APES FOR THE MOTHERLANDDDDD!!!!
DRS DRS DRS
Check out all of my other ideas for consistently accurate GME price prediction as well as theories and discussions.
LINK TO LAST POST I NAILED 110%
| | |
\/ \/ \/

SNAP $ ALERTwe will see a strong support above the 8$ if we continue to go down, and above the 20$ is our current resistant and breakout zone to confirm the bullish momentum and reversal from the bearish trend , cause that will break our ascending line , that started forming since last year October .


GME short "Next W Trades"Fake breakout. WIll be making new lows next week.
"Next W Trades"
"Next W Trades"
"Next W Trades"

TESLA, Neutral, Pivot Point bands. StrategyHello traders. It seems that we will dawn at a neutral point... prices in between the daily pivot point (PP) level (672) and weekly PP (688), the trend could be upward if prices do not go below 672, which could reach 712 to 754, but if they go down of 672, we could reach between 648, 624 and 608. Tomorrow we should review the progress. Pls don't forget we might have an Impulse of Friday's drop, which doesn't mean that the trend has already changed, we should expect to see progress tomorrow. We are still in a downtrend.

BEHOLD!!! GAINS FOR APES!!Hello everyone, I go by the name of Trexarch, or Chem..
Today I am here to display my newly drafted chart analysis for my all time favorite stock.
The analysis;
UP
That is all. Thank you.
Please check out all of my other posts related to GME to understand my full thesis.
Let’s wreck some teachers pensions, am I right boys? ;)
DRS DRS DRS DRS DRS DRS

BTCUSDT DECISION POINT COMING SOON.Important things to note:
I do not to expect the bloodshed in the markets to end anytime in the near future.
The credit market is still looking rough, inflation isn't great, supply issues continue.
The Fed will need to keep a hard stance until they break something, or see inflation at a level they can deal with.
BTC will stay correlated to QQQ until either it decouples via supply squeeze or market conditions improve.
You should expect the fed to pivot eventually.
I am not looking at alts at all until most likely 4 months from now.
BTC is squeezing and it will either fall to the lows we have seen or push upwards towards 33k.
The area of interest is where tons of BTC has exchanged hands. (80K BTC from LUNA).
I am not trading these levels, I am DCAing BTC only, and some Tradfi stocks.
Hey everyone! So I wanted to sit back and let the market soak in the last Fed rate hike and it digested it about as well as I imagined. With each rate hike, we have seen the markets convulse. This is mostly due to the credit market and it is stressed to say the least. Liquidity is drying up and when the Fed starts to tighten next month, it's going to been even drier than it is now. This is going to put tons of pressure on the credit market > which will put tons of pressure on the equity market > which will put tons of pressure on crypto. This is why I only expect the price to bounce around these lower levels until we see the Fed pivot (because they will have to). I am giving the Fed about 6 months until it has to skip a few rate hikes. Eventually they will be back to printing because that is their only option to keep the house of cards in place. BTC in particular will bottom likely near its cost basis of 24k (we have already gotten down to 25k BTCUSD), however it can revisit this level as many times as it takes. Something bullish to note is that 80k BTC (3B dollars worth) was dumped by the LUNA foundation and it was absorbed by the market extremely well. This has created an area of interest for me where there is a lot of gravitational pull. Price will want to go to this level, regardless if it goes down to 24 or up to 38, the area of interest will be hard to get away from in the short term. If you are wondering who is selling, it is mostly forced sellers (like LUNA), and funds that are rebalancing due to increased risk on their portfolios. This is why I am taking the opportunity to buy every BTC I can from them at these levels. That is my main focus for the next 4 months at least, then I will have my eye on alts. This is my personal timeline based on what I see in the market at the moment. I will continue to keep you all up to date with the market and I hope you enjoyed this chart! Thanks again everyone!
So tell me what you think?
Not financial advice. Do your own research.

PCC SqueezeAgain, the PCC @ 1.33 works to provide the Globex Index Squeeze.
Ahead of tomorrow's CPI we'll see where the ALgo's can stretch
the CT.
Happ Cloud for the Win ;)
