Selfkey - BTCvolatility squeeze into upcoming release..
Might be an interesting play
low risk / high reward trade
Squeeze

XRP Buy Candles Triggered Before Major MoveHere we can see the DBT Squeeze Buy Candle triggered on the 2hour time frame right before the major move up, and again before the second move up. These Buy Candles triggered on almost every time frame.
The first move was 21% from the close of the first candle. The second move was 34.84% from the close of the buy candle (even though you would of entered much earlier). The first take profit candle was triggered at 14%, the second buy candle has not formed a take profit candle on the 2hour, but has formed on lower time frames.

Squeeze was broken in gold priceFinally gold broke the squeeze and we can buy XAUUSD
Buy = 1198 - 1200.5
SL = 1196.8
TP1 = 1206
TP2 = 1214

Bitcoin Daily Update (day 204)I believe that it is possible to beat the market through a consistent and unemotional approach. This is primarily achieved through preparing instead of reacting. Click here to learn more about how I use the indicators below and Click here to get my complete trading strategy! Please be advised that I swing trade and will often hold onto a position for > 1 month. What you do with your $ is your business, what I do with my $ is my business.
My most recent Bitcoin Bubble Comparison led to the following predictions: 1 day - 28 days = < $5,750 | bottom prediction: $2,860 by 10/30
Previous analysis /position: “This bounce should provide a good opportunity to build a short, if you are not already in one. There is major resistance from $6,375 - $6,667” / Short ETH:BTC from 0.03143 | Short ETH:USD from $211.96 | Short EOS:ETH from 0.0252326
Patterns: Descending Triangle, head and shoulders
Horizontal support and resistance: S: $6,233 - $6,250 | R: $6,350
BTCUSDSHORTS: Pulled back yesterday and appear to be taking off again.
Funding Rates: Longs pay shorts 0.0055%
12 & 26 EMA’s (calculate % difference): 12 = -2.81% | 26 = -4.74%
50 & 128 MA’s: 50 = -6.05% | 128 = -10.08%
Volume: Big hourly volume on sell off
FIB’s: 0.786 = $6,377 | 0.886 = $6,248 | 1.618 = $5,330
Candlestick analysis:
Ichimoku Cloud: 4h cloud continues to act as resistance
TD’ Sequential: 4h doji indicates incoming volatility
Visible Range: Testing point of control with 1m - 12m lookback
BTC’ Price Spreadsheet: 12h = +0.94% | 24h = +1.73% | 1w = +1.32% | 2w = -0.77% | 1m = +0.12%
Bollinger Bands: Last spike retested MA
Trendline: Trendline I drew yesterday was holding strong, last rally broke through it.
Daily Trend: Bullish
Fractals: Up has $6,555 did not break on last pump (yet) | Down at $6,050
On Balance Volume: Starting to move up faster than price on daily
ADX: Still indicates trendless market
Chaikin Money Flow: Bear div’ on daily
RSI (30 setting): Weekly = 48.84Daily = 46.18
Stoch: Re crossed bullish on daily
Summary: Buckle up your seat belts and get ready for some volatility! If you have forgotten how hard and fast these markets can move then this morning was a bit of a wake up call. Last week I said that I wanted to see a quick spike up to $6,700 in the form of a short squeeze to act as a shakeout before the breakdown.
The pump briefly broke through the horizontal resistance line that I have been watching for two weeks. However it quickly pulled back down and formed a nasty wick on the 1 hour chart. Now I am watching for the price to re explore that wick before continuing the down trend.
These wicks being re explored can often provide low risk entries. I like to set sell orders around the halfway to three quarter market of the wick, in this case that would be $6,490 - $6,525 and I place the stop loss slightly above the top of the wick ($6,601).
As usual I would strongly prefer to short ETH’ due to how much weaker it has been at every step of the way.
I also have an order set to short EOS:BTC at 0.0007474. Click here to read that analysis.

Squeeze from M30 to H12, big volatility expected soonOn all the time frames from M30 to H12 volatility is very low but on the 4H it hasn't been under this value since Jan 2017 so we expect to see high volatility in the next 24-48 hours. How can you trade this? You use Stop Buy above the upper band and Stop Sell below the lower band. This is not the most accurate strategy, usually there are fake-outs so don't forget to put a stop loss. We will place our orders above the green band and under the red band.

Bitcoin, The Great Shakeout| Short Squeeze FractalThere's a short squeeze brewing, all the bulls know it.
Perma Bears are still shorting. What's the big picture trade?
Well, our previous long entry at $6040 for the squeeze was viable and currently still in profits.
A hedge Short was opened at $7370
Analysis of the previous squeeze occurring on 4/7 demonstrates a possible fractal in 6 phases:
Phase 1
Swing low, followed by an initial peak ,
Which are labeled on both charts.
(swing low) (initial Peak),
During that period BTCUSDSHORTS declined.
Phase 2
Initial peak to HL (higher low)
Once again labeled on the chart.
BTCUSDSHORTS climbs
Then Phase 3
C1
C for channel, in both cases a rising wedge. That bounced off 61.8% fib
Previous fractal was a perfect bounce, this time around, not quite.
The end result is a LH, lower high
BTCUSDHSHORTS pullbacks, then goes parabolic
Phase 4
Knife
A pullback from LH @ CI, to form HL2 @ fibo %23.6
Expected current target for BTC HL2 $6400
Phase 5
C2
Projected in the near future, yet present on 4/7 fractal.
C2 should draw in even more Shorts to squeeze.
Climbing from fibo %23.6 to %50
Phase 6
Final Shakeout, Drop back down to fibo %38.2,
Then the rest is history.
Initial Target after squeeze, is $10,000 @ Fibo % 161.8
If you're asking why,
Well observing the Shorts chart,
Bulls need to give up hope, and bears need to believe they're actually winning.
The objective: increase leveraged shorts for a mega squeeze
burn out all the bull hopium
Shake everyone out,
then finally Moon it :)


Bitcoin massive short squeeze could be coming...bitfinex margin shorts are at all time highs again...

Watch out Bitcoin Fkery is around the corner~Just another theory of mine.. short squeeze... but not in the way you think...
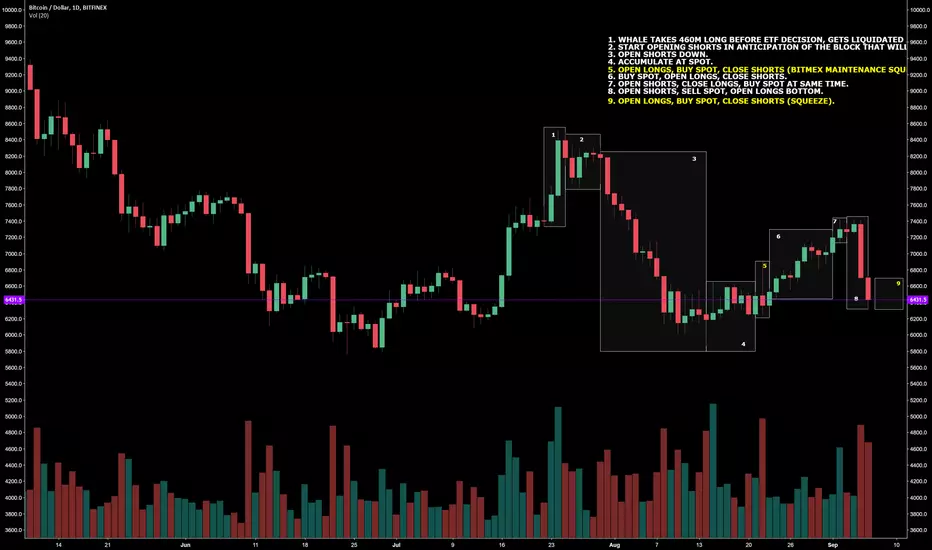
The price absorption at the peak of this rally where longs closed, shorts opened and price was held before this massive dip for Bitcoin got me wondering perhaps this was the same group all along since the start of the 415m LIQ...
based off the previous theory of mine that was pretty spot on...
twitter.com
but maybe for the wrong reasons...
BTC - Bitcoin, the squeeze.Fractals, trendlines + indicators showing good potential for growth.
EXTRA: BTC nearing ATH shorts again.


Bull flag formingLooks like a bullish flag forming after many attempts to break above the trendline. Serious support at 100 and 200 ema where my limit buy is set.

Bitcoin Looking StrongSo the price of bitcoin went about 200 dollars above my target and Right now I am using the bitfinex chart because it is leading the way in terms of bullish strength, which makes sense because it also lead the way in bearish strength on the downfall. There is a possibility that if this strength persists it may be able to break out to make a higher high, above 8500, however, if it doesn't then the bulls on the exchange are fighting to get slaughtered. Also, it appears that a lot of the whales have shown their faces, buying and selling, opening large short sells a lot right now which I think is an interesting note, including a 10000 bitcoin worth of shorts, which I believe is owned predominantly by a small group of people or an individual. That's a big short, and it was a smart positioning, so these are definitely whales fighting it out or whales appearing to fight it out to get a good short position or any other realm of possibilities.
Right now in Bitcoin:
There is a strong channel and there is a symmetrical triangle in that channel, so it can break in either directions, if it does break downwards, I think the bottom of the channel will provide strong resistance, enough to catch it; however, there is a huge morning star inverted hammer, huge. And it marks a strong resistance at around 6430, a close above this wick would how strong bullish meaning and it would indicate a lot of weakness in the bears and it would also mean that the bulls will most likely test the 7700 to 7800 area. If something like this does occur, it may cause a short squeeze, a big one, but I do believe that short is smart money, because of the placement, its really truly phenomenal to witness smart money at play. If the support of the channel is broken, I believe the bears will most likely retest 6800 and I think it will most likely break.
Key Points:
1.) On Bitfinex, Bitcoin is in a strong ascending channel with a symmetrical triangle (in yellow) inside of the channel. The symmetrical triangle can break out either direction, but I do believe that it is more likely to break in a downwards direction because of the inverted hammer which I would like to add had more volume than any point on the rise and each rejection at the bottom, the price objectives of the symmetrical triangle are 7090 if it breaks out to the downside and 7455 if it breaks to the upside. However, I do think that the bottom trendline, could catch it. Please note: nearly all other exchanges do not show a symmetrical triangle or an ascending channel, instead they show a bearish wedge and a head and shoulder topping pattern. I will be posting an update of this on this thread.
2.) If the triangle breaks downwards, I do believe the bottom of the channel can catch it, however, if it does not get caught by the bottom of the channel, I believe that it will test 6800 and it will bounce to form the right should of the head and shoulder topping pattern, or it will completely roll over, because I have thought something would have been resistance supported by TA and it just fell through.
3.) One last thing to take note, is that there is a possible falling three methods* on the weekly, it was something I was keeping a close eye on because if it does come to fruition, it means there will be a huge drop incoming, it is important to question the validity of this though because the third rising candle shouldn't close above the support of the first weekly candle, and it closed about 200 above it. But that is text book falling three methods, in the real world, not everything can always be so clean.
*Falling three methods: about a 5 candle pattern, the first candle is a large decline, and the "three" which can be 2 or more than three but three would be best, should be within the price range of the much larger falling candle. The last candle, the final move of the candle stick pattern, is a significant decline roughly the size of the first candle stick.
Last Analysis:

Shorts still extremely high - no squeeze yetShorts are still extremely high. On the 1D-chart you see we didnt have a real short squeeze yet. Also Yesterday some wallet moved 100 Million $ worth of BTC to Bitmex.

BTC : The Paper Airplane fractal, get ready for landing Hello ! Second TV Idea in the pipe, my first one did react pretty good so I thought I would do some more.
I think the chart speaks for itself. I'm making these conclusions based on my own swing trading system that I will not fully disclose here. It works with a 86.2% success rate since October 2017. The fractal could indicate that further bearish momentum is in the works. This is why I would go short around 6800, or at maximum around 38.2 fib at 6880ish. Any stop loss around 7180 would be safe. I don't have any target down.. We could possibly simply retest the 6000 area. Maybe we break it, and things would get pretty ugly from there. I think we will see a clear direction on Monday, and then depending on the action, we can react accordingly.
The only thing making me tick is the amount of shorts currently opened. Check the BTCUSDSHORTS ticker for yourself. Now, when most people are saying "It's at all time high, we HAVE to get squeezed", even CNBC talking about it, I would like to point out the fact that in between April and now, there has been a really tremendous amount of people moving into leverage, just look at the overall BitMex volume. If there is further downwards momentum, I think shorts can reach 45K easily, why not even more, before getting some sort of squeeze.
Since we dropped in February, we have been making some sort of Wedge, or Triangle, that keeps making lower highs and lower lows. If we take in consideration the weekly Heikin Ashi, We have always seen a continuation from the top, to the bottom, and from bottom, to top. What I mean is that we never touched top, or bottom of the big wedge twice before reversing. We always touched the top, then made a new bottom, then made a new top... Etc. We perfectly touched 8.4 as new top of the wedge from the previous low at 5800. So we should see downwards momentum to find a new bottom. 5500 seems plausible. If we go up from here, it means a cycle is ending, and we have to chart again to find new scenarios. But again, if you're playing the odds on a statistical point of view, there is way more chances of us going down than going up.
I will update this idea as the trade develops. Remember that this is no financial advice, do your own research, have an open mind, and don't blindly listen strangers on the internet. Join the discussion ! Let's exchange ideas.

*UPdate: much accumulation in BTC (CRITICAL) pt. IIDid a mistake in my last idea by scaling shorts/longs in screen mode, now scaled to right axis so BTC price.
This the updated version because I cant delete last idea.
(No financial advise)
I*m a doge
*Scaled and adjusted a bit around, seems to fit my correction curve that I placed months ago*

BTCUSD possible run to $7250Educational purposes only. Trade at your own risk.
Each dead cat bounce since our initial capitulation at $6000 back in February has caused a breakout, however what is most interesting is each bounce has reached 14-15% less than the previous high on the way down. You can't draw a straight line to connect these due to the timeframes, but it's quite obvious what has happened.
We have been in this consolidation zone for way longer than any other time period and it's tighter than in previous consolidation periods (look at June/July).
Overall I am bearish but a good trader looks at everything as a whole. Shorts are basically at an all time high on Bitfinex and we're about ready to squeeze a bit. If we break upward, it will cause shorts to close as people anticipate a full on bull run.
Trade carefully and manage risks appropriately. Most importantly, watch what happens at $7,250... if we get there. If we do, it likely needs to happen before the end of August.

BTC - New short squeeze is incomingThe amount of opened short positions is skyrocketing again. From 17k on Aug 2, it more than doubled by the end of the month and almost hit the previous record of 40k+.
Combined with the recent influx of negative news, it may very well try to reach the new high in the nearest future:
SEC Quashes More Bitcoin ETF Pitches in Another Blow to Crypto
www.bloomberg.com
Will Bitcoin Crash? Learn From History's Biggest Bubbles
www.bloomberg.com
#Bitcoin stuck below $6,500, and @AnthonyGriz is betting on more pain to come
twitter.com
However, the nature of such parabolic runs can be called anything, but sustainable.
It didn't end up good last time in mid April. I have no reasons to believe that this time it will be any different.
I will not be surprised at all if the market "suddenly" develops opposite to the direction mainstream media is pointing at the present moment.

Interesting SHORTS graph structure. NEW ATH COMING?!Previous highs become support for the SHORTS.. 3 times from now..
Will the ETF decision create a new all time high? It's more likely that the ETF will not be approved and this could mean we will see a new all time high on the shorts graph.
When we get a approval we will see a huge jump in the BTC price and the shorts will probably squeeze towards the bottom of the sea.
Time will tell guys!

No more "Short Squeeze".. Because Bitmex Funding rate is > 0For people who still think there will be short squeeze soon ( 21 Aug 2018 ) and the price will jump skyrocket like in April 2018, think again.
They already tried to do short squeeze when bitfinex short position was around 36k a few days back but the bull can only pump the price to around 6630$ and then slam down hard.
I think the better indicator to look for the short squeeze possibility is Bitmex Funding Rate.
Because when funding rate is < 0 ==> it's mean people hold short position more than long position.
The far from 0 down, the more of short positions accumulated. ( You can check rate history here coinfarm.online )
And right now, the rate is > 0 and will be 0.01% soon... it's mean that short and long are almost equal. So no more stupid bears will get Rekt in the near future....
==================
I think a lot of weak hand people, noobies or gamblers already got rekt at Bitmex and those people are out of the market ( no money! )
Right now, only some strong and ( a bit ) smart trader left, and no more stupid 50x-100x at the resistant zone so no more Rekt chain reaction....

MUCH accumulation in BTC (WOW, CRITICAL TIEMS)Scaled and adjusted a bit around, seems to fit my correction curve that I placed months ago.
Lets get together and feel alright (R.I.P. BobMarley)

The BIG Squeeze - XBTUSD - BITMEX - BITCOINIn this scenario, you would be going long right now and run a tight stop, but you would also be loading up your BIG short on the way up and DCA into each target zone as needed. The target on the short is in the low 5k's. This is NOT financial advice, this is just art on a chart. Good luck have fun.

BTC: 4 hr Inverse Head and Shoulders in play? BTC might form an inverted HS pattern on the 4 hr timeframe. The neckline is at 6550ish - if we break this level, it should trigger a squeeze of some of the short positions.
Also note the 14 day EMA is about to cross the 26 day EMA. This is a rare occurrence and I urge you to look at what happened the last time this happened.
RSI is testing support and MACD is still bullish. Good luck!
