SRMUSDTPWith DXY hitting resistance and Crypto MCap resting on support, it's created room for alts to breathe a bit, and that is the rationale for this trade bias. Target entry, is 4hr support from this 12hr bounce printed today. Final target is 12hr resistance.
SRMUSDTPERP

SRMUSDT: Medium-term Waves (Update)SRM price continues to decline as part of an assumed correction in wave C of wave 2. The sales volume is still very low, which indicates the weakness of the sellers.
It could start a rapid price recovery very soon, which could lead to a rise in the value of the coin to $2.
I have already opened a long position and at the end of wave C I plan to increase the position volume at $0.93-$0.92.
I will consider canceling the bullish scenario on SRM in case of activation of a bearish scenario on BTC.

SRMUSDT: Medium-term OpportunitiesSRM is one of the few coins that can make remarkable profits in a short period of time.
And the dynamics of SRM price has no correlation with the main market at the moment.
Decline from $14 to $1 took the form of a 5 wave impulse.
And at the moment, a powerful upward impulse was formed, after which the local correction on the reduced sales volume in the form of a 3-wave ABC pattern continues.
I opened a long position and plan to hold it for a some time, as if the bullish dynamics continues, the price may recover to the level of $4 (by the logarithmic scale).
It is possible that the current low of wave C can still be tested, where you can try to increase the volume of the position.
With the right set of positions, the risk-to-profit ratio is at least 1:10.
Best Regards,
CEO Tornado Capital

WILL SERUM MOVE LIKE THIS ?Just in my opinion, SRMUSDT Will move like this. Will hope this is the bottom for many Coins.

SRM/USDT BREAKOUT READY TO PUMP 100%!!Hi guys, This is CryptoMojo, One of the most active trading view authors and fastest-growing communities.
Do consider following me for the latest updates and Long /Short calls on almost every exchange.
I post short mid and long-term trade setups too.
Let’s get to the chart!
I have tried my best to bring the best possible outcome in this chart, Do not consider it as financial advice.
BUY SRM/USDT ON SPOT
SRM is making this falling wedge pattern
Entry range:-$0.8 to $0.88
Target:- 110%
Short-term target:- 60%
SL:- $0.7
This chart is likely to help you in making better trade decisions if it did consider upvoting this chart.
Would also love to know your charts and views in the comment section.
Thank you

SRMUSDT Possible moveKeep your eyes on the orange trend line a breakout can lead us around 1.166
Nearest support 0.962 - 0.881
Possible stop loss daily closure below 0.788 nPOC
If SRM can breakout 1.166 and turn it to support that can lead us to reach 1.762

#SRM/USDT is breaking out of the falling wedge pattern👀Hello, members welcome to SRM/USDT 4hr chart update by CRYPTOSANDERS.
I have tried my best to bring the best possible outcome in this chart.
#SRM/USDT is breaking out of the falling wedge pattern👀
Entry:-$1.090,$1.130
Target:-30%
Stop-loss:-$1.035
Remember:-This is not a piece of financial advice. All investment made by me is at my own risk and I am held responsible for my own profit and losses. So, do your own research before investing in this trade.
Sorry for my English it is not my native language.
Do hit the like button if you like it and share your charts in the comments section.
Thank you.

SRMUSDT: Trade 1H timeframeHi friends. The analysis by supply and demand. As seems that the chart in the correction trend and its stop at 2.70 and I expected growth to 3.810. So
SL: 2.568
TP: 3.810

SRMUSDT, The price is coming in buy zoneGood Night everyone
Do you know about SRM?
SRM is one of the most popular exchange on solana ecosystem with many bonus for trading in and ...
If you want to learn fundamental & technical analysis ---> send us messages in private (Our id is in my profile)
According to the chart and previous analysis, the price exactly moved in downwards trend after it broke trendline, and at this time its coming through buy zone area, at there we expect the price can support can after some squeeze and consolidation in there its ready to move upwards.
We will update target very soon.
Good Luck
Abtin
Previous analysis :

Soon SRMUSDT will break the resistance and show us big Bull.Please support my work by clicking the LIKE button(If you liked).Thank you!
Everything on the chart.
As you can see that SRMUSDT is also forming a falling wedge , so be ready for bull move.
What about me? Locally, of course, I would like to see this at with $4 to 6.
if it breaks the resistance, it means that we are going to bullish once again.
if not, then there will be another local decline, what option will be - time will tell, im just wait and hold my positions.
Good luck everyone!
Follow me on TRADINGView, if you don't want to miss my next analysis or signals.

SRMUSDT Profit potential (Buy) +244.57%
This pattern is still in the process of forming.
Possible bullish price movement towards the resistance 13.7295 within the next 76 days.

SRMUSDT, Exactly movement to our pathHello everybody
SRM is one the most powerful project that is working on ... ecosystem :D
According to our last analysis of SRM after the price broke the trendline support, we shown on that chart that the price should drop more and after that its ready to have pullback to the trendline and we shown you the path that the price can go and reach
Exactly the drop is completed and according to the price that is ranging and the power of candle, the price want to move upwards to make and complete the pullback
You can buy and take long position but becareful and dont forget use stop loss because the market trend is downward and we need to take position toward the trend
Until now we should wait and watch after the pullback what will happen then we can decide what to do
Previous analysis :
Good Luck
Abtin

SHORT SCALP SRMUSDT#SRMUSDT SHORT WITH CONFIRMATION pls see your entry strategy and then entry this trade

SRMUSDT , We need more correctionHello everybody
If you need any help just as us and send us messages in private
According to the chart you can see the price broke the support zone of trendline and because of that we expect the price can dump more and make our movement and route become true.
In there zone , according to the price its worthy to buy step by step.
Target will be update in future.
Good Luck
Abtin


SRM READY FOR REVERSAL! BUY HERE...SRM has been in the downtrend for so long now, however, it seems like SRM is ready for a recovery from here, but SRM and ride it for the next trend if we reverse it.
Buy zone is marked, buy it from $5 - $4.5 and wait patiently, SL below $3.75 so far..
If you liked it give it a thumbs up!

SRM DAILY CHART ANALYSISSRMUSDT (Daily Chart) - Technical Analysis
Interesting to see how SRM touch new ath at 13.3$ when bullish previously .
Some important levels are also seen here how SRM continues to move down until it touches Fibonacci 0.768
The current 5$ level is also the strongest support for SRM.
It's interesting to accumulate SRM now as a part of your investment.
If the level of 4.8$ cannot support the next bullish move of SRM, we will see a decline to the level of 3.5$
But I personally really believe that at the current level SRM will consolidate and get out of the bearish channel
Keep in mind leverage trading can be highly risky, trade with not more than 5% of your funds in leverage trades.
*Not financial advice.
If you want me to share these trades here, hit the like button and share your views in the comment section.

SRMUSDTPERPSRM's main trend is still downtrend. After btc correction SRM jumped from L3 trendline. and now trying to break L2 trendline. With little push EMA RIBBON-RSI indicators says us SRM can break L2 trendline. after that it will try to break main downtrend (L1). the bad scenario: it will down back again to L3-L4 levels

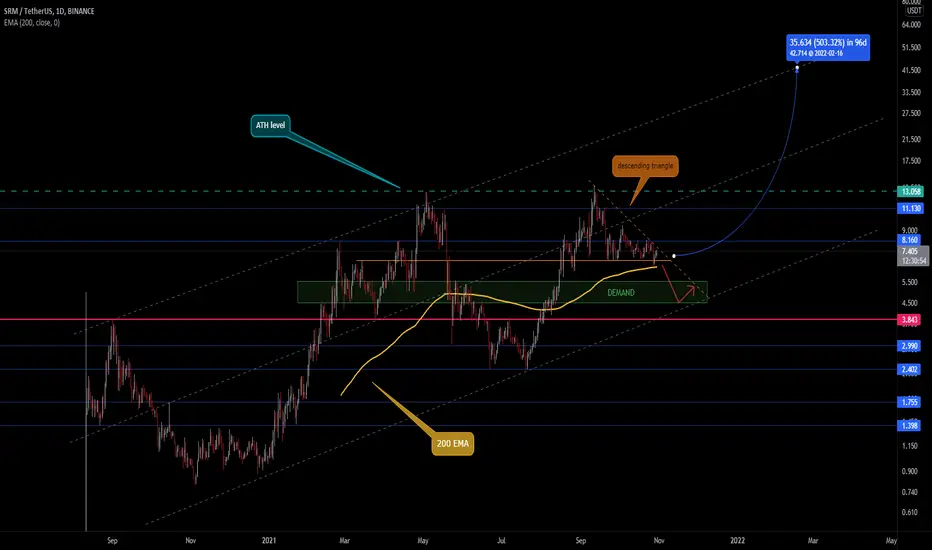
🌊 SRM-- Macro view with levels // TP: 500%The price is moving in a parallel channel and is currently on the edge of breaking out from the descending triangle formation, which has higher odds of breaking to the downside. So if that happens, it won't come as a surprise, and in fact could be a good opportunity to start opening longs in the zone of demand or near the bottom trendline.
However- overall the market sentiment is pretty bullish, and the price is being supported by 200EMA, which gives a good chance for continuation. No valid entries for now, until the price reclaims 8.16 level (nearest resistance) Although If ones like to gamble, they may buy the pre-breakout setup at current price (now) 😎
----------------------
About SRM:
Serum is a decentralized exchange (DEX) and ecosystem that brings unprecedented speed and low transaction costs to decentralized finance (DeFi). (DeFi).
Serum is the only high-performant DEX designed around a fully on-chain central limit order book and matching engine. Ecosystem partners can compose with Serum’s on-chain orderbook to share liquidity and power their trading features for institutional and retail users.
In light of the popularity of DeFi and the growth of DEXes on Ethereum, users and developers are limited by high gas costs and slow transactions. Serum aims to resolve these traditional problems of DeFi, as well as issues of centralization, low capital efficiency, and liquidity segmentation.
Source: coinmarketcap
SRM ABOUT TO PUMP? SRM (SERUM) ENTRY AND TAKE PROFITS MARKED!SERUM is looking super bullish with bullish HARMONIC pattern and broke out of a strong resistance. Wait for the retest of the support and enter into the trade. Also, RSI is turning Bullish, MACD bullish. The TA has been done on 6-8 hours timeframe so it will take sometime to play out!
Some quick Take profits are marked on the chart according to the BAT HARMONIC pattern .
Entry is marked along with the take profits.


SRM regular divergenceSOL and SRM usually correlates, SRM is outside of VWAP std band and divergence formed. short position

SRM TO $5!If you look carefully at the arrows, you see a clear bounce from each of those levels, causing continuous upside movements on it.
Now, with bullish momentum, we just broke out of a key level at $3.9 so $5 is the next stop.
We're long on SRM, holding this in our portfolio because of the great potential it has.
