Mastering Buy Side and Sell Side Liquidity - How to trade it!In trading, understanding liquidity is one of the keys to predicting where the market might go next. The Inner Circle Trader (ICT) method teaches traders how to recognize where big players like banks and institutions are likely to enter or exit trades. Two important ideas in ICT trading are buy side liquidity and sell side liquidity. Once you understand what these terms mean and how to spot them on a chart, you can start using them to find better trading opportunities.
What will be discussed?
- What is Buy Side Liquidity?
- What is Sell Side Liquidity?
- How do you see Buy and Sell Side Liquidity?
- Examples
- How to trade BSL and SLL Liquidity?
What is Buy Side Liquidity
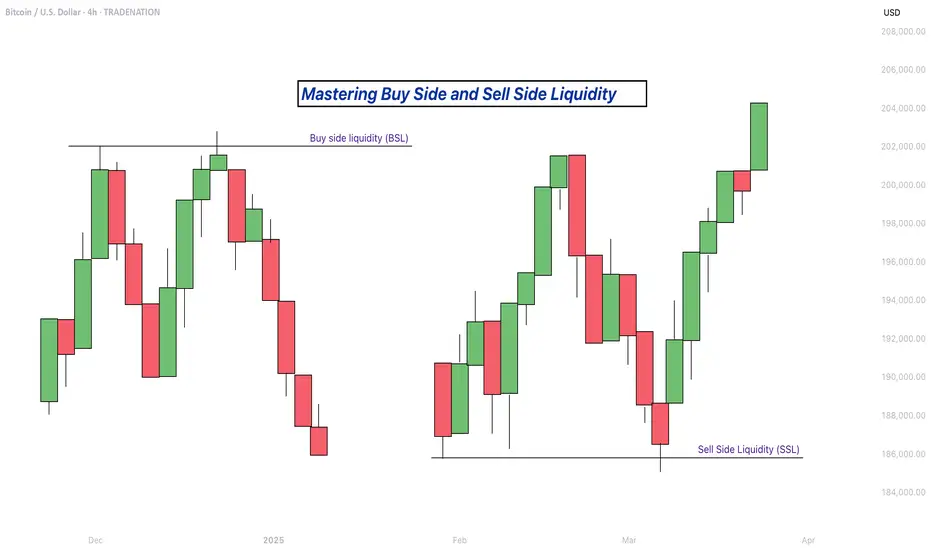
Buy side liquidity is found above market highs. It refers to all the stop loss orders from people who are holding short positions. When the market is going down, some traders sell (or go short) and place their stop losses above recent highs to protect themselves. These stop losses are actually buy orders because closing a short position requires buying. Big institutions know this, so they push price upward to trigger those stop losses and grab that liquidity. That’s why you’ll often see the market spike above a recent high before reversing. That spike is the market grabbing buy side liquidity.
What is Sell Side Liquidity
Sell side liquidity is the opposite. It’s found below recent lows. This is where traders who are buying (going long) place their stop losses. If someone buys a market, they’ll usually put a stop loss just below a previous low. That stop loss is a sell order. Smart money looks at these areas as pools of sell side liquidity. So when the market moves down quickly and breaks a recent low, it’s likely collecting those sell stop orders. After that, you’ll often see a reversal because the liquidity has been taken.
How do you see Buy and Sell Side Liquidity?
You can spot buy side and sell side liquidity by looking at the chart and identifying recent highs and lows where many traders might have placed stop losses. These are usually obvious swing highs and swing lows. If you look at a chart and see a clean high where price previously reversed, that’s likely where traders are placing stops. That makes it a target for buy side liquidity. Same for a recent low, if it’s a clean level where people might have bought in the past, that low probably holds sell side liquidity. The more obvious the level looks, the more likely it’s full of stops and therefore a liquidity target.
Examples
How to trade BSL and SLL Liquidity?
Trading liquidity means watching for the market to run above a recent high (to take buy side liquidity) or below a recent low (to take sell side liquidity), and then looking for signs of reversal. Once liquidity has been taken, the market often changes direction.
When you’re trading the ICT concept of liquidity, the key is not just spotting where liquidity lies, but also knowing when price is likely to reverse after that liquidity has been taken. Reversals don’t happen randomly, they leave clues on the chart. Here’s how you can recognize those signs in a simple way:
1. Market Structure Break
This is one of the clearest signs of a reversal. Let’s say the market grabs sell side liquidity by breaking below a recent low. If price then quickly starts moving up and breaks above the last lower high, that’s a break in structure. It shows that sellers are losing control and buyers are stepping in. It’s the first confirmation that the direction might be changing.
2. Rejection Wicks or Strong Candles
After price runs into liquidity (above a high or below a low), watch the candlesticks closely. If you see a long wick rejecting the level, or a strong candle in the opposite direction right after the liquidity grab, that’s a clue. It means price went there, collected the orders, and got rejected fast. That rejection shows the market might be reversing.
3. Fair Value Gaps (FVGs)
Fair value gaps are small “windows” left in price when it moves quickly in one direction. After liquidity is taken and price starts reversing, it often leaves an FVG behind. If price pulls back into that gap and holds, that can be a great entry point. FVGs act like magnets and support zones in ICT.
4. Displacement
Displacement is a strong, impulsive move that breaks structure. It usually happens right after liquidity is taken. If price moves very fast in the opposite direction after hitting a liquidity level, that’s a good sign smart money is behind the move and it’s not just random noise. That strong push is a hint that a new trend might be forming.
5. Change in Character (CHOCH)
This is a shift in how the market behaves. For example, price might be making lower highs and lower lows (a bearish trend), but after liquidity is taken, it suddenly starts making higher highs and higher lows. That change in character tells you the trend might be reversing.
-------------------------
Disclosure: I am part of Trade Nation's Influencer program and receive a monthly fee for using their TradingView charts in my analysis.
Thanks for your support. If you enjoyed this analysis, make sure to follow me so you don't miss the next one. And if you found it helpful, feel free to drop a like 👍 and leave a comment 💬, I’d love to hear your thoughts!
SSL
Bitcoin - Liquidity sweep before the next move!Weekend Consolidation
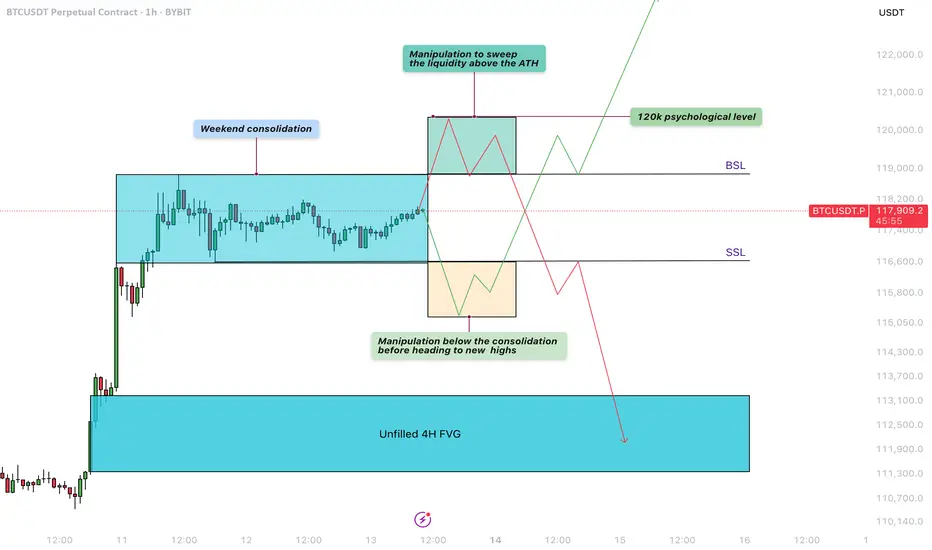
During weekends, Bitcoin often moves sideways as institutional players step back and retail traders prepare for the next move. During this consolidation phase between $117.000 and $119.000, liquidity builds up on both sides—sell-side liquidity below the range and buy-side liquidity above it. After these weekend consolidations, Bitcoin typically sweeps one side of liquidity before continuing in the opposite direction.
Manipulation Above the Buy-Side Liquidity
A significant amount of liquidity has formed just above the all-time high, right below the $120,000 level. Retail traders are positioning for a potential downward move, making this area a prime target for a liquidity sweep. This aligns perfectly with the psychological barrier of $120,000, a level where many traders are likely to take profits.
Manipulation Below the Sell-Side Liquidity
Over the weekend, traders are entering both long and short positions while placing stop-loss orders just below recent lows. This behavior creates a buildup of liquidity underneath the range. Bitcoin could dip below these lows to stop out retail traders before reversing to higher levels.
4-Hour Unfilled Fair Value Gap (FVG)
If Bitcoin sweeps the all-time high and enters a distribution phase, there’s a strong chance it will retrace to fill the unfilled Fair Value Gap on the 4-hour chart at $113.000 - $111.000. This imbalance was created during a sharp move up, leaving behind unfilled orders. Such levels often get revisited as price action seeks to rebalance.
How to Execute This Trade
Wait for Bitcoin to sweep either the low or the high of the weekend range. Avoid entering the market immediately after the sweep. Instead, wait for confirmation that price is returning back inside the range, signaling a clean sweep. On lower timeframes, such as the 5-minute chart, you can look for entry models like an inverse Fair Value Gap to refine your entry.
Final Thoughts
At this point, it’s unclear which direction Bitcoin will take next. The best approach is to wait for a clear liquidity sweep and signs of a reversal before entering any trades. That said, there’s a possibility we may first move up to test and claim the $120,000 psychological level before revisiting and filling the lower 4-hour imbalance zones.
Thanks for your support. If you enjoyed this analysis, make sure to follow me so you don't miss the next one. And if you found it helpful, feel free to drop a like and leave a comment, I’d love to hear your thoughts!
Bullish on BTC. Price Action suggesting upside. No explanation needed.
Simple ICT concepts in play.
Follow for more.
This idea is mine and it is not a financial advice.
It is a mere speculation educational post from me.
DYOR.

USD/JPYI want to see the price violates BSL to take buy stop within FVG on hourly USD/JPY and how it will react. Will it form the highest probability of the OB that will take SSL?


Nas100 Breakdown, Is The Bullish Trend Over ?Hello Traders , This is FX:NAS100 BreakDown on the HTF so the Summary of this is this we starting breaking down some Weekly Structure and we found a monthly FVG that gonna be filled is Aligned perfectly on SSL but before that we gonna see a kind of Manipulation before the distrubution to the downside so yeah the Bullish movement is over after the Manipulation happens!

gold expecting bullish gold is expecting bullish .market possible BSL take what is your view can you share in the comments thanks

USDJPY Short IdeaWe are Currently in Premium, testing a Bearish Orderblock in the form of PDA. Inside this Orderblock, we have a new orderblock from which price moved rapidly away from as well as it took out previous high, which validates the OB. Price Manipulated the Previous Highs with a long wick, making this a Smart Money Reversal. We have a lot of FVG and EQL (SSL) to fill in. As another confirmation, we expect a retracement down as we have an overextended W, which should attract the market to move downwards.
If the price should reach there, I'm looking to scale off some profits at around 110.077.
Two possible Scenarios,
One entry (main setup), it's a lower entry so more likely to get triggered.
One entry at Equilibrium (CE), which has way better Risk to Reward but is less likely to get triggered. (however, LTF created lots of imbalance inside the new OB, which could definitely get filled)
---------------------------------------------------
Confirmations:
- In Premium
- Orderblock INSIDE bigger Orderblock
- Manipulation of the High
- FVG & SSL Targets
- W formation Retracement
---------------------------------------------------
My ONLY Concern for me is that we have a lot of News today which could impact price to move the other direction.
This may fail, but at least I'm not afraid to show my risk to reward box BEFORE it happens, unlike 95% of everyone on this platform.
If it fails, I still have a strong belief that these FVG and SSL level will get filled soon, and I'll still keep them as targets for future trades.

EUR/USD Long London Open - May 23rd '23Very important liquidity grab on London open closing the imbalance below. We have two important rejection wicks on H1 after the liquidatinon. We are targeting the imbalance close above + important liquidity highs. Looking to move SL to BE once price breaks the m15 structure with a candle close above. Good luck traders!

DXY forecast - we can see a potential reversal here after sweeping SSL
- we are currently continuing downwards into more discounted levels within this weekly range

gbpusd expecting bullish gbpusd expecting bullish we are expecting market bullish from fvg area and judas swing is our high


opportunity to capitalize on a bullish move in the GBPUSD Are you looking for an opportunity to capitalize on a bullish move in the GBPUSD currency pair?
Our GBPUSD Wait For Demand Zone Tapped For Bullish Move product can help you do just that. With this product, you can wait for the approach of a demand zone, then look for a bullish move. We always use confirmation in a small time frame for maximum accuracy.
FEATURES:📈 Bullish Move: This product can help you identify and capitalize on a bullish move in the GBPUSD currency pair.
⏳ Wait For Demand Zone: You can wait for the approach of a demand zone before looking for a bullish move.
🔍 Small Time Frame Confirmation: We always use confirmation in the small time frame for maximum accuracy.
SPECIFICATIONS:- Currency Pair: GBPUSD
- Trading Type: Bullish Move
- Time Frame: Small
HOW IT WORKS:1. Identify the demand zone in the GBPUSD currency pair.
2. Wait for the zone to be approached.
3. Look for a bullish move.
4. Use confirmation in a small time frame for maximum accuracy.
FAQ:Q: What currency pair does this product apply to?
A: This product applies to the GBPUSD currency pair.
Q: What type of trading does this product use?
A: This product uses bullish move trading.
Q: What time frame should I use for confirmation?
A: We recommend using the small time frame for confirmation.

Audusd ready to big drop Audusd ready to big drop are you ready for next move i m expecting big droping

P-SAR Support Resistance Price ActionUsing PSAR Support Resistance Indicator, Better price Action using Heike nashi Chart
By plotting S/R from Higher timeframe one can find easy entry and Exits
Signals: EMA Crossover for Up and Down
Confirmation: PSAR Support from current timeframe or Higher Timeframe
Entry: After crossing the S/R Lines ( Price must be above or below the SR Band)
Exit: EMA CROSSOVER in opposite direction or SAR Reversal on Lower Timeframe.

SPX Top Down Analysis 9/27/22We are trading within a range near the most recent low on the daily after a big move to the downside. Definitely still overall bearish but we are trading into HTF points of interest to the downside, basically buy to sell setup's in the making. Missed the trade yesterday off of the range high but that's okay. Lots of news today so I won't be so quick to pull the trigger and just be more reactive today.
7:30am
USD
Fed Chair Powell Speaks
8:30am
USD
Core Durable Goods Orders m/m
0.3% 0.2%
USD
Durable Goods Orders m/m
0.1% -0.1%
9:00am
USD
HPI m/m
0.0% 0.1%
USD
S&P/CS Composite-20 HPI y/y
17.1% 18.6%
9:35am
GBP
MPC Member Pill Speaks
9:55am
USD
FOMC Member Bullard Speaks
10:00am
USD
CB Consumer Confidence
104.0 103.2
USD
New Home Sales
500K 511K
USD
Richmond Manufacturing Index
-10 -8

Bolinger Bands + EMA added to SSL = !!!So I've been using a few Bolinger + EMA indicators and SSL Hybrid/Non for a while now. No specific one, as there are quite a few versions available from TradingViews list of resources. Today I just happened to decide to see what would happen if I combined these indicators and do some strategy testing and play around with a few settings... well, here's the outcome. So far I've noticed better results on 1hour charts but this is just with LTCUSD (just happened to be on this chart when I started doing this so theres no specific reason I chose LTC)
From what I can see though, if you select the SSL Baseline as the strategies main resource for it's calculations from the strategies settings, it's pretty difficult to get a negative result... making this a rather easily profitable blend of indicators combined into 1 neat strategy with few settings have to mess with.
Let me know what you think and if this has been done in another strategy or indicator set that I don't know of yet?


Lucky Indicator Strategy Setup for BTCHey Crypto Traders
So I was playing around with a bunch of different indicators in no particular order (as I'm sure we all have some time or another) and I came across this one which I spent quite a bit of time messing with all the settings and variations of features you can either allow or ignore. I finally ended with this - just over an hour later. I've only had it set to last 1 month's time period but f you feel like giving it a go, I think this setup is rather decent in terms of flexibility, and from what I can see - it's rather successful! ( $1000 SC >> 01 M >> Almost $800 with less than $200 DD )
Dunno what you think. but that's a WIN in my books! Please leave your opinion or results in the comments if you decide to give this strategy a spin.

NZDJPY SHORT IDEAHey guys, i expect this pair to fall and take out the previous h4 lows that were formed

PEACOCK INDICATOR USAGEPeacock Indicator settings and Usage.
Please do Enter Trades when there are gray color in any part of the histogram line of indicator.
Entry Condition when all the Colors are inline.
Buy Sell Signals can be plotted in settings
MACD Histogram indicates trend
Zero line indicates Additional Trend Indicator like Super trend, QQE, MACD, HULL
Additional settings will be updated

CHFJPY 30 MIN PROJECTIONCHFJPY is Overall in UP Trend. It has Grabed the Sell Side Liquidity Previousy And Rejecting After Getting Support From its Order Block Area.
