$SSV/USDT has broken out$SSV/USDT has broken out of a key ascending triangle on the daily chart, clearing resistance around $11.90 with strong momentum.
The breakout targets an 84% potential upside toward the $21+ zone.
As long as it holds above the breakout level, the trend remains bullish with further gains likely.
Watch for a retest for possible entry.
DYRO, NFA
Ssvusdt

$AUCTION Breakout +35% Target!$AUCTION has broken out of a descending triangle on the 4H chart and is now retesting the breakout zone around $10.89.
If this support holds, a move toward the $14.20 target +35.6% is likely.
Momentum looks bullish, watch for follow-through!
DYRO, NFA

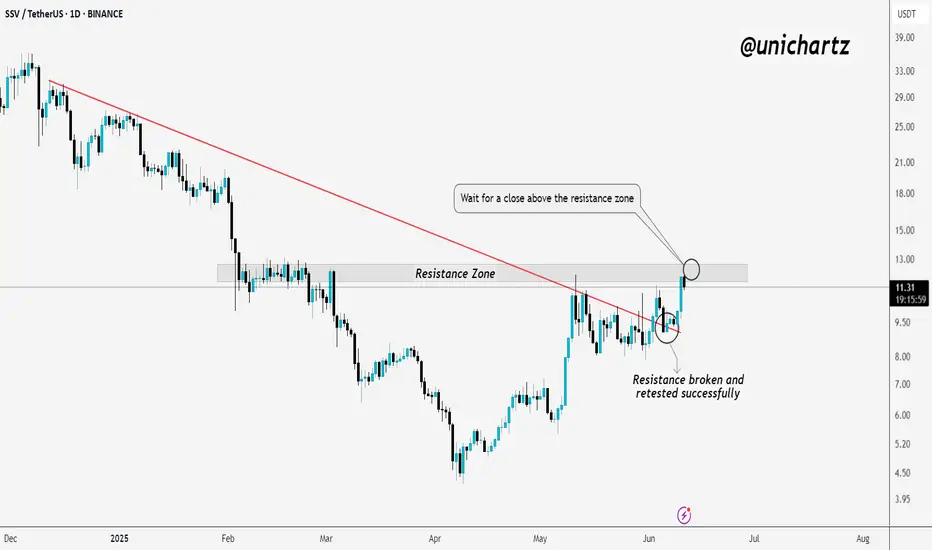
SSV | Bullish Market Structure Shift in PlayTSXV:SSV is showing strong bullish momentum. The key resistance line has been broken and successfully retested, confirming a shift in market structure.
Now, price is testing the major resistance zone. For further upside confirmation, it's important to wait for a clear daily close above this resistance zone.
If the breakout holds, this could open the door for the next leg higher. One to keep on your watchlist.
DYOR, NFA
Trading opportunity for SSVUSDTBased on technical factors there is a Sell position in :
📊 SSVUSDT
🔴 Sell Now
🪫Stop loss 8.37
🔋Target 6.85
📏 R/R 2
💸RISK : 1%
We hope it is profitable for you ❤️
Please support our activity with your likes👍 and comments📝

Trading opportunity for SSVUSDTBased on technical factors there is a Buy position in :
📊 SSVUSDT
🔵 Buy Now
🪫Stop loss 11.90
🔋Target 15.10
📏 R/R 1,6
💸RISK : 1%
We hope it is profitable for you ❤️
Please support our activity with your likes👍 and comments📝

Trading opportunity for SSVUSDTBased on technical factors there is a Buy position in :
📊 SSVUSDT
🔵 Buy Now
🪫Stop loss 21.50
🔋Target 26.70
📏 R/R 1.2
💸RISK : 1%
We hope it is profitable for you ❤️
Please support our activity with your likes👍 and comments📝

SSV USDT longA long scalp trade on SSV/USDT could be favorable if the price holds above key support levels and shows increasing buying pressure on lower timeframes. Look for a breakout above immediate resistance with strong volume confirmation to target quick gains while maintaining tight stop-losses to manage risk.

SSVUSDT Nears Channel Breakout: Bullish Move Ahead!SSVUSDT Technical analysis update
SSVUSDT has been trading within a channel for the past 115 days. The price is now moving toward the channel's resistance, signaling a potential breakout. Currently, the price is trading above the 100 EMA on the daily chart, with high volume observed in recent days. Once the channel breakout is confirmed, a strong bullish move can be expected in SSV.

SSV target 354h time frame
-
Entry: $21
TP: $35.37
SL: $16.6
RR: 3.27
-
(1) Slowly climbing with the uptrend
(2) Got support twice at fib projection 0.382, also made a SL hunting ($19.82)
(3) Target for fib projection is $35.37, overlap with structural resistance
(4) Stop loss once going below $16.6

SSV looks bullish (4H)It looks like we had a big ABC (zigzag) now that wave C which had 5 waves is over.
SSV can move towards the specified targets on the chart while maintaining the green range.
Closing a daily candle below the invalidation level will violate the analysis.
For risk management, please don't forget stop loss and capital management
When we reach the first target, save some profit and then change the stop to entry
Comment if you have any questions
Thank You

SSV target 26.54h time frame
-
Entry: $19.05
TP: $26.5
SL: $16.6
RR: 3.04
-
(1) Potential double bottom, expected time to reach $19.05 is Sep/E
(2) Maintain uptrend since $16.71
(3) Supports are overlapped from uptrend line and Fib retracement 0.382
(4) Need to break out the long-term downtrend since $66
(5) Stop loss once going below $16.6

Potential for the price to riseThe $37.5 to $36 support range for SSV is noteworthy for monitoring as it may indicate significant market changes. If market conditions align, there is potential for the price to rise to the $40 and $42 resistance ranges.

SSVUSDT Corrective Wave 4 CompletedOn the daily timeframe SSV is showing that the corrective wave 4 is likely to be completely. The price has found strong support at 88.6% Fibonacci level, which has been respected multiple times.
Overall, I'd expect at least 1 more wave to the upside, completing the 5-Wave upside move. If/when our upside target will be reached, a 107% profit will be fixed!
Not to mention a superb 1:12 risk/reward setup.
Hope you enjoy it!

Drop and breakout scenarioThe overall trend is ranging with significant fluctuations. There is a descending trendline that buyers are trying hard to break out of.
The scenario involves a potential drop to gain more strength and then move towards breaking the trendline. If it breaks and completes a pullback, it could see significant upward movement. Keep an eye on it.

SSV looks bearishFrom where we placed the red arrow on the chart, it looks like the bullish SSV wave has ended and is now entering a correction phase.
The correction pattern looks like a diametric as we are now in the middle of wave E.
We will look for sell/short positions in the red box.
The targets are marked on the chart.
Closing a daily candle above the invalidation level will violate the analysis.
For risk management, please don't forget stop loss and capital management
When we reach the first target, save some profit and then change the stop to entry
Comment if you have any questions
Thank You

SSV MARKET ANALYSISSSV has broken long term descending triangle with good volume and is expected to move up from current price. If price slightly plummets then it will be good buying opportunity.
Buy Range 44-48
Stop 42
target 52, 56, 60, 64

SSV target 69 in perp4h time frame
-
SSV is retesting the robust uptrend line with a precipitous drop from $55. Usually need more consolidation or accumulation to reverse after a quick dip like this. However, SSV has been increasing on this upward slope since $11, that makes this uptrend pivotal, so the timing is an entry for left-hand side traders to gain perfect risk to reward ratio. Moreover, next entry will be around $25~$28 once current plan got liquidated, and you can have more detail about 1st amd 2nd entry on chart from my previous analysis of SSV spot.
-
TP: $69
SL: $32

SSV ANALYSIS (12H)SSV seems to have formed a large and bullish symmetrical which is now in wave i of this symmetrical.
By maintaining the green range, it can move towards the two specified targets.
The targets are clear on the chart.
Closing a daily candle below the invalidation level will violate the analysis
For risk management, please don't forget stop loss and capital management
When we reach the first target, save some profit and then change the stop to entry
Comment if you have any questions
Thank You

Alikze »» SSV | Corrective wave 4 scenarioIn the daily and weekly time, it has been moving in a medium-term ascending channel, which has encountered a corrective structure after meeting the daily resistance.
💎 According to the type of correction behavior and structure that can be seen in the daily chart, a three-wave correction has been done up to the specified area.
💎 In the first scenario, according to the correction structure, we should probably witness another correction wave, which can be flat until the green box area or until 61.8 fibo of this continuous correction.
💎 The second scenario: But if this modification touches the neck line or the Invalidation LVL area, the second scenario can replace it.
If the behavior and structure of the post changes, it will be updated.
»»»«««»»»«««»»»«««
Please support this idea with a LIKE and COMMENT if you find it useful and Click "Follow" on our profile if you'd like these trade ideas delivered straight to your email in the future.
Thanks for your continued support.
Sincerely.❤️
»»»«««»»»«««»»»«««

SSV/USDT its possible back testing before break the pattern!💎 Paradisers, the recent market dynamics surrounding #SSV have been noteworthy.
💎Currently, SSV is grappling with the descending resistance area, awaiting a daily candle close above this pattern to confirm a successful breakout. However, if SSV fails to achieve this, there's potential for a retest of the support zone between $41 and $38.
💎 In the support area, there's a possibility of price bouncing and attempting another breakout above the descending resistance.
💎 Adding to the bullish sentiment, the MACD indicator has displayed a golden cross, signaling a potential bullish reversal. If this momentum persists, SSV could break out of the pattern and continue its upward trajectory toward our target resistance area.
💎 Conversely, if SSV fails to bounce off the support area and instead breaks below it, there's a chance of revisiting the demand area around $28 to establish new momentum. Historically, SSV has shown resilience by bouncing from this zone.
💎 The bullish scenario would be invalidated if SSV fails to bounce from the demand area and closes a candle below it. In such a scenario, the price could confirm a continuation of bearish movement, possibly leading to further downward movement.
MyCryptoParadise
iFeel the success🌴

SSV target $2504h time frame
-
SSV has been going on an uptrend since Oct 23', this climbing way is very healthy, accompanying with high volume as every pump. Also, SSV made a stop hunting to liquidate leverage on bull side. However, SSV did create a top structure after hitting $63.85, and there is a target at $24 if SSV continues to correct based on the Fibonacci projection. $24 is definitely a sweet level to buy because not only hit 200% fib, but also go into the first support zone. I also provide the 2nd sweet zone to accumulate more spot if SSV keeps correction. When it comes to bull target, we need to know that SSV is the potential leader in DVT sector, which could push its mc up to 20 billion or even higher, so I predict SSV would reach $250 at least in bull market.
-
Bull target: $250~$280

ssvIt is in a resistance zone
If we have good market conditions and money strength, we enter at the green point and continue until the red or blue targets

SSV/USDT Anticipating Bullish Surge from Support?👀SSV Analysis💎 Paradisers, direct your attention to #SSVUSDT, which is currently showing signs of gearing up for a significant bullish move from its support zone.
💎 Our observations of #SSVNETWORK reveal a pattern of recovery after facing rejection at a strong resistance level. The formation of an ascending channel further bolsters the bullish outlook. Should the price maintain its momentum at the support level of $28.55, we anticipate an upward journey, aiming to challenge and potentially surpass the resistance at $40.87.
💎 However, as astute traders, we're always considering alternative possibilities. In the event the primary scenario doesn't materialize, we're prepared for a bullish rebound from a lower support level at $20.99. Be aware that failing to hold this level could result in a downward movement
