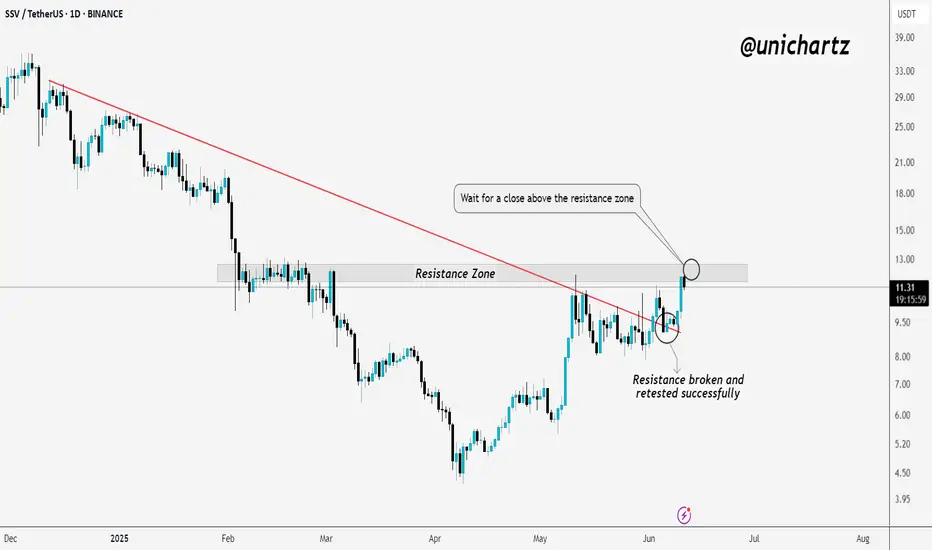
SSV | Bullish Market Structure Shift in PlayTSXV:SSV is showing strong bullish momentum. The key resistance line has been broken and successfully retested, confirming a shift in market structure.
Now, price is testing the major resistance zone. For further upside confirmation, it's important to wait for a clear daily close above this resistance zone.
If the breakout holds, this could open the door for the next leg higher. One to keep on your watchlist.
DYOR, NFA
Ssvusdtsignal
SSVUSDT Nears Channel Breakout: Bullish Move Ahead!SSVUSDT Technical analysis update
SSVUSDT has been trading within a channel for the past 115 days. The price is now moving toward the channel's resistance, signaling a potential breakout. Currently, the price is trading above the 100 EMA on the daily chart, with high volume observed in recent days. Once the channel breakout is confirmed, a strong bullish move can be expected in SSV.

SSV target 354h time frame
-
Entry: $21
TP: $35.37
SL: $16.6
RR: 3.27
-
(1) Slowly climbing with the uptrend
(2) Got support twice at fib projection 0.382, also made a SL hunting ($19.82)
(3) Target for fib projection is $35.37, overlap with structural resistance
(4) Stop loss once going below $16.6

SSV target 26.54h time frame
-
Entry: $19.05
TP: $26.5
SL: $16.6
RR: 3.04
-
(1) Potential double bottom, expected time to reach $19.05 is Sep/E
(2) Maintain uptrend since $16.71
(3) Supports are overlapped from uptrend line and Fib retracement 0.382
(4) Need to break out the long-term downtrend since $66
(5) Stop loss once going below $16.6

SSV target 69 in perp4h time frame
-
SSV is retesting the robust uptrend line with a precipitous drop from $55. Usually need more consolidation or accumulation to reverse after a quick dip like this. However, SSV has been increasing on this upward slope since $11, that makes this uptrend pivotal, so the timing is an entry for left-hand side traders to gain perfect risk to reward ratio. Moreover, next entry will be around $25~$28 once current plan got liquidated, and you can have more detail about 1st amd 2nd entry on chart from my previous analysis of SSV spot.
-
TP: $69
SL: $32

SSV/USDT its possible back testing before break the pattern!💎 Paradisers, the recent market dynamics surrounding #SSV have been noteworthy.
💎Currently, SSV is grappling with the descending resistance area, awaiting a daily candle close above this pattern to confirm a successful breakout. However, if SSV fails to achieve this, there's potential for a retest of the support zone between $41 and $38.
💎 In the support area, there's a possibility of price bouncing and attempting another breakout above the descending resistance.
💎 Adding to the bullish sentiment, the MACD indicator has displayed a golden cross, signaling a potential bullish reversal. If this momentum persists, SSV could break out of the pattern and continue its upward trajectory toward our target resistance area.
💎 Conversely, if SSV fails to bounce off the support area and instead breaks below it, there's a chance of revisiting the demand area around $28 to establish new momentum. Historically, SSV has shown resilience by bouncing from this zone.
💎 The bullish scenario would be invalidated if SSV fails to bounce from the demand area and closes a candle below it. In such a scenario, the price could confirm a continuation of bearish movement, possibly leading to further downward movement.
MyCryptoParadise
iFeel the success🌴
