S&P: Bullish but in need of a pull back.The index has capitalized considerably on December's low, creating a strong 4H Channel Up (RSI = 57.058, MACD = 20.290, B/BP = 4.4419) which peaked yesterday at 2,596.75. Considering this a Higher High, we expect the price to pull back in order to set a new Higher Low, necessary to help the index reach even higher values. Although the technical estimates place the next Higher High at 2,670, taking into consideration the volatile geopolitical environment we will be buying this pull back for a more modest TP = 2,600.
** If you like our free content follow our profile (www.tradingview.com) to get more daily ideas. **
Comments and likes are greatly appreciated.
Standardandpoor500

SPY- Philisophical DiscussionThere are some things that I need to get off my chest.
In the three different types of market cycles, price action, breakouts, and indicators all act very differently from each other. One can know technical analysis, but if you cannot curtail your mindset, and indicators depending on market cycles then you will usually find yourself on the losing side. One can find wonderful patterns and typically consistent indicators but applying them wrongly depending on the market cycle will fill your portfolio with traps (in this case potentially bull traps) The three cycles are: bull, consolidation, and bear. In a bull cycle certain MA's reactions, Stochastic levels or RSI readings will signify vastly different things. For example, a certain moving averaging in a bull cycle will often support price, that same moving average in a bear cycle would suppress price movements. RSI readings are in a completely different range when in a bull versus bear cycle. RSI in a bull cycle is confined to a certain range (upper half of the RSI). During a consolidation phase this range changes as well (very wide range up and down); and of course, in a bear market cycle, this range is changed once again (to the lower half of the RSI). If you look back to previous market cycles you can easily see how these ranges change, ref: the chart below. I have taken the RSI ranges from 2008 and 2000 for finding what ranges I should be looking at on the RSI to determine more accurate swing limits on the RSI. Remember if we are looking at a Daily Chart here in the past then I would want to be using the same timeframe in our current charting to reflect the same levels (as changing the timeframe will change the levels.)
When did all of these rules change all of a sudden at what point did we become officially in a bear market? Well, there are many different definitions for a bear market, some people look at a 20% drop in price, others look at a 16% drop in price. Some look at 200 MAs on varying time scales monthly, weekly, or daily. Some look at death crosses, some look at yield curves in bonds to forecast such events. Others though, like myself use the 21 Monthly EMA. This to me has shown the most consistent historical results, as well as quick delivery, to show us what cycle we are in without having to wait for a 20% drop to happen first to tell us that things are looking bad. Trading this way allowed me to catch the 20% drop instead of miss it and wait for 20% and then get bearish while we have a Bear market rally to the upside. This 21 monthly EMA come in at 263 when we were making our breakout shorts as one of my prior analysis made very clear. Now, this Moving Average comes in at 260. * If price were to get above 263 and hold above it and continue higher on a weekly or monthly chart, then I would be ready to throw in the Bear towel, until then I will be shorting bounces, small timeframe bearish divergences, daily stochastics, RSI ranges, Daily MA tests or small timeframe high volume topping candles/price action, or decreasing volume on the daily chart as bounces are produced.
Daily Stochastic- I do like using the stochastic on the Daily level and then hone in from there a more precise possibly short entry when the 1-4hr stochastics are in alignment with overbought daily readings.
If all indicators behave differently in different market cycles then how can the Stochastic act any different if it is an oscillating indicator? Well, It itself will not act any differently as an indicator but the result of the indications will. We can look back to all of the times the Stochastic has called tops in the last year long Consolidation market cycle and see that the stochastics did call tops but with very little reward in shorting them. But if we were to Track these Daily overbought readings in a bear market cycle it will look vastly different and very profitable.
Daily Stoch 1 year
Daily Stoch Bear Market
2007
2000

Spy- IntradayI thought price would at least get to 258.3, but it appears to be running out of steam on this drive. We will see if it pushes up hard or falls below its agressive trendline supporting the price action from the last 2 trading days. We have a pretty clear channel at this point in purple. I would prefer that price surge higher now and exhaust itself maybe gettting to the top of the purple resistance ~261. If it were to do that soon, then I would expect a more aggressive selloff afterward. If it were to continue to create a stronger foundation with small pull backs and coninued buying then I would assume we stay in those 260 areas a little longer and consolidate there.
If we break down from here, taking out the white trendline from the last 2 days, then we will expect price to possibly hit the bottom support of the purple range and horizontal support at 251.3. What it does from there will be very interesting. We could break, dead cat bounce, or continue the rally.

SPX Monthly Chart AnalysisAfter dropping from the current bull market Trump announced that we were only but experiencing a glitch in the market, suggesting the bull market will continue. However I disagree with that idea, although I do admit that the sentiment has become more bullish on the recent days I still stand bearish on the market. My reasoning being that the market had been overvalued for a long time and had to collapse eventually. This came true last year and with the knowledge of Elliot Wave theory one knows that a corrective move has 2 swings to the downside. Currently price is heading to the next resistance but I believe that price should soon push lower.

SPY- Daily Dose of DestructionDaily Chart
1. Stochastics are in the same area and crossing as they had in SPY's previous drops. Both at the 280 Price level and the second drop started the big sell-off.
2. 21 Daily EMA (in Yellow) has been tested and possibly rejected (we must wait and see)
3. The light blue line is a very historic trendline gathered from connecting the hights in 2008 to the consolidation/correction of 2015 and it comes in right where price is currently.
4. The RSI is now getting to the area where it will be testing its (resistance) at the bottom of the blue line. RSI is momentum and the fact that we have gotten all the way up here which if there were no divergence between RSI and price then price should be at the 268 level currently. (going strictly off of the RSI and where the price was last time at these RSI levels) BUT, we are not we are way below that at 252, to me, this is a less concrete form of divergence.
We are still in a Bear Market (unless we get and hold above 263 on a monthly TF). Being in a bear market means there will be many Failed breakouts to the upside, getting through resistance and then failing (bull trapping many) I would like to draw our attention to volume and the red line I have pinned. Volume has steadily been decreasing as the price is rising (indecision) and it also means that people are getting less and less willing to aggressively buy this market as prices rise (exhaustion).
Wyckoff (I do not know Wyckoff) I have not studied it extensively. But, on a smaller scale and in the manner price looks to me in this 245-252 range really reminds me of a Wyckoff distribution example. The scale is off and really it applies to a much larger timeframe than the 15 minutes, but to me, it looks like Distribution and indecision with unnatural pumps.
Unnatural pumps to me are institutions trying to prop the price up, prop the markets up longer (as long as they can) so that they can continue getting out of longs and transition to short. They have to move SO much money that this is a long, slow and difficult process. They will do what they can to support price, in order to get retailers and other investors in there to buy their positions up so they can be delta negative.
* Yes Price certainly can go higher to where I have the blue and red Boxes outlined in the chart. they are areas where many people will be looking to establish new shorts (traders), for some, maybe few, get out of 401ks that got decimated (retailers), and very obvious place for institutions to get the last of their leveling shorts in and cleanly get back to delta negative. I am not saying, that we cannot go up from here to the 255-263 (highly anticipated range) It surely can and normally would be expected. In fact, the reason why it's so expected by many and many plans to short at those levels BECAUSE it is SO clearly defined, makes me hesitant to believe the market will be that gracious and give the whole world a great clear shorting opportunity.
I think that price either goes down from this level or does get that last exhaustive push up into the box territory. Technically we have broken smaller time frame resistances and are sitting right on top of them. I am going to be very interested to see what price does in this last hour. market makers need to manage their risk within standard deviations. Price has been able to move in increments of 1.5% in this bounce. Today we gapped up very aggressively putting almost 4% on the chart. Makers should be hedging down about 1.5% in on the small timeframes to stay within their risk tolerances, of standard deviations of average true ranges.

SPY- Topped or Topping?Bearish Divergence on the 15 min chart. In a bull market, this is nothing. In a bear market, this is everything. Living below the 21 monthly MA means we are in a Bear Market (the 21 MA is at 263)
If the market surges for a higher high this divergence will be continued for a more clear short opportunity and more extreme divergence.
In my opinion, Price is completely topped at 263 SPY. That was major support and hence it has become major resistance.
This bounce move could be over or it could only be 50% over. What really matters in what direction will price go after the bounce.. IMO .. DOWN DOWN DOWN.
Any shorts in this area above the 200 MA is gravy & will be profitable trades.
Yes, the perfect short should be up in the 260 areas, but there is NO guarantee that price will get to obvious resistance.
The short-term managed risk trades: I will be de-risking in the 244 area. closing more shorts and waiting to see if we break our uptrend support line. If we get below the 244 zones I will be putting on more shorts. The final Trade will be a break of the 234 support, once that is broken it will be a very violent drop. IF this support breaks then Please Please Please, do not be in the market looking for upside movement. It will be the last point for you to get out and secure your 401ks etc...

S&P's Dead Cat Bounce to 2575.Since the last update and comparison made on the similarities of S&P's candle sequences between the 2007 and 2018 Death Cross patterns, the index followed exactly the 2007 pattern, as it completed a nearly -15% decline and then rebounded. Based on the 2007 pattern this rebound shouldn't exceed +10% and our estimates put it around 2,575. This can be described as a "Dead Cat Bounce" and in 2007 it was what led economy into the 2008 recession. The new lows on the index should be expected in about 2 months.
** If you like our free content follow our profile (www.tradingview.com) to get more daily ideas. **
Comments and likes are greatly appreciated.

SPY- Bounce, Found. Top, Searching.So we got the bounce we were looking for, right in the 230 area that I had been talking about. So far so good. Let's see if we can get an idea as to where this market will top out for its final exhaustive push-up. Where would be an area where many people who got caught would love to take the loss for the peace of mind of not being in this market? Where will the bots be programmed to scale in the shorts? What areas have recently been important catalyst levels?
I will throw out my target area even though there is no way to know exactly where price will reverse. I'm going with 251-252.
I will be watching our horizontal support closely at 249 to see if we have the steam to break through. If we manage to make it above that level then my target will be the next stop.
I like the confluence that it has:
1. Horizontal at the lows of the one year consolidation period.
2. Fibonacci .382 retracement level
3. 21 Exp Moving Average (which is projected with my orange dotted line)
4. Fed news breakdown area *When rates hiked, we broke this support that day)
We obviously could top out at any given point from where we are right now or all the way up to 263 but the area I will be watching most closely is the 251-252 confluence. We will see if we make it there. These sorts of things are extremely hard to predict, so I like to put weight on price action and volume as we approach critical areas. Looking for a spike in green volume as the price is going up sharply to put in a top. I will also be watching for smaller timeframe bearish divergence as we progress upward.

SPY- Be a Wolf, not a Sheep. We are aggressively approaching our 200 week moving averages. Throughout this bear market / crash I will be watching very closely certain key levels to close trades out and to allow the price to firm up and then re-enter shorts after whatever bounce has occurred. There is no way to know for sure that a bounce will happen at any given level but whenever you have good confluences coming together a disciplined trader will have a plan to exit at those levels given that the volume characteristics at that point in time confirm your hypothesis. Using volume is a little tricky sometimes. But I boil it down to looking for Large spikes in volume (that were not news driven or during the market closing or opening.) A larger than normal volume, while the price is going down, would signal that the price is trying to put in a local bottom if the price is moving up and produces a large volume bar then a local top.
I have my confluence of supports coming in at 233.25 it could overshoot that slightly, especially with the very heavy sell pressure and then get supported up for a bounce. Our moving averages could get pierced slightly and then price still move up. The point is that sometimes there are specific levels that you want to have razor accuracy and execute orders on a breakout as we did at 262.5 for our "Big Short" Clear level, low risk trade with easily manageable risk. The reason we could buy that one off of the 3-minute chart as it was breaking down was that we had a very clear structure that had been tested 5 times already and we were waiting for that final breakthrough (as the more a trendline is tested the weaker it becomes).
How will I know that we are not going to bounce or even slow down at this confluence... If we never get a substantial volume that shows there are buyers trying to enter in with force.
I am hoping for a bounce for everyone's sake that could not have gotten out of the market earlier, but now feel that price has gone down too far that they will be throwing away all of 2 years gains. I hope they realize that they could very quickly throw away 10 years worth of gains if they cannot get over losing some on their account. Managing your portfolios correctly right now and for this next year will be 1000X more important than choosing which mutual funds or ETFs to hold in a bull cycle. You must be nimble and you must be willing to pull the trigger and take a loss. You might even want to recapture the losses you've incurred by shorting the market. I have not been interested in stocks until I saw the potential crash coming back in August, with the very enticing monthly bearish divergences. Before that, I learned a very hard but clear lesson about market cycles while trading BTC this last year. Do not trade against the trend/market cycle. Become one with the institutions. If the sheeple people are all thinking one thing do the opposite. If the news is telling you something, then your being manipulated to react.
In this chart we can see that we had measured moves (Yellow Dotted Line) from the top of the peak down to the bootom of the bear flag. We copied that same line down to get a target price from that structre in the 230's. We have a little bit of supportive price action on the left side of the chart and I have drawn in a support line at 240 and 230. The 200 EMA and MA weeklys are coming in at around those same areas respectivly. No bounce is guarenteed but the indgredents are here for it to happen if buyers decide to make it happen. A bounce could trick some people and I am sure the news will tout that we are recovering the worst is behind us. Please, think twice before beliving that one when you hear it. IMO, It will simply be the last place to get out at a decent place or get accounts set up and ready for shorting at those tops from any bounce. We will be looking of the bounce to test some Moving averages and key resistance levels for establish that short (or for some exit to cash.) Ill be posting every step of the way on this glorious journey to the depths of opportunity.
Disclaimer: This is not financial advise this is intended for educational purposes only. Trade at your own risk, I am not a financial advisor and am not registered with any agency and all assets have maximum loss potential.

When will we have a retrace ? [SPX]Hmm must admit that I was expecting to have a FIBretrace on the S&P 500 already.
The levels, to look for a FIB retracement, are now 2490 and around 2390 area (both previous tops).
We just had a bounce of 2490 level, if we close below this level during the week, then I will expect a new drop to 2390.
As before,
Shallow retracement (FIB 0,3-0,5) the bear market will resume right away.
Deeper retracement (FIB 0,5 and above) we are "on pause" properly until beginning of January.

S&P, New economical crisis is started.Dear friends, a very important warning to all of you.
This chart shows us that the new economic crisis is coming.
Reasons why it is here:
- 10 years of growth. We all know every 8–10 years there is a recession around the world.
- Technically, downtrend started when the price broke down 2620 level.
- Also, US government increase the interest rate to take more money into their economy from the whole world.
I recommend to open Sell near 2620 middle - term goal is 2190.


Are we entering a new recession? Death cross on S&P.S&P500 printed this month a Death Cross (MA50/MA200) and is already -8.40% since its appearance. A similar occurrence took place in 2008 at the start of the global financial crisis. In 2008 the Death Cross resulted into a fast (around 1 month) -14.40% decline on the index and assuming that the same sequence will follow, we can expect S&P to drop below 2,400 and around 2,360 in the next 20-30 days.
The similarities (another -11.80% decline that preceded) and timing between the two periods are astonishing. If the monetary governing bodies do not turn the very negative market psychology around soon by reviewing their policies, we should be looking into a new recession in 2019. If that's the case, and the full bear cycle sequence of 2008 is followed, we may see S&P losing around -55-60% of its value, making a bottom around 1,250.
Of course this is just a technical projection based on recurring patterns and similar candle sequences from the historical volatility at hand.
** If you like our free content follow our profile (www.tradingview.com) to get more daily ideas. **
Comments and likes are greatly appreciated.

S&P: Channel Down towards 2500.Since the price crossed the 2,603 1D Support last week, it has developed a Channel Down on 4H (RSI = 35.405, MACD = -23.590, Highs/Lows = -14.5707). According to its High/ Low sequence we can project that the next Lower Low will be completed on a -6.85% decline, i.e. 2,506.50. Use this technical suggestion with extreme caution however as the Fed Interest Decision tomorrow and the statement to follow, may largely unsettle any technical pattern.
** If you like our free content follow our profile (www.tradingview.com) to get more daily ideas. **
Comments and likes are greatly appreciated.

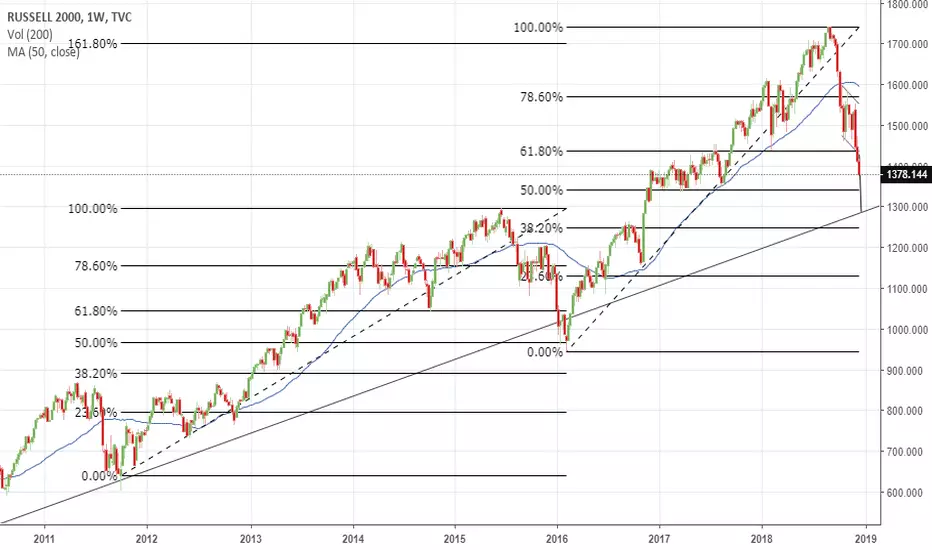
RUT downtrend continuationIt is clearly not going to stop. Continuation pattern show a target well below 50% retracement level.
I draw Fib Levels from the previus time price hit the multiyear trend line. You see it bounced at 50%. During downtrend though, to rely on support levels is a very weak strategy. It is way better to observe price action once they hit one, to see how they react.
This is like a train almost 10 years long: The higher the speed, the harder is to stop it.

SPY-Bottom of Correction? OR Top of a Cliff? I go over the moving averages this time; as well as, looking at some Historic Chart situations leading up to the crash of 2008. We touch some correlations of BTC and the stocks. Sneak Peak of my BTC long term chart.
Enjoy,

SPY - Red skies in the morning; sailors take warningPlease enjoy, a little thrown together but I wanted to get this out there.

SPY - Preparing for the best trade ROI in 10 yearsLooking good so far if you're shorting this beast.
We have a very clear cut bear flag consolidation that makes trading very easy. It hasn't broken yet but when it does " LOOK OUT BELOW " Its measured move takes us to 230 on the SPY. Although 240 will provide some bounce as it has nice support on the left side of the chart. If 263 breaks then that we should start to get our impulse down. If your long in this market then please just get out & let things pass. If you're short then congratulations because you might be on top of the best trade in 10 years in the legacy markets.
We could, of course, get another relief rally/dead cat up to 270 upon which will be the next shorting opportunity. Price at this point should be capped at the 275 area due to some death crosses happening in our MA's
Happy Trading

S&P500: Bullish pattern to 2800.The price action on 1D highlights the existence of a strong Resistance zone at 2,818.50 - 2,825.25 and a strong Support zone at 2,603.00 - 2,626.75. The current overbought Channel Up pattern on 4H (RSI = 73.422, MACD = 9.300, Highs/Lows = 46.8393) mirrors the previous one that following the test of the Support zone, it reached the Resistance zone. Following Powell's strong outlook today, there are high chances for this aggressive buying pattern to duplicate in the next 5 - 7 sessions. Our TP is 2,749.25 and 2,795.50 in extension.
** If you like our free content follow our profile (www.tradingview.com) to get more daily ideas. **
Comments and likes are greatly appreciated.

S&P Update
These markets were made to move! As discussed in my previous analysis from Septemeber we have massive bearish diveregence in the RSI on our legacy markets. Elections helped give us a reason for uncertainity but politics will not ever Trump the Charts. They will simply fulfill them. The chart is King and news and events will often confirm what the chart had first been telling you. What is the Chart telling us? Well it all started in around 2009. We had a recession instigated by the mortgage crisis. To get us out of this crisis our government had done many bad things that essentially "kicked the massive can down the road." Bailouts, excessive Fed printing, lowered interest rates for years, and many other things. We used electric shock resuscitation to keep our economy from collapsing into a depression. Well the electric bill from that crisis is just now showing up in our mail box. "But the economy has never been stronger" "What better time to pay your outstanding bills?"
Anyway, economic theory doesn't really matter because the markets are really all about the chart, perception and fear.
To sum up:
Purple is our consolidation range. Breaking up or down out of that will be the start of an impulsive move.
(Disclaimer: if you are only willing to invest Long/Bullish and you think that this is just a small correction and the wost has already come. Then, you must not buy into the market until we are comfortably living above the purple resistance on a weekly chart. This is very important only then will my analysis and hypothesiszed downward move be nullified) Even if somehow the market gets up to that purple line resistance it will be printing a third even stronger monthly bearish divergence and it would be a clear sell signal. If the markets make it up half way to that resistance and fall of it will be a head and shoulders reversal pattern. So not until competely clearing and holding above it would be "safe" to invest.
Green 55 Weekly is acting as short term resistance at around 272
Gold 21 Monthly is supporting our arses at 261.5
The black and bold lines you see run us back all the way a decade to our last recession. We have since stayed within these lines which have created a quite large Ascending Wedge pattern, which eventually break to the downside at some point.
Speculation: There have been very strong correlations between the crypto market and the SPY even though they are avery different parts of their repsective market cycles. The fact that BTC had made another impulse move down today could help the SPY break the purple consolidation support. Watch out for a Monday gap down where we test 260 support as well as the falling wedge support. The falling wedge support is difficult to get exact so I will be trading off of horizontal supports (like 260) and MA's.
This breakdown could start tomorrow or in 3 months. There is really no way to tell exactly. I would say there's pretty good evidence that it could happen soon, but we could also get supported and play around more in this purple flag consolidation and pull in more bulls before crashing. Like I mentioned above we could create a 3rd divergence by going all the way to the top purple resistance or part way up to create a head and shoulders patern, before coming down hard. Supports: 240, 213, and if we complete a full corrective bear market we could hit our highs from 2007 at 153.

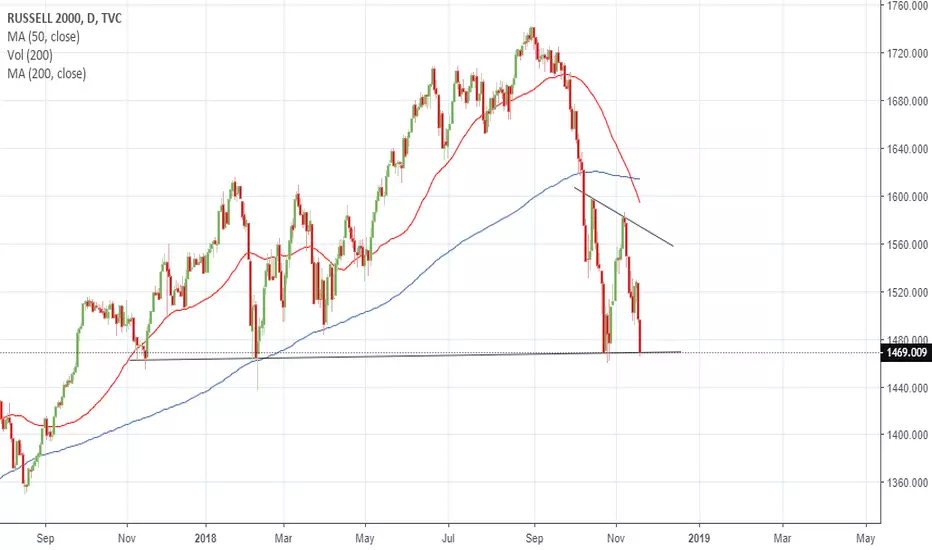
US small caps Testing support$RUT ready to bounce again, for the 4th time in a year and the despite the us dollar index surge?
S&P: Triangle expected to break upwards. Bullish.The index has developed a Triangle on 1D (RSI = 45.946, CCI = -19.2621, Highs/Lows = 0.0000) following last week's decline near 2,670. On the positive side the 0.618 Fibonacci level (2,684.75) was only broken that one time on 1D and has since held support. If that level stays intact then the Triangle has more chances to break higher with 2,767 as the first Resistance before the critical 2,824.75 test. We are still bullish on medium term with TP = 2,893.
** If you like our free content follow our profile (www.tradingview.com) to get more daily ideas. **
Comments and likes are greatly appreciated.
