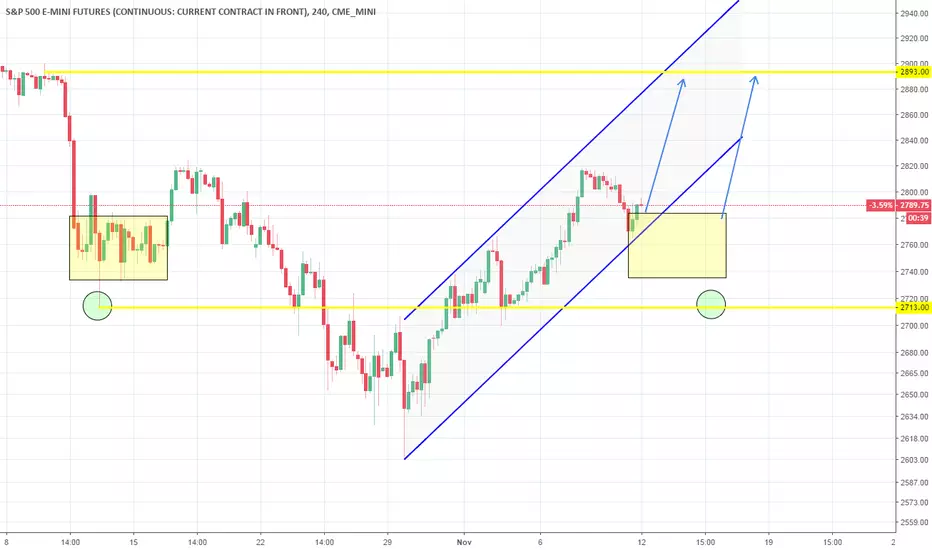
S&P: Target hit. Channel Up intact. Bullish.TP = 2,785 hit before the index successfully made a Higher Low on the 4H Channel Up (RSI = 56.761, MACD = 13.990, B/BP = 9.0660). The two high probability scenarios arise. Either the Channel Up goes for a new Higher High or 1D consolidates (RSI = 52.278, Highs/Lows = 33.1786) the overbought STOCH, STOCHRSI (> 80.00) and Williams in a symmetrical pattern as seen on the chart. In both cases the target is a near 2,900 extension (TP = 2,893).
** If you like our free content follow our profile (www.tradingview.com) to get more daily ideas. **
Comments and likes are greatly appreciated.
Standardandpoor500
U.S. elections: + 11.57%. Don't miss this buy opportunity.This chart illustrates the performance of the S&P500 index after each mid-term elections in the United States.
We can see that since 1950, in the past 17 elections, the S&P has grown in the months that followed in 16 of these occasions. The only exception was after November 2002, when the index suffered -17.62% losses in the months that followed. The rest of the bullish sequences gave on average of +32.84%.
If this time the S&P follows this pattern (+32.84%), then we get a projected target of 3,720. This is of course less realistic as this average takes into account periods (before 1998-2000) that the market was very different and less complex than it is today. It is safer therefore to calculate the average since 2006, a period not too far ago, much more similar to how we know the market today. So the past three post elections gains gave an average +11.47%.
This is good news for long term investors, who can now safely go long on U.S. stocks.
** If you like our free content follow our profile (www.tradingview.com) to get more daily ideas. **
Comments and likes are greatly appreciated.

S&P: 1W support made. Expect long term uptrend. Long.spxThe index successfully rebounded on the 1W support/ Higher Low cross (2,600) and immediately broke the previous 1D Channel Down (STOCH = 67.897, Williams = -37.898, B/BP = 12.6380). This is creating a very bullish long term development on S&P with a new 1D Channel Up emerging. The long term uptrend of 1M (RSI = 60.871, MACD = 144.470) should provide the necessary bullish support during this post earnings period and especially after Thursday's rate is announced. We remain bullish with TP = 2,785 (1W Gap Fill) and 2,900 the extension.

S&P -What Now?We are still living within our larger Flag type consolidation... During this consolidation time, there's going to be volatility and much more difficulty in determining short-term direction.
Bottom Line: I hypothesize that price will go down from here and test our support again at the purple flag support which also is in confluence with the monthly 21 exp moving average.
Oct 11 Low connects to Oct 29 Low to create bullish divergence in the RSI. From this, we expected a bounce, and we got it. Since there is no measured move to be taken from the divergence we look to our scholastics to get some perspective. Are Daily Stoch's are in the overbought regions and are currently crossing. Also, the 2-4 hour stochastics are also in the oversold area and ready to come down.
We have attempted to break back into our previous channel (brown lines). Though we did pierce this resistance and do not see signs of getting meaningful support from these same lines. We have a few moving averages (discussed below) as well just under us but I believe that they will soon break and we will continue down to the purple support lines.
It's important to note what has happened with our moving averages as many algorithms buy and sell off of them.
200 EMA Daily (Red Line Plotted)
- We are still living below this highly watched EMA, which until we're trading above it things should be looked at with bearish lenses.
200 EMA (Daily) Crossed with our 21 EMA (Daily)
- Shortly after this cross price action went up and tested and rejected this exact area. Of course, we could go up again and pass through that level, but I am strongly leaning toward more downside to approx 264.
55 EMA Weekly 271.23 is right under us and is supporting price in the meantime, breaking below that level will mean that it will become resistance.
21 EMA Monthly merging with our purple Flag Support line in such a beautiful way. Its angle is the exact same as our purple line and has remained so since Sept 3. I expect that we will get supported even upon the second test of this area but if it doesn't hold. then this will be a Very Great entry for shorts and a clear area to manage risk from. So the bottom purple line is very important as its 2 things. Bottom of Flag support and our Monthly 21 EMA.
For the next few weeks, I expect price action to further decompose down to either of the purple support lines.


SPY Small TimeframeI would be looking for an entry shorting to our support at the brown line/ testing lows from Oct 11 If we break our current purple bear flag. 1.7% profit potential. If we counter trendline break up for another retest of resistance then I will wait.
We have been hovering around our daily 200 MA which is coming in right where price is currently. So, if we break below this purple support then we will have 2x the resistance if the price tries to move back up.
This is a short-term analysis, but please check below where I have attached a much more thorough bigger timeframe chart for great shorting opportunities. Check it out!

S&P Wihin a Larger Consolidation
We had found support at a parallel line from a respective channel that was seen by connecting highs on March 5 and Sept 17. Using that same lane's slope we created an identical one for the lower parallel.
Since forming a short-term bottom there we have retraced up to the .382 and found resistance at that level and are making our way down. This could be seen as the "h" pattern which often plagues bear markets. If this "h" breaks it's lows and breaks the brown support line then I believe you will have a nice 3.5% drop to make a slow risk short play on.
How did I get 3.5% for a target? Well, make a trendline from our tops Jan 26 & Sept 20. Copy/paste that same line at the lows of our consolidation pattern Feb 9 & April 2. I am looking for price action to break out of the brown flag and find support at the purple flag construct. There is no entry to be made through until the Oct 11 recent lows are broken at 270.38 and or our brown line is broken. Until then, the price can do whatever it wants while inside these flags, even testing the top of its resistance lines if it so chooses. If it would happen to get to the top of either the brown or the purple lines then those would also be good shorting setups.
Last week we found support at the daily 200 MA. Breaking this level would be very significant, we would then be living below it and finding resistance at the 200, around 276 currently.
I have included some arrows at levels that I feel are the safest places to short. A break of our current flag. A retrace up to our initial breakdown level of 286.37. Getting all the way up to a higher high within our flag pattern to create a third monthly divergence at 300. Or any break of the purple larger flag pattern.

S&P: Target hit, 1D Channel Up emerging. Long.TP = 2,807.75 hit while the index managed to keep the 0.618 1W Fibonacci level intact (2,703.50 on RSI = 46.971, MACD = 22.040), thereby successfully making a support level. 1D is now on Lower Highs trying to establish a Channel Up, which technically needs a Higher High above last week's 2,824.50 to be justified. 2,878.00 is the medium term target which should be accomplished half-way through November. Additional long opened with short-term TP = 2,820.

#SPX primary trend. Is this Bull run over?Every major bull run (primary trend), from '95 on, always anded with volumes peaking. Buying climax has run its course, now slighly favouring selling pressure.
While the summentioned setup can't be observed yet, it cannot be determined wheter it is developing already.

S&P: 0.618 Fib on 1M. Potential Support.The index aggressively crossed the 1W Channel Up to the downside last week (RSI = 36.642, MACD = -236.100, Highs/Lows = -527.9643, B/BP = -1241.7760) presenting the first such correction on S&P since March. I has however found support near the 0.618 Fibonacci retracement level on 1M (monthly). Also the Monthly Higher Low supporting line is just below, indicating that a strong support base and buying demand zone is present on a monthly basis (RSI = 45.274, MACD = 241.800). Our target in one month's time approximately is 2,878.00 with 2,807.75 the intermediate TP.

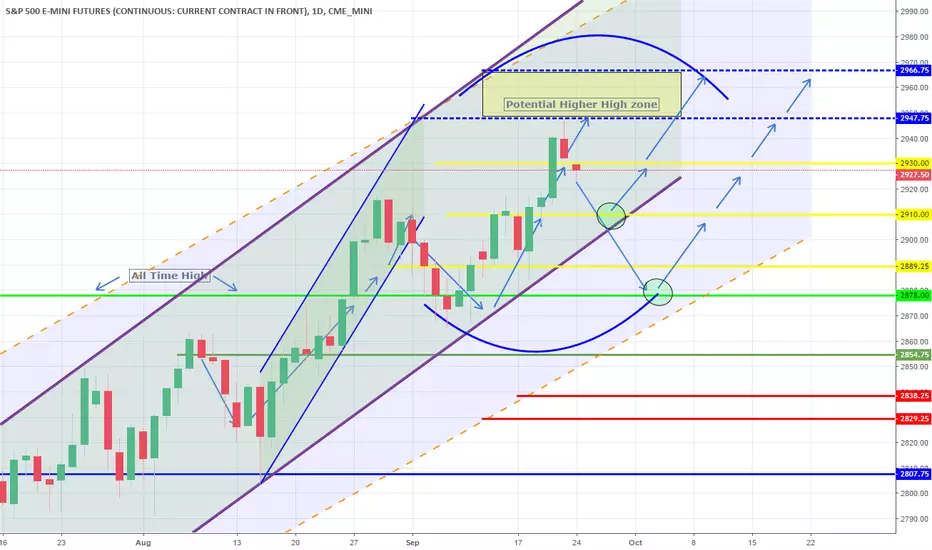
Higher Low on the 1W Channel Up made. Expecting a rebound.The index has completed a pull back on the long term 1W Channel Up (RSI = 59.796, MACD = 50.200, B/BP = 46.3920) by technically pricing its Higher Low (Highs/Lows = 0) near 2,875. The downside potential is limited. 1D should develop a new bullish leg/ Channel Up to test successively all the Resistance levels (2,910/ 2,930/ 2,947.75). Keep in mind that we have just entered the last economic quarter (Q4) of the year, where institutional investors take long positions for the end of the year rally. Our TP remains 2,960.

Pullback successful. New Higher High on sight.The 1D Channel Up (RSI = 64.273, MACD = 15.350, Highs/Lows = 11.000, B/BP = 26.8360) pulled back to the expected ~2,910 Higher Low and rebounded on a strong candle sequence. The uptrend is now strong on all levels (4H RSI = 61.057, Highs/Lows = 10.5536) and is moving towards at least a 2,947.75 ATH test with high chances of making a new Higher High near 2,966. Our TP remains 2,960. At the moment the 1W Channel Up, which signifies the long term bullish behavior of EURUSD, can potentially extend as high as 2,983.25 for a Higher High and is at the same time supported at 2,878.00 for a Higher Low (if printed we will add another long).

S&P UpdateCaution in the Market.
I had posted about the S&P before as it was approaching the previous high at 286.75.
It had been looking weak to me at the time... Now that we have broken that high many people would then be bullish at that point. But seeing the followthrough in the S&P has left much wanting.
We have also seen some erratic behavior from some of the bigger names in the market. This could be seen as a harbinger warning sign.
I erroneously called out bearish divergence before we printed a new high. Which, we have now printed and the divergence remains in the RSI.
The Yello lines outline the ascending wedge pattern that we have remained within since my last post. Yesterday we broke below this pattern and are now testing it as resistance. If we fall from 291.54 then we can assume that the resistance is tested and confirmed and we should see a slow breakdown to 286.77 which was the prior high.
If we get back within this pattern and blow through resistance then the pattern would still be intact. This could produce a little more short-term gains in the S&P. If I had to just throw out a number I would throw out 300 as a potential top, IF we confirm back within the falling wedge pattern. But falling wedge's typically broken to the downside.
Stochastic RSI. On the daily we are in the oversold area which points to some price support in the short term possibly. But much more importantly on the Weekly Stoch RSI we have the opposite. We have been living in the overbought range for an extended period for of time, which tells me that price is storing up negative energy ready to sell at any point in time. The S&P does move much slower than crypto so its hard to tell you when things will be moving but i will also preface that with I do believe that the two markets are quite correlated. If you are in the Stock market and see Bitcoin dump like a truck then I would suggest you get out your longs on the stocks.
I have a few channels that I have outlined from the historical price action. The blue lines and on the bigger channel we have the red lines.
My final confirmation of breakdown is breaking below and closing a daily candle from our past high at 286.97

Target hit. Expecting a minor pullback.TP = 2,930 hit as the 1D Channel Up (RSI = 63.529, MACD = 18.870, Highs/Lows = 16.9464) rose to a new Higher High that even extended as high as the lower layer of the 2,947.75 - 2,966.75 Potential Higher High zone. Ahead of Wednesday's Fed Rate Decision, the index is expected to pull back and rebound after the statement. The potential bounce points are 2,927 and the Higher Lows on 1D = 2,910 and 1W = 2,878. We have a long ready on each of those Higher Lows. Our current TP is 2,960.
1D Channel Up continuation. Long.S&P honored the 2,865 Higher Low made last week and the 1D Channel Up (RSI = 63.296, MACD = 13.170, Highs/Lows = 3.3571, B/BP = 23.3900) rebounded above 2,910, in pursuit of the ATH benchmark. We decided to close the 2,878 long at 2,910 and secure this position and leave only one for the ultimate TP = 2,930. The potential Higher High of both the 1D Channel Up and the 1W Channel Up (next cross point) remains 2,966.75. This is where the next pull back is expected.

Pull back on 1D completed. Medium term long.The 1D Channel Up (RSI @ 54.372, MACD @ 11.990, Highs/Low @ -4.3929, B/BP = -7.3080) eventually pulled back to 2,865 to form a Higher Low. As mentioned on last week's analysis we have made an additional long at 2,878 and if required we will enter a second (and last one) on 2,850, where the last support on 1D is located. This is a natural technical pull back on a 1W basis (last 1W candle closed at -0.94%) following August's strong finish (three straight bullish weeks). Our TP is 2,930.

Targets hit. Channel Up intact. Long term buy.TP = 2,889.25 and 2,910 both hit as the 4H Channel Up (RSI = 56.683, MACD = 5.780) made a new Higher High at 2,917.50. Having now formed a new Higher Low at 2,891.75 (Highs/Lows = 0), the index is ready to reach our final TP of this weekly bullish leg = 2,930. This upside move is further strengthened by the 1D Channel Up (RSI = 66.763, MACD = 25.330, Highs/Lows = 14.9107, B/BP = 32.9300) that is aiming for a Higher High at 2,947.75 while the 1W Channel Up maxes out at 2,966.75 (both cases will lead to a correction). In case they pull back earlier to form a Higher Low, we will use 2,878 and 2,850 as additional buy entries.

Target hit. New bull cycle initiated. Long.TP = 2,873 hit as the 4H Channel Up aggressively moved (RSI = 70.757, overbought STOCH, STOCHRSI, Williams, Ultimate Oscillator) towards and broke the 2,878 all time high spot. Having reached a Higher High on the 1D Channel Up (Highs/Lows = 21.7500), near exhausting the High space of the Rising Wedge (overbought STOCH, STOCHRSI, Williams), the index has now created a new bull cycle on a quarterly basis. Since the all time highs broke, our target is now 2,889.25, which if crossed will start the new bullish leg of September and we will continue buying with TP = 2,930.

Approaching ATH. Cautious buying.Following a new Higher Low at 2,803, the index resumed the uptrend, creating a smaller 1D Channel Up (RSI = 62.251, MACD = 16.360, Highs/Lows = 9.9821, B/BP = 28.5480) that is technically looking to test the All Time Highs. This is where our last target of this bullish run on S&P is, which will complete our estimated buying quarterly cycle. Due to the importance of this spot, we will downgrade our TP to 2,873. If the ATH break then the small Channel Up will seek a Higher High extension at 2,889.25, which if crossed will start the new bullish leg of September to 2,930. In a different case, they will first seek a Higher Low (2,829.25 - 2,838.25) before retesting the ATH again.

Bull Market Beat-down 2019.. Tickets on sale NOW!I hate to say it.. I really do- but the S&P 500 has drawn some unwanted attention, and word on the street- it's cruisin’ for a bruisin’. Ever since the new administration took office we’ve seen the US Stock Market riding high ‘without a jacker in sight’.. I mean who is to blame? With current conditions thriving, the market is finally doing its job of gaging the overall environment of the US Economy for the first time in 20 years. Nonetheless, this 10-year bull rally will certainly go down in history as one of the greatest moments of US prosperity (some would disagree) but like the saying goes- the higher the climb the harder the fall. I personally don't believe this is how it MUST go down... After all parachutes do exist, right? However, it seems the US of A and the rest of the developed nations of the world are failing to learn from their past mistakes, but instead take their economies into dangerous territories resulting in the most catastrophic boom-bust cycles. With that being said, It should go without saying the next beat-down that's coming isn’t going to be pretty, and it might give the economy more than just a black-eye... More details to come.

First support held. New Higher High ahead. Long.The 1D Channel Up (orange dotted parallel lines on RSI = 60.002, MACD = 15.140, Highs/Lows = 0.88036, B/BP = 28.2960) successfully tested its 1st potential rebound point at 2,791.75 as you can see on the first curve (blue). There is always a possibility to extend as low as 2,775 (2nd potential rebound point - second curve) and make a full Higher Low, but technically it has resumed the uptrend on 4H (Highs/Lows = 6.0357, ADX = 26.076) and should not look back. A new long has been added at 2,795 with TP = the 2,878.00 ATH, with the previous TP also intact = 2,854.75. An additional long will be added at 2,775 if needed.

1D Channel Up intact. Long.The 1D Channel Up is slowly (RSI = 60.850) but surely (MACD = 19.060, Highs/Lows = 19.3929, B/BP = 44.3660) rising towards the ATH (all time highs) at 2,878. In the meantime it may print a small pull back on the double curve pattern, but will only be a Higher Low and will be bought. As seen on the chart this curve pattern is recurring. Long, TP = 2,854.75.
