S&P500 Approaching its new long-term bottomOn our last week analysis for the S&P500 Index (SPX) we called for the start of the correction within this long-term Channel Up pattern:
As you see the timing was spot on and the price broke below both the middle of the Channel Up and the 4H MA200 (orange trend-line). Along with the 4H MA50 (blue trend-line), the latter is close to forming a Death Cross on the 4H time-frame, which is a bearish pattern. The last time this was formed was on December 19 2022 and it was the bottom (Higher Lows trend-line) of the pattern.
The 1D RSI is already reversing, though the 1D MACD shows there might still be a few days left before bottoming. On an R/R basis, the risk is low buying on the 4H Death Cross formation, and this is what we will do, getting the most optimal long-term buy entry. Our first target is the middle of the Channel Up (4050) and upon a 4H MA200 re-test as Support, the top (Higher Highs trend-line) of the Channel as an extension (4250).
-------------------------------------------------------------------------------
** Please LIKE 👍, FOLLOW ✅, SHARE 🙌 and COMMENT ✍ if you enjoy this idea! Also share your ideas and charts in the comments section below! **
-------------------------------------------------------------------------------
💸💸💸💸💸💸
👇 👇 👇 👇 👇 👇
Standardandpoors500

S&P500 Two buy entries for the long termThe S&P500 has been inside a Channel Up ever since the October 13th market bottom.
Even though it didn't make a proper Higher High in February, the recent correction is still contained inside the Channel Up.
The MA50 1D is holding. If the price makes a closing under it, the Rising Support assumes controls of the trend and becomes the prevailing pattern.
Trading Plan:
1. Buy now as long as the price is closing over the MA50 1D.
2. If it closes below, buy on the Rising Support.
Targets:
1. 4140 (under Resistance Zone A) and 4300 if the price closes above Resistance Zone A.
2. 4300 (representing a +11.35% rise from the Rising Support, which is a price range delivered in both previous rebounds on this Rising Support). Also under Resistance B.
Tips:
1. The MACD 1D shows that there is still room to fall before finding a Support, enhancing Scenario 2. Lower risk buy after it makes a Buy Cross.
Please like, follow and comment!!

S&P500 pulling back. Those are the levels to sell/ buy.The S&P500 index (SPX) is pulling back after making a medium-term top on February 02. This isn't yet a Higher High on the Channel Up that started on the October 13 market bottom but it is a Higher High on the Diverging Higher High (light blue) that started on November 03.
Keep in mind that the October Channel Up is what helped us take the accurate buy exactly on its bottom 3 weeks ago:
With the 1D MACD making a Bearish Cross, the last time it formed one was on December 05, straight after the Dec 01 Higher High. That fractal sell initially bounced off Support Zone 1 that was formed from the last Higher Low before the top and then after breaking below the 1D MA50 (blue trend-line), it rebounded just before hitting Support Zone 2 (formed by the first Higher Low of the sequence).
On the current price action, Support Zone 1 fits perfectly above the bottom of the October Channel Up, while Support Zone 2 is at the bottom of the November Diverging Channel Up. Of course the long-term confirmation would come after the 1D MACD makes a Bullish Cross but we will attempt one tight stop buy on Support Zone 1 and the last on Support Zone 2. In both cases we are targeting the 4195 Resistance and if broken the 4325 August 15 High.
-------------------------------------------------------------------------------
** Please LIKE 👍, FOLLOW ✅, SHARE 🙌 and COMMENT ✍ if you enjoy this idea! Also share your ideas and charts in the comments section below! **
-------------------------------------------------------------------------------
💸💸💸💸💸💸
👇 👇 👇 👇 👇 👇

S&P500 Has it bottomed beyond any doubt?Two weeks ago the S&P500 index (SPX) closed above its 1W MA50 (blue trend-line) for the first time since the week of April 04 2022. Last week it tested the 1W MA50 as a Support, successfully held it and rebounded. If it wasn't for the rejection just below the 1W MA100, we would talk about the perfect break-out.
Still however this is a nearly perfect recovery:
a) The dominant pattern was an Inverse Head and Shoulders (IH&S), which practically formed the bottom of the Bear Cycle, rebounding on the 1W MA200 (orange trend-line).
b) The 1W RSI started rising on Higher Lows, while the price was on Lower Lows, waving a huge bullish divergence.
Interestingly, we've seen the very same IH&S pattern and RSI Bullish Divergence during both of the last major Bear Cycles, the 2008/09 Housing Crisis and 2001/02 Dotcom crash. Common feature of those two is that after the index closed above the 1W MA50, it formed a Channel Up (green pattern) that led it straight to the 1W MA200. This time the 1W MA200 is a Support, but there is the Resistance of previous Lower High to consider. And that is at 4640. Valid target in our opinion by the end of Q3 if this Channel Up is materialized.
-------------------------------------------------------------------------------
** Please LIKE 👍, FOLLOW ✅, SHARE 🙌 and COMMENT ✍ if you enjoy this idea! Also share your ideas and charts in the comments section below! **
-------------------------------------------------------------------------------
💸💸💸💸💸💸
👇 👇 👇 👇 👇 👇

S&P500: Rejected on 2month Resistance.The S&P500 index got rejected on Friday marginally under the R1 Zone (4,100 - 4,140) and is pullig-back having turned the 4H time frame neutral (RSI = 54.304, MACD = 15.240, ADX = 18.708). As we discussed previously, we are following the December fractal for direction. There was a Double Top rejection on R1 during December and when it broke under the 4H MA200, the price visited the S1 Zone.
Consequently, a potential crossing under the 4H MA200 will be a bearish signal (TP = 3,800) and a crossing above 4,150 (R1 top) will be a bullish signal (TP = 4,330).
## If you like our free content follow our profile to get more daily ideas. ##
## Comments and likes are greatly appreciated. ##

S&P500 against VIX showing some bumpy road aheadThis is the S&P500 index (SPX) against the Volatility Index (VIX). We've charted VIX's Cycles since June 2020 where the bottoms are in essence alarms and signals to be on the look out to sell and take profits on stocks while the tops are buy signals to enter the market.
Based on that model, VIX appears to be entering the rising curve, meaning that a sell alarm is starting to ring. Given the fact that the price is approaching a Resistance level where it was rejected two times already, we may see a decent drop. If the drop isn't delivered and it was just the two day quick pull-back of January 18/19, then the Cycle pattern may start to invalidate the strong drops of the Bear Cycle and instead mimic the blue-print of the 2020 - 2021 small pull-backs. That would indicate that the Bear Cycle is over and that S&P500 has officially entered the new Bull Cycle.
-------------------------------------------------------------------------------
** Please LIKE 👍, FOLLOW ✅, SHARE 🙌 and COMMENT ✍ if you enjoy this idea! Also share your ideas and charts in the comments section below! **
-------------------------------------------------------------------------------
💸💸💸💸💸💸
👇 👇 👇 👇 👇 👇

S&P500 Last hurdle but forming a 1D Golden CrossThe S&P500 index (SPX) broke above the 1W MA50 (red trend-line) for the second time during the start of the Bear Cycle in January 2022 and the first after December 12 2022. For the past three days it is being rejected there, which makes it a strong Resistance, along with the 'Prior Lower High', which is the level we pointed out last week on our SPX report:
As you see the price followed the buy call at the bottom of the Channel Up flawlessly but now faces the 'Prior Lower High'. Until it breaks it, we are good to sell with a tight SL targeting the 1D MA50 (blue trend-line). That trend-line just hit the 1D MA200 (orange trend-line) and are about to form the first 1D Golden Cross since July 09 2020. As a result, we are bullish long-term, targeting the Resistance Zone and if 4145 breaks, the August 16 2022 High at 4325.
We will only short-term sell if the index closes below the Channel Up and target 3800 (top of Support Zone 1) and if 3760 breaks target 3710 (top of Support Zone 2).
-------------------------------------------------------------------------------
** Please LIKE 👍, FOLLOW ✅, SHARE 🙌 and COMMENT ✍ if you enjoy this idea! Also share your ideas and charts in the comments section below! **
-------------------------------------------------------------------------------
💸💸💸💸💸💸
👇 👇 👇 👇 👇 👇

S&P500 Following 100% the plan. Now pricing a bottom.The S&P500 index followed our last projection we made on January 04 as after it held the Higher Lows of the October Channel Up, it rose substantially and got rejected on the Bear Cycle's Lower Highs trend-line (January 04 2022 trend-line):
This happened because it failed to close a 1D candle above this huge Bear Cycle Resistance, same it did on December 01 and December 13. This time however the 1D MACD shows that we are closer to the new long-term bottom than ever as it follows the October Bullish Cross to Bearish Cross sequence on a tight time-window. Adding the fact that again the price is near the bottom (Higher Lows) of the Channel Up, we see a hold here more likely and immediate retest of the Bear Cycle's Lower Highs.
As mentioned in previous publications, we ideally want to see SPX close above the 1W MA50 (red trend-line), something it failed to do on the December 13 rejection. In that case, we will buy with a short-term target the top of the Resistance Zone (4140). For long-term buying we need to see the index close above the middle of the Channel Up.
On the other hand, if we close a candle below the Channel Up first, we will instead sell and target on the short-term the top of Support Zone 1 (3800) and under conditions that we will analyze if the bearish scenario prevails, the top of Support Zone 2 (3705).
-------------------------------------------------------------------------------
** Please LIKE 👍, FOLLOW ✅, SHARE 🙌 and COMMENT ✍ if you enjoy this idea! Also share your ideas and charts in the comments section below! **
-------------------------------------------------------------------------------
💸💸💸💸💸💸
👇 👇 👇 👇 👇 👇

S&P500 may be on the verge of a mega rally based on the US02YThe chart represents the US02Y on the 1W time-frame against the S&P500 index (green trend-line). The phase that the US02Y has entered is similar to that in entered in December 1994. As you see shortly after a Golden Cross, it made a Lower High on the RSI, flashing a Bearish Divergence, while the MACD Double Topped. This is exactly the same sequence of events in the exact same order since the June 2022 Golden Cross.
The US02Y fall of December 1994 practically started S&P's mega rally of mid-late 90s that led to the 2000 Dotcom Bubble. If history is repeated, instead of a continuation of the Bear Market that most expect, S&P500 my be on the verge of a new multi-year Bull Cycle.
-------------------------------------------------------------------------------
** Please LIKE 👍, FOLLOW ✅, SHARE 🙌 and COMMENT ✍ if you enjoy this idea! Also share your ideas and charts in the comments section below! **
-------------------------------------------------------------------------------
💸💸💸💸💸💸
👇 👇 👇 👇 👇 👇

S&P500 Approaching the most important Bull levelThe S&P500 index (SPX) eventually held the bottom (Higher Lows trend-line) of the October Channel Up, as we outlined on our December 29 idea, and it testing today yet again the Lower Highs trend-line since January 04 2022:
That level has only broken once on the December 13 fake-out, same with the 1W MA50 (red trend-line), which is trending parallel to it. With the 4H MA50 and 4H MA200 (blue and orange trend-lines respectively) about to form a Golden Cross, the likelihood of a bullish break-out above the 1W MA50 becomes greater. However, it needs to break above the 4055 Prior Lower High level, which is something it failed to do in September, in order to confirm the extension of the uptrend.
Above that level, we will short-term target the Resistance Zone but only above the 4145 top can we expect a Channel Up Higher High at 4300. On the other hand, a 1D candle closing below the bottom (Higher Lows trend-line) of the Channel Up, would target the 3700 Support Zone.
-------------------------------------------------------------------------------
** Please LIKE 👍, FOLLOW ✅, SHARE 🙌 and COMMENT ✍ if you enjoy this idea! Also share your ideas and charts in the comments section below! **
-------------------------------------------------------------------------------
💸💸💸💸💸💸
👇 👇 👇 👇 👇 👇

S&P500: Near the top of the Bear Market ResistanceThe S&P500 is under high volatility at the moment after the CPI report matched the forecast (6.5%). The index is trading inside a Channel Up, above both the 4H MA200 and 4H MA50, with the two close to forming a Golden Cross. With most 4H technicals overbought (RSI = 70.997, MACD = 30.350, ADX = 39.740) and the price approaching the Lower Highs Resistance that is in place for a whole year (only had the fake-out break on December 13th), the index is increasing turning into a sell opportunity.
Below the Channel Up and the 4H MA200, it is a short-term short to Fibonacci 0.618 (3,870). Validated/ confirmed buying at this point is only above the 1W MA50. From a fundamental perspective, it is the continuous drop on the US10Y, that is favoring capital going to riskier assets like stock. Keep an eye for a possible low there and reversal, for validation of the sell thesis on S&P500. But if bond yields continue to fall, the equity rally will be extended and a weekly close above the 1W MA50 should set S&P500 back into the new Bull Cycle.
## If you like our free content follow our profile to get more daily ideas. ##
## Comments and likes are greatly appreciated. ##
## Also DONATIONS through TradingView coins help our cause of increasing the daily ideas put here for free and reach out more traders like you. ##

S&P500 Can this divergence from 2008 and 2001 save the day?The S&P500 index (SPX) has been trading within a Channel Up as we showed on our last analysis, struggling to break above its 1D MA50:
On the current analysis, we switch back to the longer-term dynamics and compare the 2022/23 correction (so far) to the previous Bear Cycles of 2008/09 and 2001/02, using the parameters of Inflation (red trend-line) and WTI Oil (black trend-line).
At the moment, the S&P500 is above its 1W MA200 (orange trend-line) with the 1W RSI on Higher Lows, within an Ascending Triangle pattern since the May 16 Low. This can make all the difference during the current inflation crisis. The reason is that this pattern is different from the 1W RSI Higher Lows within a Falling Wedge of 2008/09 and just the Lower Highs of 2001/02.
As you see in 2008, the index was supported on the 1W MA200 as well and posted a counter-trend rally before eventually breaking it, and the break below the 1W MA300 (yellow trend-line), practically opened the way for the more violent second part of the Bear Cycle. Same with 2001 where however the 1W MA200 didn't have as a significant role.
Inflation in all cases started to drop significantly after the Bear Cycle started, Oil seems to precede/ lead this fall, and (Oil's) current structure looks more like that (bottom fractal) of January 2009 and January 2002. Mere coincidence that we are now in January 2022?
Right now both the 1W RSI structure as well as the candles are different than before, being evidently slightly more bullish (so far). Can this RSI bullish divergence be enough to keep S&P500 above the 1W MA200 and start to rise to its first Higher High, effectively invalidating the Bear Cycle or history will repeat itself with another violent break below the 1W MA300?
-------------------------------------------------------------------------------
** Please LIKE 👍, FOLLOW ✅, SHARE 🙌 and COMMENT ✍ if you enjoy this idea! Also share your ideas and charts in the comments section below! **
-------------------------------------------------------------------------------
💸💸💸💸💸💸
👇 👇 👇 👇 👇 👇

S&P500: Bearish but the 1D MA50 can reverse the courseThe S&P500 index has been trading within a Channel Down pattern on the 1D time-frame ever since the December 1st rejection on the Lower Highs Resistance (Jan 4th) and the Dec 13th rejection on the 1W MA50.
With the 1D technicals neutral (RSI = 50.198, MACD = -15.660, ADX = 19.596), this is technically the level to sell as the price is at the top of the Channel Down. As long as it holds, our target is 3,710, which is marginally above the 3,695 Support of the Nov 3rd 2022 low.
A break above the 1D MA50 reverses the bearish trend and we'll target the 1D MA200 and the Lower Highs (Jan 4th) Resistance again. This scenario is supported by the Higher High (HH) on the 1D RSI (which is a bullish divergence also seen in early October and May 2022) and the 1D MACD which just formed a Bullish Cross, also consistent with the aforementioned market Lows.
Closing a candle above the 1W MA50 would restore the long-term bullish trend and we will take that break-out to target the 4,330 Resistance (Aug 16th 2022 High).
## If you like our free content follow our profile to get more daily ideas. ##
## Comments and likes are greatly appreciated. ##
## Also DONATIONS through TradingView coins help our cause of increasing the daily ideas put here for free and reach out more traders like you. ##

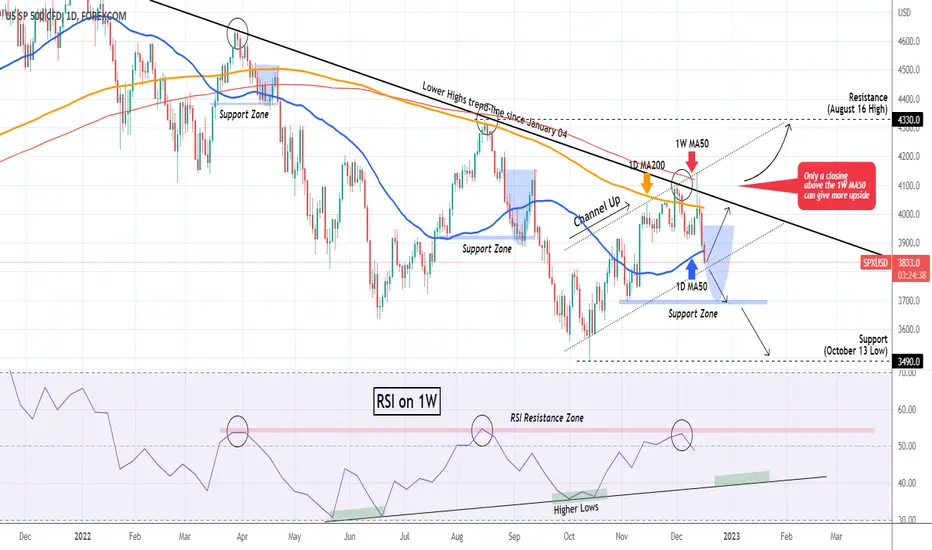
S&P500 Crunch time, either holds or the Bear Market continuesThe S&P500 index (SPX) has has two major rejections since December 13, as despite breaking (only intra-day) above the Lower Highs trend-line since January 04, it got rejected marginally above the 1W MA50 (red trend-line) and the next day on the 1D MA200 (orange trend-line). That is a double failure to break-out and considering that the 1W MA50 had the precious Lower High rejection on August 16, this is far from ideal for buyers.
On top of that, the RSI on the 1W time-frame got rejected on the Resistance Zone that formed the last two Lower Highs and is holding since March 28. As a result, with the price breaking today below the 1D MA50 (blue trend-line) for the first time in over a month (since November 10), we are ahead of critical crossroads.
Either it holds and keeps 1D candles closing inside the Channel Up (dotted lines) that started on the October 13 Low or it breaks below and repeats the patterns of the April/ May and August/ September sell-offs. As you see those sell sequences have very distinct structures. A break below the Channel Up should test the Support Zone below where we could see a temporary rebound back above the 1D MA50 towards the 1D MA200, in a Cup formation. A closing below the Support Zone, confirms going for the October Low.
In the case that the Channel Up holds and closes all candles inside it, a rebound is still limited to the January 04 Lower Highs trend-line. In order to resume buying, we need to see a candle closing above the 1W MA50, unlike December 13. In that case we can see the index test the 4330 (August 16 High) Resistance by March.
At this point, it is worth noting that the 1W RSI has also a clear Higher Lows trend-line that caught the previous market Lows and in fact is a Bullish Divergence. Keep an eye on that as a bounce on that Higher Lows trend-line can again give us the new Low and if it indicates indeed a long-term Bullish Divergence, this time it may be a Higher Low on the index as well.
-------------------------------------------------------------------------------
You may also TELL ME 🙋♀️🙋♂️ in the comments section which symbol you want me to analyze next and on which time-frame. The one with the most posts will be published tomorrow! 👏🎁
-------------------------------------------------------------------------------
💸💸💸💸💸💸
👇 👇 👇 👇 👇 👇
S&P500 rebounding on the 4H MA200 and Channel Up bottom?The S&P500 index (SPX) is rebounding today after making a Double Test of the 4H MA200 (orange trend-line). This is just over the Channel Up pattern's bottom (Higher Lows trend-line).
The sequence resembles the November 04 - 10 Higher Lows fractal (also based on the 4H MACD) and what happened then was an instant rise to the top (Higher Highs trend-line) of the Channel Up.
This time, especially ahead of Tuesday's CPI and Wednesday's Fed Rate Decision, the index is limited first to the 4H MA50 (blue trend-line) and then obviously the Lower Highs trend-line that has been holding (and forming all of the 2022 High rejections) since January 04. Notice that on the (red) 4090 - 4100 Resistance Zone, we also have the 1W MA50 (red trend-line), the last major MA standing.
As a result if the price breaks above the 4H MA50, we can take the bullish break-out signal and target just below this highly important Resistance cluster at 4080. A break above the 1W MA50 can be used as a buy continuation signal and target the top of the Channel Up (4170 - 4190) short-term. On the other hand, a closing below the 1D MA50 (green trend-line), which is the medium-term Support, will be taken as a bearish break-out signal targeting the 3700 Support Zone.
-------------------------------------------------------------------------------
** Please LIKE 👍, SUBSCRIBE ✅, SHARE 🙌 and COMMENT ✍ if you enjoy this idea! Also share your ideas and charts in the comments section below! This is best way to keep it relevant, support me, keep the content here free and allow the idea to reach as many people as possible. **
-------------------------------------------------------------------------------
You may also TELL ME 🙋♀️🙋♂️ in the comments section which symbol you want me to analyze next and on which time-frame. The one with the most posts will be published tomorrow! 👏🎁
-------------------------------------------------------------------------------
💸💸💸💸💸💸
👇 👇 👇 👇 👇 👇

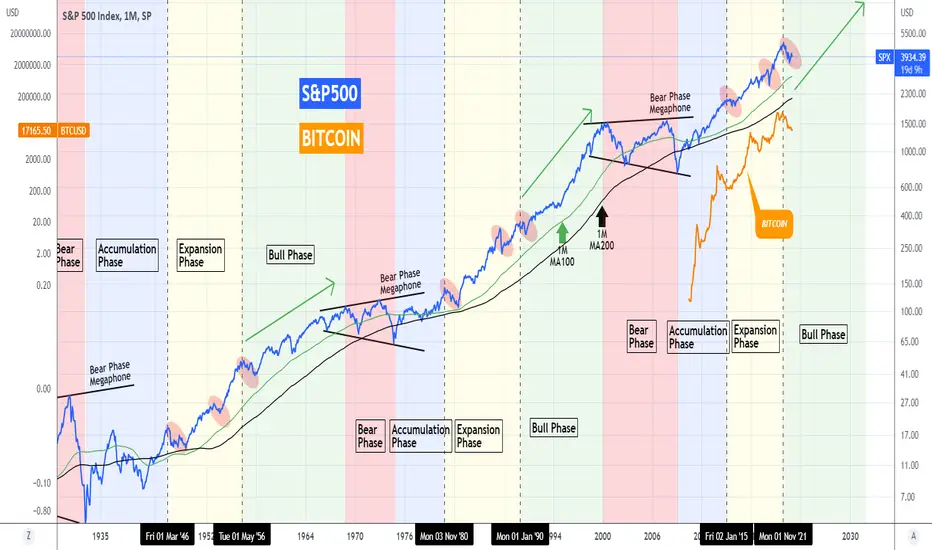
BITCOIN and S&P500 Has a 10 year Bull phase just started?A 1 year correction which is nothing but common throughout Bitcoin's (BTCUSD) existence, has done its work well in spreading fear and doubt at the market during this inflationary stock crisis in 2022. In times like this what helps the most is to maintain a long-term perspective and look at how history reacted in similar situations.
We thought that nothing can help us get a better grasp at the situation than look into how Bitcoin compares to the major stock index the S&P500 (SPX). On this 1M time-frame, Bitcoin is displayed by the orange trend-line while the S&P500 by the blue. We are looking into the S&P500's price action since the Great Depression. As you see the index repeats through history four major phases:
* The Bear Phase (red), where the index gets into a Megaphone pattern and has two major correction sequences. It breaks initially below the 1M MA100 (green trend-line) and then below the 1M MA200 (black trend-line).
* The Accumulation Phase (blue), where the index starts recovering from the Bear Phase and breaks above both the 1M MA100 and MA200, turning sideways. This is technically the most efficient/ earliest available level to enter the market.
* The Expansion Phase (yellow), where the index established trading above the 1M MA100/200 (never breaks them until the next Bear Phase) and makes the first multi-year rise. This Phase is marked by three "smaller" correction periods (red ellipses).
* The Bull Phase (green), where the index recovers from the last small correction and rises aggressively to form the top before the new Bear Phase. It tends to last around 10 years.
This year's correction (2022) is the third one of the Expansion Phase and as the price remains above the 1M MA100, it is more likely that with the correction already completed, S&P500 has entered its new Bull Phase.
The chart clearly shows that Bitcoin's 12 year period of immense growth has only been during the S&P500's Accumulation and Expansion Phases. This suggests that we may haven't seen yet it's strongest growth to come during the stock market's new Bull Phase! The correlation of Bitcoin's tops and bottoms to those of the S&P500 is more than obvious.
Most market participants say that this time is different due to the soaring inflation and aggressive rate hikes. But hasn't this also been the narrative in the late 70s? Still the market found the mechanisms to grow in the Expansion Phase that followed and the new technologies (internet etc) to inflate it to immense highs in the 90s until the eventual crashes of the 00s. It may seem like a different reason each time but the behavior is always cyclical with repeating patterns and phases, the narrative in the past 100 years can be whatever the news decide it to be. But the market will continue printing and printing the same patterns as human behavior stays the same.
So what do you think, are we about to witness the growth of a lifetime on both Bitcoin and stocks in the next 10 years? Feel free to let me know in the comments section below!
-------------------------------------------------------------------------------
** Please LIKE 👍, SUBSCRIBE ✅, SHARE 🙌 and COMMENT ✍ if you enjoy this idea! Also share your ideas and charts in the comments section below! This is best way to keep it relevant, support me, keep the content here free and allow the idea to reach as many people as possible. **
-------------------------------------------------------------------------------
You may also TELL ME 🙋♀️🙋♂️ in the comments section which symbol you want me to analyze next and on which time-frame. The one with the most posts will be published tomorrow! 👏🎁
-------------------------------------------------------------------------------
💸💸💸💸💸💸
👇 👇 👇 👇 👇 👇
S&P500 One last round of pain before the Bull Cycle?The S&P500 index (SPX) closed the worst week since October on a not so encouraging note as the failed to break and got rejected on the 1W MA50 (blue trend-line). A simple comparison with the major corrections of 2002/03, 1982/83 and 1962/63 shows that as long as the index remains below the 1W MA50, the Bear Cycle is in effect.
A common characteristic among all 4 sequences is that the 1W RSI is on Higher Lows while the index (with the exception of 1962/63) is on Lower Lows, i.e. a Bullish Divergence.
The exception of 1962/63 is the most optimistic one as after a mont of sideways price action on the 1W MA50 (green circle), the index eventually rose aggressively and recovered the High.
The 1982/83 period is the most pessimistic as while the RSI made one last (3rd) Higher Low, the S&P500 made a Lower Low (red circle) before rebounding above the 1W MA50 and into the new Bull Cycle.
The 2002/03 sequence is a neutral one as the index did get rejected on the 1W MA50 one last time but made a Higher Low (blue circle) and broke above the 1W MA50 1.5 month later.
Which of the three scenarios do you think will prevail this time?
-------------------------------------------------------------------------------
** Please LIKE 👍, SUBSCRIBE ✅, SHARE 🙌 and COMMENT ✍ if you enjoy this idea! Also share your ideas and charts in the comments section below! This is best way to keep it relevant, support me, keep the content here free and allow the idea to reach as many people as possible. **
-------------------------------------------------------------------------------
You may also TELL ME 🙋♀️🙋♂️ in the comments section which symbol you want me to analyze next and on which time-frame. The one with the most posts will be published tomorrow! 👏🎁
-------------------------------------------------------------------------------
💸💸💸💸💸💸
👇 👇 👇 👇 👇 👇

S&P500 Best medium-term Buy Signal but bearish if this breaks.The S&P500 hit today the 3915 Support level that was formed on the November 17 Low. This also hit the bottom (Higher Lows trend-line) of the Channel Up that started on the October 13 market low. Technically this is the most optimal buy level on the medium-term, which should test first the 4H MA50 (green trend-line) and then the Lower Highs trend-line since the start of the year, where the index got rejected on December 01.
That rejection however is far from ideal as it is the trend-line where the previous three sell-off started on the long-term. The signal that makes it even more bearish is the 1D MACD which formed a Bearish Cross.
As a result, if the price closes below the 3915/ Channel Up Support cluster, we'll have a sell signal, targeting the 1D MA50 (blue trend-line) on the short-term. Closing below it, should kick-start an even bigger correction to at least the 1W MA200 (grey trend-line).
-------------------------------------------------------------------------------
You may also TELL ME 🙋♀️🙋♂️ in the comments section which symbol you want me to analyze next and on which time-frame. The one with the most posts will be published tomorrow! 👏🎁
-------------------------------------------------------------------------------
💸💸💸💸💸💸
👇 👇 👇 👇 👇 👇

S&P500 Will Dow's Golden Cross be a life saver for S&P?The S&P500 got rejected just above the 1D MA200 on the Lower Highs Resistance holding since Jan 2022. Contrary to that, Dow Jones not only has broken above its Lower Highs Resistance since Nov 10th but also made a Higher High above the August High, before getting rejected.
With a Golden Cross emerging on the 1D chart, Dow has high chances of bouncing on the former (Lower Highs) Resistance and establish it as a Support. This can be just whar the S&P500 needs to kick start its rally that breaks above almost a full year of Lower Highs.
Will it succeed?
Follow us, like the idea and leave a comment below!!

S&P500 Everyone watches this Resistance but nobody notices this!The S&P500 index broke last week above its 1D MA200 (orange trend-line) for the first time since April 21 but so far has failed to touch the 1W MA50 (red trend-line), getting rejected once again on the Lower Highs Zone (red) since the All Time High (ATH) of January 04 2022. That is the (obvious) Resistance that everyone is paying attention too but nobody seems to be noticing the support pattern that may change S&P's fortunes around.
That is, as you see on the chart, the curved Support Zone (dashed) that is connecting all the Lower Lows since December 2021 and provided all counter-trend rallies so far. A rejection now on the ATH Resistance Zone, can pull the price back to the 1D MA50 (blue trend-line) and below towards this curved Support. A bounce there, confirms the pattern and would make the first Higher Low since December 03 2021! If it breaks though, we do expect the 3490 Low to be tested, even for S&P500 to move to a Lower Low and extend the Bear Cycle.
If the price reverses now though and neutralize Thursday's rejection by breaking above the ATH Lower Highs trend-line, we think that the 1W MA50 still won't be enough. Ideally we would like to see a break above the 0.786 Fibonacci retracement level (4150), in order to call for a confirmed bullish break-out. The reason is simple. In the previous two counter-trend rallies/ rebounds of this Bear Cycle, the rebound never broke about the 0.786 Fib, not on the March 29 Lower High and neither on the August 16 Lower High. A break now, would make us turn bullish targeting the 4330 Resistance 1 (August 16 High).
A main reason we give more probabilities to a bullish break-out now, even though we've honored this Lower Highs zone with our previous analyses in 2022, is that the RSI on the 1W time-frame is flashing a huge Bullish Divergence, being on Higher Lows since May 23 while in the same period the price action has been on Lower Lows.
-------------------------------------------------------------------------------
** Please LIKE 👍, SUBSCRIBE ✅, SHARE 🙌 and COMMENT ✍ if you enjoy this idea! Also share your ideas and charts in the comments section below! This is best way to keep it relevant, support me, keep the content here free and allow the idea to reach as many people as possible. **
-------------------------------------------------------------------------------
You may also TELL ME 🙋♀️🙋♂️ in the comments section which symbol you want me to analyze next and on which time-frame. The one with the most posts will be published tomorrow! 👏🎁
-------------------------------------------------------------------------------
💸💸💸💸💸💸
👇 👇 👇 👇 👇 👇

S&P500 and VIX Cycles say rally more likely from now onOn this 1W time-frame we look into the S&P500 index (SPX) and the Volatility Index (VIX) since 1990. We've used the Sine Waves on an (approximately) VIX bottom-to-bottom basis in order to identify what the S&P500 normally does at this part of the Cycle.
As you see from the current point and until VIX Cycle's next bottom (blue zone), the S&P500 in a total of three occasions, it has been on a Rally twice and the other time January 28 2022 - February 07 2005, it was on its way to the final drop of the Dotcom Bear Market, lasting 35 weeks and then a strong Rally followed.
If the above is anything to follow then the S&P500 has more probabilities of rising consistently for the rest of this part of VIX's Cycle and if the case is like 2002, then drop for the next 35 weeks and the rally aggressively.
Which scenario do you think is more likely?
-------------------------------------------------------------------------------
** Please LIKE 👍, SUBSCRIBE ✅, SHARE 🙌 and COMMENT ✍ if you enjoy this idea! Also share your ideas and charts in the comments section below! This is best way to keep it relevant, support me, keep the content here free and allow the idea to reach as many people as possible. **
-------------------------------------------------------------------------------
You may also TELL ME 🙋♀️🙋♂️ in the comments section which symbol you want me to analyze next and on which time-frame. The one with the most posts will be published tomorrow! 👏🎁
-------------------------------------------------------------------------------
👇 👇 👇 👇 👇 👇
💸💸💸💸💸💸
👇 👇 👇 👇 👇 👇

S&P500: Still in Bull Market. This is a buy opportunity.It is always best to keep a long term perspective when investing. Despite being in a correction throughout the whole 2022, the S&P500 index has been giving some very important signs that it has hit a major support level and that it remains within the boundaries of a Bull Market.
To begin with, the index has been trading within a Channel Up (log scale) since March 2009 (the bottom of the previous recession). This chart shows that it has been holding very well up until it broke upwards to the 1.236 Fibonacci level on April 2021 as the market was loaded with trillions of newly issued USD. This caused the index to turn overbought. On the long term, we can view this as a much needed technical correction from an overbought state.
First and foremost, the 2022 correction hit on September, held on October and is rebounding now on the 1M MA50 (blue). This has been the long term support for S&P500 on December 2018 and February 2016, i.e. the Channel's two major corrections before COVID took the market by surprise on March 2020 down to the 1M MA100 (green), which triumphantly supported and caused a massive rebound.
So far the index shows that this is a technical correction within a Bull Cycle. Only if S&P500 closes a month below the 1M MA50, can we expect to visit the 1M MA100 again. And in turn if this breaks as well, which would mean a break below the Channel Up, visit the 1M MA200 (orange), which last held on October 2011. That would push S&P500 into Bear Market zone.
## If you like our free content follow our profile to get more daily ideas. ##
## Comments and likes are greatly appreciated. ##
## Also DONATIONS through TradingView coins help our cause of increasing the daily ideas put here for free and reach out more traders like you. ##

S&P500 Close to the most critical test of the Bear Market.The S&P500 index (SPX) broke last week above the August 16 Lower Highs trend-line, following the impressive drop on October's CPI and has almost fulfilled our +5.18% bullish projection of 4040:
The price is now approaching the all important 1D MA200 (orange trend-line) which rejected the price and form the last top on the 2022 Lower Highs trend-line on August 16. A break above it would be the first since April 21 and undoubtedly, the first sign towards a long-term bullish break-out into a recovery from this Bear Market.
Technically the January 04 Lower Highs trend-line is a little higher than the 1D MA200, exactly where the 1W MA50 (red trend-line) is, so we can set a tolerance level there. A break above it, we'll take as a bullish break-out buy and target 4328 (Resistance 2).
If the index is yet again rejected within this 1D MA200 - 1W MA50 Resistance Zone, then it remains (until further notice) within the Bear Cycle but the downtrend would be confirmed by a break below the 1D MA50 (blue trend-line), which will initially target the 3643 Support (1). Note that the 4H MA50 (green trend-line) has been technically the best place to buy these Bear Market rallies on their latest stages.
-------------------------------------------------------------------------------
** Please LIKE 👍, SUBSCRIBE ✅, SHARE 🙌 and COMMENT ✍ if you enjoy this idea! Also share your ideas and charts in the comments section below! This is best way to keep it relevant, support me, keep the content here free and allow the idea to reach as many people as possible. **
-------------------------------------------------------------------------------
You may also TELL ME 🙋♀️🙋♂️ in the comments section which symbol you want me to analyze next and on which time-frame. The one with the most posts will be published tomorrow! 👏🎁
-------------------------------------------------------------------------------
👇 👇 👇 👇 👇 👇
💸💸💸💸💸💸
👇 👇 👇 👇 👇 👇
