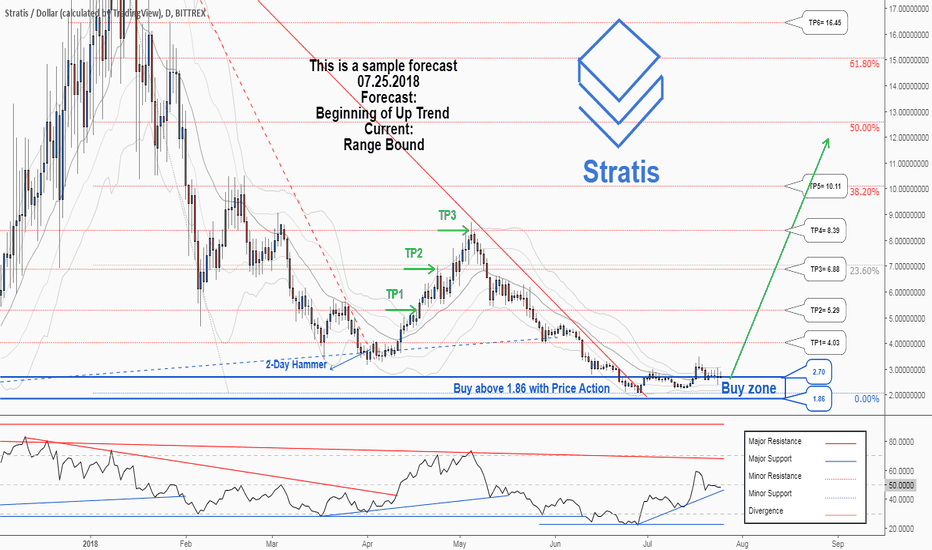
There is a possibility for the beginning of uptrend in STRATUSDTechnical analysis:
. STRATIS/DOLLAR is in a range bound and the beginning of uptrend is expected.
. The price is below the 21-Day WEMA which acts as a dynamic resistance.
. The RSI is at 49.
Trading suggestion:
. The price is in the support zone (2.70 to 1.86), traders can set orders based on Daily-Trading-Opportunities and expect to reach short-term targets.
Beginning of entry zone (2.70)
Ending of entry zone (1.86)
Entry signal:
Signal to enter the market occurs when the price comes to "Buy zone" then forms one of the reversal patterns, whether "Bullish Engulfing" , "Hammer" or "Valley" in other words,
NO entry signal when the price comes to the zone BUT after any of the reversal patterns is formed in the zone.
To learn more about "Entry signal" and the special version of our "Price Action" strategy FOLLOW our lessons:
Take Profits:
TP1= @ 4.03
TP2= @ 5.29
TP3= @ 6.88
TP4= @ 8.39
TP5= @ 10.11
TP6= @ 16.45
TP7= @ 23.12
TP8= Free
Statis
$STAT fractals idea in case $BTC continues downtrendJust an ideia based on fractals. Stratis is usually a good teller for overall market moves. My expectation is that maybe accumulation phase will be quicker than before. Maybe alt season starts already early June or even late May.
Regards,
Crypto Pilot
Stratis daily showing to be in consolidation since march 7 Stratis is gearing up and uppin momentum to enter this next bull season. TA is showing bear bottom is done with and bulls soon to take over a strong in this next upcoming season. Trade the support/resistance line. Good buy right now on the support line 52 53 Sats.
Deez Nuts
Stratis VS Bitcoin Still Strong?After breaking above the previous resistance at 88k satoshi and the 200 Moving Average, suddenly Stratis is looking strong against the Bitcoin. Following the break above the resistance, STRAT/BTC went down and re-tested the 88k satoshi support, which in fact has been rejected.
The potential of the Stratis is definitely there and its quite likely that it will continue rising. The nearest resistance is at 125k satoshi, where 61.8% Fibonacci retracement is located. Then 144k and finally 160k resistance. Break above 160k satoshi could establish a longer-term uptrend although it is yet to see how price will react on each of the resistance. Break below the 200 Moving Average should invalidate bullish outlook.


