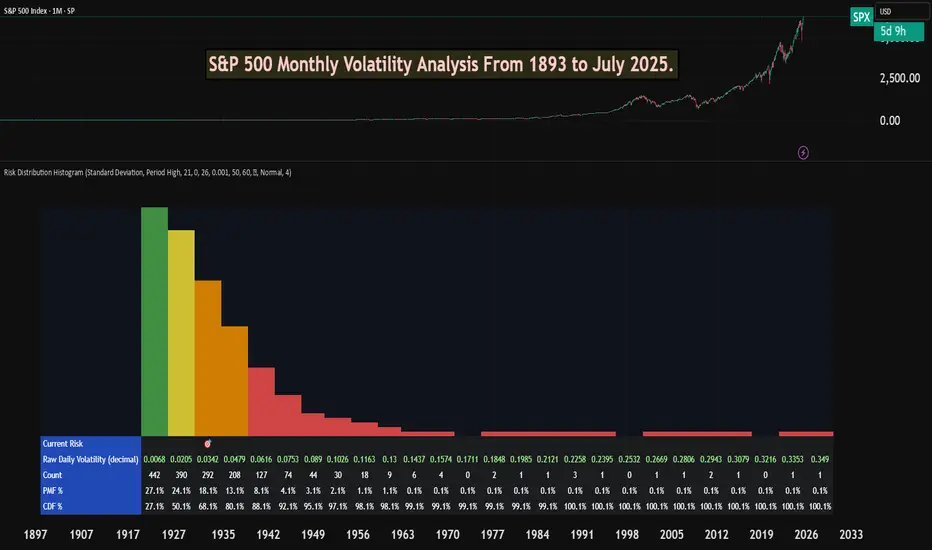
S&P 500 Monthly Volatility Analysis From 1893 to July 2025Most of the time, the S&P 500 is seen as a low-volatility index when compared to most individual stocks, small-cap indexes, or indexes from other countries.
However, most investors don't know exactly what volatility to expect from a statistical perspective.
The Risk Distribution Histogram allows us to understand exactly how risk is distributed.
S&P 500 Statistical Risk Distribution
Here are some highlights from what we get from the analysis. Some of this data might actually surprise investors. The data is monthly:
27% of all months have volatility under 0.68%
80% of all months' volatility was under 4.79%
5% of all months had a volatility of over 7%
If we can call a volatility over 25% a severe crash or "grey" swan, we had 7 of those events
3 months with extreme volatility over 30%
This allows us to understand tail risk and plan ahead. While most times the S&P 500 is in the low volatility zone, extreme events can happen.
What can we learn from this?
Prepare for rare but possible high-volatility events.
Understand the 80/20 rule. Most months are very low volatility, but 20% of them will have a volatility higher than 5% approximately.
Avoid overconfidence in stability
Plan for long-term horizons. High volatility tends to "dissipate" in the long term.
This is why it's important not to discard rare high-volatility events, especially when the investor is in need of liquidity.
This risk analysis can be done for any ticker.
Statisticalanalysis
Statistically Probable that Bitcoin Has Not ToppedBitcoin: No Statistical Evidence of a Top Yet 🚀
Based on the analysis using statistical extremes, there is no confirmation that Bitcoin has reached a market top at this time. This indicator is designed to identify historically extreme conditions, signaling when price action is statistically overextended.
🔍 Key Observation:
Unlike previous cycle tops, where extreme readings were clearly registered, the current market environment has not yet reached those levels. This suggests that Bitcoin may still have room to run before hitting an exhaustion point.
📊 What This Means for Traders & Investors:
✅ Momentum Still Intact – No statistical evidence of a peak.
✅ Potential for Further Upside – Historically, markets tend to top only after hitting extreme conditions.
✅ Caution & Confirmation Needed – While no extreme has been detected, market conditions can change, and risk management remains essential.
⚠️ Disclaimer: This is not financial advice. Historical probabilities do not guarantee future results. Always conduct your own research before making trading decisions.
What do you think? Could Bitcoin be headed higher? Let’s discuss! 👇 🚀

Does a strong ADP number lead to a decent NFP print? Given the decent ADP report just delivered ahead of Friday's NFP figures, I'm curious to see whether the direction of ADP can be an indicator of what to expect on the headline Nonfarm growth figure. Armed with another spreadsheet, I take a look.
Matt Simpson, Market Analyst at City Index and Forex.com
