Steem | Gartley and about to break resistance for upto 896% moveHi dear friends, hope you are well and welcome to the new trade setup of Steem coin.
The last biggest harmonic move Steem formed back in Mar 2020, which I shared as below:
Now on a monthly time frame, Steem has again formed another big harmonic move, and this time it is a bullish Gartley:
On a daily time frame, Steem is also about to break down trendline resistance as well.
Note: Above idea is for educational purpose only. It is advised to diversify and strictly follow the stop loss, and don't get stuck with trade
Steemdollar

Steem coin formed huge bullish Gartley | upto 896% massive moveHi dear friends, hope you are well and welcome to the new trade setup of Steem coin.
The last biggest harmonic move Steem formed back in Mar 2020, which I shared as below:
Now on a monthly time frame, Steem has again formed another big harmonic move, and this time it is a bullish Gartley:
Note: Above idea is for educational purpose only. It is advised to diversify and strictly follow the stop loss, and don't get stuck with trade

STEEMUSD Spiral TargetUsing Fib spirals to plot potential Tops for STEEMUSD
Also have plotted the transitions between bear and bull
Am a bit concerned about the validity of the spirals placed on logarithmic charts, yet here we are

STEEMBTC - STEEM UDS - STEEM LONGENTRY - STL - TP on picture
TP of me . And TP of you , i don't know
You can buy more if price lower entry
" High risk scaling consider when entering orders "
Wait to entry no buy price now if price done TP2 , We cancel this order !
THIS SHITCOIN BUY 20% $ TOTAL ACCOUNT
I am fomo following the recent pump dump events

Steem Analysis - STEEMSteem is showing some bullish signs on the USD pair. With a price fold over the 1.618 level, in addition a green Gaussian Channel, which is a very reliable trend indicator
However, on the BTC pair price action is quite low
If a trend reversal occurs on the BTC pair the USD value could go quite high
Steem is a good coin, I have thought about baghodling it

Full STEEMit ahead xd.not a whole lot to TA, but support and resistances are looking good.
previous bearish OB turned breaker. huge wick into this breaker even touched the wicks of the lower creek.
again looks like its coming to the end of its accumulation.
- perfect jump across creek on strong volume confirmation.
- this one didn't have a spring like some other accumulation charts, but not all accumulations need a spring/stop raid.
- we should be in some form of Buy Up rn before we full send it on markup.
I mean.
$0.40 now
weekly close around $6.30
you do the math. I mean this is a straight bargain brother.
dunno about you, but then again I'm not missing out on this ride.
this things a straight relic in cryptoland. been around before the first crypto boom where I stepped in and got analed pretty hard.
BUT THEN AGAIN. WTH DO I KNOW?
I'm completely clueless and I should not be followed for my advice coz its wrong XD

STEEM looking to test monthly resistance (HIGH VOLUME)STEEM has broken the daily resistance level at 2381 by wicking above the daily resistance.
If new candle opens above daily level, then we may see some move upward till monthly resistance. It is the 3rd time the monthly resistance is going to be tested.
The more times a level is tested, it becomes weaker.
We may see the monthly gets broken due to
1.High Volume
2. 3rd Time Test
3. Candle forming above daily level
4. Upper trend line also acting as a support.
In other case if 3rd time the resistance is rejected then it may retarce back to test the new support at daily level.
Also 3rd situation is:
If candle is unable to form above daily level which is 2381 then we can see a retracement back to 2260.
Wait for the new candle to be formed.
Then decide accoordingly.

STEEMUSDT After More Than 350% Big Bullish Move Now What Next?on 17th of March 2020 I posted an article where I revealed that the priceline of Steem has completed a bullish Shark pattern the formation of this pattern was started on 25thf November 2019 and completed on 9th March 2020. And as per Fibonacci sequence of bullish Shark pattern I predicted that the Steem will move up from here atleast between 0.382 to 0.786 Fibonacci projection of C to D leg of this bull shark pattern. And on the very next candlestick the price action of Steem took a really very powerful bullish divergence and produced more than 350% gains. That was really very massive profit.
Why the priceline moving down again:
In the previous article we have already examined that after the previous bullish move the priceline was not able to cross up the 200 simple moving average resistance. And dropped down on 100 simple moving average support this time the same move occurred again the even though the priceline moved up to 350% but could not cross up the 200 simple moving average and again dropping down on the 100 simple moving average. So far the priceline is above the 100 SMA but if it will hit on the 100 simple moving average then we can use the different indicators to examine that whether the priceline will take another bounce from this simple moving average or it will break down the 100 simple moving average this time.
My combination of indicators to determine whether this support will be broken or not:
For example I'm using the William top bottom indicator with the combination of momentum indicator. If the William top bottom indicator will turn green it's mean that it will be giving signal that the sellers are active and after turning green when it will be turned gray then it is the signal that the buyers are getting active, with that signal if the momentum will be turning bullish and we will be above the 100 simple moving average then in my opinion the priceline will take another bounce from 100 SMA support.
What if the priceline will breakdown the 100 SMA:
In case the priceline breaks out the 100 simple moving average on 2 day chart then we can witness a very strong bearish move by the price action of steem. And in this situation this strong bearish move can help the priceline to complete the final leg of an other big bullish Shark pattern. As we can see that after initial leg the A to B leg is retraced between 0.382 to 0.618 Fibonacci level and B to C leg is projected between 1.13 up to 1.618 Fibonacci projection and this is the Fibonacci projection of A to B leg. Here I have ignored some extra spike because all other legs are driven as required for the bullish Shark pattern. Now if the final leg will be retraced between 0.886 up to 1.13 Fibonacci retracement level then the price action should take another powerful bullish divergence at least between 0.382 to 0.786 Fibonacci projection of C to D leg. And this can be another up to 360% profit potential move. As per Fibonacci sequence of this bull shark pattern the buying and sell targets should be as below:
Buy between: $0.1219 to $0.0699
Sell between: $0.1931 to $0.3229
This idea is for long term and midterm traders, I will be keep posting more trading ideas.
Note: This idea is education purpose only and not intended to be investment advice, please seek a duly licensed professional and do you own research before any investment.

This Extreme Bearish Trend Helped STEEM In Completing Final LegA strong resistance level the main cause of drop:
Hi folks hope you are well and welcome to the new update on Steem with US dollar pair. To understand the current downtrend we need to go back in November 2019. When the price action was move sideways and took a powerful bullish divergence in January 2020 and broke out the 100 simple moving average resistance. After breaking out the 100 SMA the price line of Steem used this resistance as support and took another very powerful bullish divergence and touched the 200 simple moving average resistance.
At this level the price action has hit 4 times but failed to break out the 200 simple moving average resistance. And price action again dropped at 100 simple moving average on 26 Feb and again used this moving average as support to make another attempt to break out the 200 SMA. But this time the price action could not even able to move closer to 200 simple moving average resistance and dropped down again. And currently the Steem is likely to break down the previous support of 100 simple moving averages well.
Formation of harmonic pattern:
During this move on daily chart the price action of Steem formed a bullish pattern. A on 27th Feb 2020 I posted an article where I revealed that the Steem has formed a bullish BAT pattern on one day chart. The formation of this pattern was started on 10th of January 2020 and the price action entered in the potential reversal zone on 27th Feb 2020 this was the day when I posted the article. We also had a very strong support of 200 simple moving average in the PRZ level of this bullish pattern that made this pattern more stronger. Because the 200 simple moving average on one day chart is always considered a strong support and it can also provide sufficient push to priceline for the bullish divergence.
And as per BAT pattern and Fibonacci sequence method the price action was suppose to take the bullish divergence from this potential reversal zone and enter in the Fibonacci projection area of A to D leg of this bullish BAT pattern between 0.382 to 0.786 level.
On the very next day 28th Feb 2020 the price action moved up and produced more than 28% profit and it was expected that if the price action will cross up the 0.786 Fibonacci projection level then it can move more up using the 0.786 level as support and Steem will finally breakout the 200 simple moving average resistance of 2 day chart as well. Even though the trade plan I posted in article executed successfully. But unfortunately the price action dropped down again after visiting the Fibonacci projection area of A to D leg of bullish BAT pattern.
A head and should pattern can lead the priceline more down:
If we see the broader view then it can be clearly examined that Head and Shoulder pattern is completely formed that is reflected upto 4 days chart.
At this time it can be clearly seen that the price line of steam has hit the spike even beyond the neckline of Head and Shoulder pattern
At this time it can also be observed that a long red colored strong bearish candlestick is putting pressure on the neckline of the Head & Shoulder pattern to break down the neckline as well. And due to this pressure the price action can easily break down the 100 simple moving average support on 2 day chart.
Bullish Shark pattern a bullish reversal signal is appeared:
Now I am taking you to the more broader view of Steem’s price action and that is the price action has completed the formation of another harmonic pattern on weekly chart. And this time the pattern is big bullish Shark. Now let's have a look how perfect this is pattern is formed. The initial leg was started by the candlestick which was opened on 25th November 2019 and this like has been completed on the candlestick which was opened on 25 Nov 2019 and completed by the candle stick of 13 January 2020. Then the price action dropped upto 0.618 Fibonacci level. From this point the priceline of Steem was supposed to be projected between 1.13 to 1.618 Fibonacci level this was the projection of A to B leg. And we can see that the price action even projected little bit more than that level. Therefore at this moment I have ignored some extra spike cause all other legs are formed as per requirement of bullish Shark pattern. The final leg was supposed to be retraced between 0.886 upto 1.13 Fibonacci level. And it can be easily seen that the price action has retraced up to this level. At this time the price action is moving in the potential reversal zone of this big bullish shark pattern.
The potential reversal zone and the Fibonacci projection area ranges:
Now from this potential reversal zone the price action should take a bullish divergence to enter in the Fibonacci projection area of C to D leg. And as per bullish Shark pattern the potential reversal zone starts from $ 0.1128 and ends at $ 0.0803 and the Fibonacci projection areas starts from $ 0.1573 and ends at $ 0.2390. So there is an expected big bullish move upto 197%. But this potential reversal zone should be as a stop loss as well because once the PRZ level will be broken down then Steem can turn more bearish.

STEEMUSDT formed bullish BAT | Upto 96% bullish move expectedHi friends hope you are will, here I have found another profit potential trading idea for you and this time I have found a harmonic move by Steem. The Priceline of Steem has formed bullish BAT pattern and entered in potential reversal zone and ready for bullish reversal soon.
Let’s have a look on the Steem’s move:
After initial leg (X to A) the A to B leg is retraced between 0.382 to 0.50 Fibonacci and then B to C leg is projected between 0.382 to 0.886 of A to B Fibonacci projection area and last leg (C to D) is retraced between 0.786 to 0.886 Fibonacci and now the price action is moving in potential reversal zone of this bullish BAT and now we can expect bullish divergence at any time which will lead the priceline between 0.382 to 0.786 Fibonacci projection of A to D leg , but if after this bullish divergence the candles sticks will be closed above the 0.786 Fibonacci projection area of A to D leg then it can also lead to the long term bullish move. We also have a 200 simple moving average in PRZ level that can be a strong support to push the price action up to 96%.
Buying And Sell Targets:
The buying and sell targets according to harmonic BAT pattern should be:
Buy between: $0.1593 to $0.1400
Sell between: $0.2053 to $0.2745
Stop Loss:
The potential reversal zone area which is up to $0.14 can be used as stop loss in case of complete candle stick closes below this level.

STEEMUSDT forming bullish Shark | Upto 30% move aheadPriceline of World's 78th ranked cryptocurrency out of more than 2300 cryptocurrencies Steem is forming bullish Shark pattern and soon it will be entered in potential reversal zone and will be ready for bullish reversal soon.
This potential reversal zone should be used as stop loss in case of complete candle stick closes below this zone.
Let’s have a look on the dimensions of Steem price action's moves:
After inertial leg (X to A) the A to B leg is retraced between 0.382 to 0.618 Fibonacci and then B to C leg is projected between 1.13 to 1.618 of A to B leg's Fibonacci projection and final (C to D) leg is suppose to be retraced between 0.886 to 1.13 Fibonacci for a perfect bullish Shark and then the price action will be entered in potential reversal zone of this bullish Shark pattern, then we can expect bullish divergence at any time which will lead the priceline between 0.382 to 0.786 Fibonacci projection of C to D leg, but after this bullish divergence if the candles sticks will be closed above 0.786 Fibonacci levels then it can also lead to the long term bullish move.
As per Fibonacci sequence method we can set our targets as below for mid term trade:
Buy between: $0.1171 to $0.1087
Sell between: $0.1247 to $0.1419
So this short trade has potential to produce upto 30% bullish move.
Regards,
Atif Akbar (moon333)
The harmonic moves analysis involves hours of hard work and determination however the success of harmonic trading in fiat and cryptocurrencies is around 80% therefore it is always important that you follow any stop loss strategy while trading harmonic patterns I have also shared a stop loss idea in this article, the information in this article is for educational purpose only this is not intended to be investment advice, I have tried my best to catch the harmonic moves as per predefined classical harmonic bullish Shark pattern if you find any flaw or you have any suggestion feel free to share with me in comments section.

Steem Great Buying Opportunity - Don't Miss This One - HUGE ROI
Steem Great Buying Opportunity - Don't Miss This One
Steem Crypto Forecast - Technical Analysis
Based on AB=CD pattern , Time Ratio & Gann Analysis, It's a potential long position which will give a huge ROI
In a lower time-frame (4hrs) this long position has also been conformed.
Target profits are mentioned in the chart.
Adjust your Stop Loss according to your lot size,
account equity ,strategy & money management.
***If you want to get in this trade from this point 0.15 you can still make profit till TP1 is reached, however there is a very high probability that price may continue to move down towards my ideal entry point., It is recommended to enter with a smaller lot size if you want to go long right away & manage your stop loss accordingly.
Good Luck.!
* This is my personal view and analysis on this chart. If you follow this idea please plan your trade according to your lot size and account equity.
Don't forget to like , If you like my analysis :)

DBL bottom STEEMUSD confirmed with BB KC FIBO + VOLUMEParabolic SHORT opportunity presenting itself on $STEEMUSD as evidenced by the DBL bottom/volume/KC/BB/volume surge & otherwise. Targets 1 & 2 below
Perhaps due to the recent rumors/news about Libra getting cold feet? For if LIBRA were to fall apart; that would leave STEEMIT the leading social media decentralized platform on the blockchain, as it has the most user-base & a solid roadmap after their scorched earth clean house -- whaever they did worked as they are rapidly progressing and satisfying their roadmap in stark contrast to the previous devs who literally kept the platform in BETA for half a decade.
So if I had to guess as to what's causing the bullish signal on $STEEMUSD it'd probably be the recent news about LIBRA/VISA backing down, though the technical indicators seem to support a bullish outlook regardless; whatever the reason may be, it's a good time for entry.
When in doubt, zoom out & in doing so it paints a pretty ugly picture for the outlook of $BTCUSD as we are most definitely due for a huge parabolic surge but it's going to get worse before it gets better...
You know the cliche, "things get the darkest before dawn" and in the case of BTCUSD priceaction it does appear that way.
IMHO we're in for another 2-3 selloffs before a retrace/consolidation & reversal.
IN THE MEANTIME: I can definitely see altseason on the horizon with plenty of undersold & undervalued alts leveling out before BTC crosses 10.2k R again.
HENCE, my recommendation would be to stick to short positions until we get out of this bear trap. There's plenty of money to be made -- both in USD & esp. in pairing against BTC (which I would not advise *unless you really know what you're doing* for i do not recommend novices attempt to play around with pairings unless they don't care if they lose their investments) as it took me a lot of trial/error and thousands of $$ lost over 2015-2016 before I could effectively establish a rhythm for pairing other tokens/coins against BTC & turn a profit even in bear markets (which I really honed my skills at during Cryptowinter) though I digress.
TP:1 0.1508
TP2: 0.1588
Stop: 0.1360
Disclaimer:
Not financial advise; please trade responsibly. Always set stop-losses! DON"T FOMO/FUD
-@a1mtarabichi

50% retracement FULL STEEMUSD (LONG) AHEAD!Elliot Wave indicates that STEEMUSD is on course for a mid-long term entry @ $0.3951 which (if you made said entry now) would be nearly 100% ROI in IMHO ballpark estimate would be a 7-10 day timeframe.
i.ytimg.com
Incase any of you folks forgot what an Elliot Wave is.
STEEMUSD (i'd be here all night and I need to get some sleep; Idk where to start, but I'll just sum up my entire feelings about this platform in one sentence:)
This token is dying...esp with the announcement of $LIBRA (which ironically; I wrote a lengthy blog post on STEEM about how whales were bullying content creators and manipulating curation incentive payouts thus ruining the platform and it would be just a matter of time before a Zuckerberg comes along and makes a better version of a social media platform on the blockchain and ousts you guys!)
Just like many other projections (the release of Bakkt, the centralization & CLA win for XRP) I am a goddamn wizard whose only gift is seeing shit people don't believe until after I get the bittersweet pleasure of saying I told you so.
I'm not gonna bother digging around for that post; I'll post it in the comments tomorrow, its several months old and I'm starting to feel delirious, I haven't slept since Sunday. Lol.
So this means:
Altseason is coming , and with an entry at $0.20 you could effectively double your ROI/investment with TP short/pivot line at S2 set for $0.3915 USD with my EST. timeframe of 7-10 (maybe longer) days.
Please read the disclaimer from my LTC publication -- I reposted on Twitter/Linkdeln and edited so its not written like a dumbass (siri's grammar errors! my bad :) ) but yeah if you're leery about investing in crypto already and especially lower market cap coins; take it from someone whose been around for a while, while STEEM (IMO atleast) will NOT be around in 10 years, it does not mean it will get a quick and painless, it shall die slowly and not quick with a huge big bang like Bitconnect.
Let's not forget that Steem was/is the first social media platform on the blockchain; released in 2014...it still has a small but very loyal userbase primarily in Europe/Asia.
It has many many many flaws, one in particular -- the fact that its still in Beta (after almost 6 years) is inexcusable. I'm also convinced the mods are in cahoots with the whales to manipulate curation payouts but again no need to get conspiratorial it's almost 3AM and i'm going to bed.
Read my disclaimer from my last post on my twitter/linkdeln.
TP 1-2 for the more impatient EMA8 swing-traders are also present; though i would HODL out for $0.3915 TP (or atleast 37.5 cents; but IMO stick with my target if you're uncertain as it goes if you're going to take a bold risk on a sinking ship with a treasure trove of gold...you might go down with it but that's only if you get greedy. Set your stop loss at the red horizontal -- and WAIT patiently, in about a week, two tops, you'll double whatever entry you just made.
You're welcome.
peace & love
@a1mTarabichi

STEEMBTC Latest Technical AnalysisWe are doing Analysis of NEBLBTC on 1 Day Timeframe.
I have Mention Support and resistance levels on Chart
Note: This is only for Educational Purpose this is not an Investment advice.
Please support the setup with your likes, comments and by following on Trading View.
Thanks
Adil Khan

STEEM Looking Good For Entry...!!#STEEMBTC (Huobi)
In Daily TF , Steem Is On Support Area & Looking Good For ShortTerm Entry..
All Technicals Are Bullish,,So Grab Some At Here..
Buying Range 7800-8100 Sats
Sell Targets 92-100-120 Sats
Stop Loss Below Support
Introduction..!!
Steem is an open source blockchain protocol capable of storing social information and distributing tokens based on a Proof-of-Brain algorithm.
Hit Like & Follow Us
Thanks

STEEMBTC - ANOTHER PATTERN Buy Price: Green Zone
TP: Blue Zone
Support: Orange Line
Resistance: Purple Line
SL: Red Zone (I don't recommend to sell in loss.)
Invest Suggestion: 20 Percent
Profit Expectations: 10 to 40%
Another pattern founded in STEEM, it's seems very likely to happen again ( borwn circle )! All techinicalls are pretty good!
See me previous analysis and how profitable the are!!!
Sell when you get some profit, according the way you trade.
Keep following us and please like this idea.
Any doubts? Send in the comments or in our telegram or Inbox here.
Thanks for visiting.


STEEM is ready for a moon ride!Steem is looking very bullish, an upcoming AB and C wave is on the way!
With the upcoming news as well: 07 November 2018
SteemFest 3
SteemFest 3, the third global Annual Steemit gathering, will take place in Krakow, Poland from Nov 7-11.
15 January 2019
TestNet Release
Steem Smart Media Tokens (SMT) TestNet release.
Expecting very good returns: Buying 0.000120-130 with a stop loss of 0.000115
Selling targets: 0.000145-177-210-255-333+

STEEM Trading AdviceBuy Price: Yellow Line
TP: Green Lines
Invest Suggestion: 5-10 Percent
Profit Expectations: 5, 10 or >20 Percent
Just hold and watch. All targets will be reached within 24 to 72 hours as my prediction. But it's recommended to hold it for 6-7 days if any target not reached. Sell when you got some profit. I am sure, you will be get nice profit. Good Luck!
Looks Good? Leave a like and share.
Thanks for visiting.

STEEM / USD TO HIT $100 WITHIN 6 MONTH - CryptoManiac101Enjoy this trade advice my Crypto Maniacs, but remember to invest only what you can afford to lose or you're going right back to poverty on drop. We are not your financial advisors.

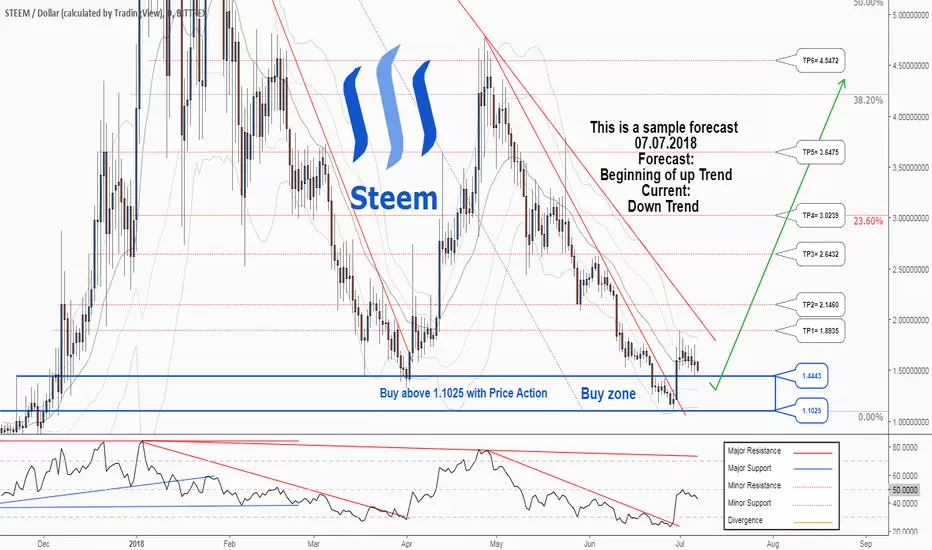
There is possibility for the beginning of uptrend in STEEMUSD Technical analysis:
. Steem/Dollar is in a downtrend and the beginning of uptrend is expected.
. The price is below the 21-Day WEMA which acts as a dynamic resistance.
. The RSI is at 43.
. The RSI downtrend & The price downtrend in the daily chart are broken, so the probability of resumption of uptrend is increased.
Trading suggestion:
. There is a possibility of temporary retracement to suggested support zone (1.4443 to 1.1025). if so, traders can set orders based on Price Action and expect to reach short-term targets.
Beginning of entry zone (1.4443)
Ending of entry zone (1.1025)
Entry signal:
Signal to enter the market occurs when the price comes to "Buy zone" then forms one of the reversal patterns, whether "Bullish Engulfing" , "Hammer" or "Valley" in other words,
NO entry signal when the price comes to the zone BUT after any of reversal patterns is formed in the zone.
To learn more about "Entry signal" and the special version of our "Price Action" strategy FOLLOW our lessons:
Take Profits:
TP1= @ 1.8935
TP2= @ 2.1460
TP3= @ 2.6432
TP4= @ 3.0239
TP5= @ 3.6475
TP6= @ 4.5472
TP7= @ 6.1394
TP8= @ 9.2557
TP9= Free
