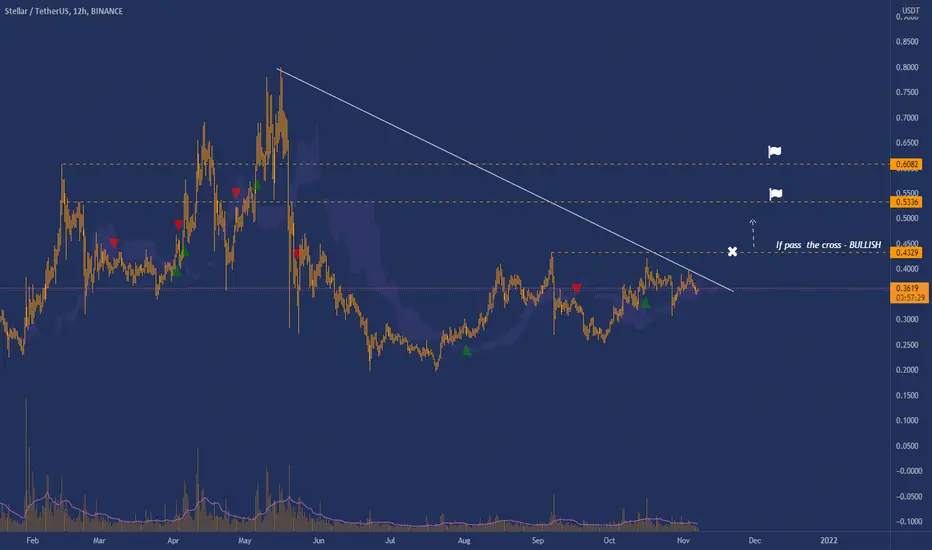
XLM: A Cryptocurrency in search of a bullish trendThe Stellar Lumen XLM is a very intriguing cryptocurrency. Last week, it announced a collaboration with flutterwave. In the last few weeks, it appears to be waking up; it is not currently in the limelight, but it is quickly approaching the resistance level at 0.40, which might lead to an upside breakout.
In my opinion, it has limitless potential owing to its high speed and low cost. XLM's price is significantly lower than that of other options with a much higher market capitalization.
XLM certainly suffered market jitters after the SEC's intervention on Ripple, but its fate is quite different.
XLM is a non-profit organization that has important partners such as IBM and will be utilized to facilitate micro payments between Europe and Africa at very low rates. That's why Flutterwave was chosen.
Flutterwave is a Bay Area-based fintech firm that develops a payment system for multinational businesses and payments providers on the continent. The headquarters are in San Francisco, California, with offices in Nigeria, Kenya, Ghana, South Africa, and Seven More African Nations among other nations.
Disclaimer
NO FINANCIAL ADVICE – The information on this website is for educational, informative, and entertainment purposes only. No express or implied warranty of any kind, including warranties of accuracy, completeness, or fitness for a particular purpose, is given with the Information.
This article is not intended to be and does not constitute financial advice, investment advice, trading advice, or any other form of advice.
This post's information is general in nature and isn't meant for you or anybody else. You should not rely on any of the material found on this post to make a financial, investment, trading, or other decision without first doing your own due diligence and consulting with a professional broker or financial advisor.
You understand that by reading any and all information on or through this post, you are doing so at your own risk.
The trading of cryptocurrencies, Tokens and NFTs has potential rewards, and it also has potential risks involved. Trading may not be suitable for all people. Anyone wishing to invest should seek his or her own independent financial or professional advice.
STELLAR

XLM/USD - Attempting to break above $0.40! Break it and it runs!Stellar had a protocol update in early November bringing Automated Market Makers and liquidity providers on the XLM ecosystem...
Have you heard of Uniswap and Sushiswap decentralized exchanges on ETH network? This is the same, only better.
XLM network is faster (almost instant) and much cheaper to swap/transact (almost free) which will attract a lot of liquidity providers... why swap ETH/BTC and other coins on Uniswap and pay $100-$200 to do so per swap when you can do it on XLM using StellarX decentralized exchange for 1 cent?
This is even better than BNB based decentralized exchanges...
In any event, this fundamental news is bullish for XLM because... any new liquidity/volume on XLM network will put buying pressure on Stellar. If it can capture market share from UNI, SUSHI and BNB/ETH decentralized exchanges... it's gonna rocket.
Plus, the technical indicators are very bullish. I totally see XLM hitting $1 once we break above $0.40 resistance.
Not a bad entry to get in during a breakout above the ascending triangle or to buy support.
Bias, mega bullish...
Like and follow if you liked my idea!

Update for XLM analysismy old levels still works for XLM :D
u can enter the buy position after the break and surely u must see confirm options and then take the position.
Good luck

XLM - Double Cup and Handle + Inverse H&SWhat is going on here?
Double Cup and Handle + Inverse H&S???
Moon!

Stellar (XLM) - November 10Hello?
Welcome, traders.
By "following", you can always get new information quickly.
Please also click "Like".
Have a nice day.
-------------------------------------
(XLMUSD 1W Chart) - Medium to Long-Term Perspective
Above 0.16420803 point: expected to continue uptrend
(1D chart)
First resistance section: 0.44131920-0.49247502
Second resistance section: near the 0.64594249 point
First support section: near point 0.33900755
Second support section: 0.18554008-0.23669590
To break above the first resistance level, we need to see if we can sustain the price above the 0.42952236 point.
If the price holds above the 0.51004846 point, the uptrend is expected to accelerate.
If it goes down, you should see support above the 0.37193428-0.40293161 zone.
It is expected that the trend will be created by moving out of the 0.27220347-0.42952236 section, so you need to think about countermeasures.
The next volatility period is around November 19th.
-----------------------------------------
(XLMBTC 1W chart)
Above 746 Satoshi Branch: Imagination Trend Reversal Expected
1103 Satoshi - 1288 Satoshi or more: Expected to create a new wave.
------------------------------------------
We recommend that you trade with your average unit price.
This is because, if the price is below your average unit price, whether it is in an uptrend or in a downtrend, there is a high possibility that you will not be able to get a big profit due to the psychological burden.
The center of all trading starts with the average unit price at which you start trading.
If you ignore this, you may be trading in the wrong direction.
Therefore, it is important to find a way to lower the average unit price and adjust the proportion of the investment, ultimately allowing the funds corresponding to the profits to regenerate themselves.
------------------------------------------------------------ -----------------------------------------------------
** All indicators are lagging indicators.
Therefore, it is important to be aware that the indicator moves accordingly with the movement of price and volume.
However, for the sake of convenience, we are talking in reverse for the interpretation of the indicator.
** The MRHAB-O and MRHAB-B indicators used in the chart are indicators of our channel that have not yet been released.
(Since it was not disclosed, you can use this chart without any restrictions by sharing this chart and copying and pasting the indicators.)
** The wRSI_SR indicator is an indicator created by adding settings and options to the existing Stochastic RSI indicator.
Therefore, the interpretation is the same as the traditional Stochastic RSI indicator. (K, D line -> R, S line)
** The OBV indicator was re-created by applying a formula to the DepthHouse Trading indicator, an indicator disclosed by oh92. (Thanks for this.)
** Support or resistance is based on the closing price of the 1D chart.
** All descriptions are for reference only and do not guarantee a profit or loss in investment.
(Short-term Stop Loss can be said to be a point where profit and loss can be preserved or additional entry can be made through split trading. It is a short-term investment perspective.)

XLM cup and handle to $1.38#XLMUSDT
$XLM hold above support zone and ascending support line, if price success to complete the BAT pattern in previous analysis, then this cup and handle pattern of weekly chart will be on process to touch $1.38.

XLM bat pattern to $0.62#XLMUSD
$XLM is trading inside a triangle and now price is below and near the upper line of this pattern.
if price hold above support zone and break out from upper line of triangle can head up price toward $0.625 , which is the same as target of BAT pattern.


Looking to 100x?Start stashing Stellar if you haven't already begun to do so. We've tested the resistance point at 0.7 and once we breakthrough that resistance, we will be flying up to the $35 zone to test the next resistance. Definitely a must have crypto for anyone looking forward to banking x100!

XLM the sweetest optionXLM
So if we are doing this mid October 17 fractal area idea and move it over to XLM it looks like this. And funnily enough it looks pretty bloody similar overall.
If ol Jed pulls this one off. Sheesh. I wouldnt underestimate him or the dynamic duo that is xrp/xlm. but xlm is xrp without the shady shit. plus Jed has been harvesting all those unlimited xrp gains for the last bloody 10 years or whatever it is now. Dude is low key able to buy whole countries at this point.
I am loaded in case this happens. I've been wrong twice now on this one. 3rd times a charm baby.
x

One last shot before the XLM train leaves the station to .47+Fractal Pricing and Time Scale is pointing to an explosive move about to happen. Get on board while prices are low. Not pro advice.

XLM - CRYPTO THAT IS ABOUT TO FLY 110% - CryptoManiac101XLM / USD TA
Stellar Lumens, just like XRP, didn't really have a proper bull run this season, but it's about to get on as it breaks out from this reversal pattern.

XLM: do something alreadyA few days ago i’ve posted an imverse HnS on IOTX, today it skyrocketed.
I’m gonna leave this here just in case

Stellar Future Expected. As you know, Stellar, one of Europe's major crypto projects, crashed with the hard fall of bitcoin. We will hear positive news soon. Confidence was restored with bitcoin breaking records. What I want to tell you is that nothing stays cheap.
The population continues to increase.
Inflation continues to rise.
Central banks continue to print money.
Technology continues to evolve.
The internet continues to age.
Most importantly, X,Y,Z, and subsequent generations support crypto full-time.
Gold is still a safe haven.
But Crypto is a Fast port. It is active 24/7.
It does not need any bank.
There are low commission fees.
Not investment advice.

XLMUSDT 1DHi everyone
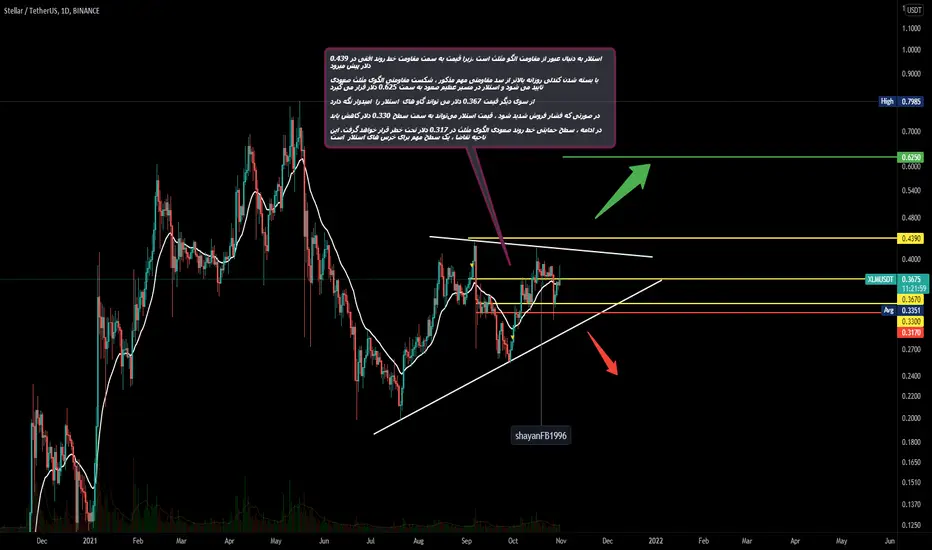
Stellar is looking to break the resistance of the triangle pattern, as the price moves towards the resistance of the horizontal trend line at $ 0.439
With the closing of the daily candle above the important resistance barrier, the resistance failure of the ascending triangle pattern is confirmed and Stellar is on the massive ascent to $ 0.625
On the other hand, the price of $ 0.367 can keep the Stellar cows hopeful
If the selling pressure intensifies, the price of Stellar could fall to the level of $ 0.330
In the future, the support level of the upward trend line of the triangle pattern will be endangered at $ 0.317. This demand area is an important level for Stellar bears
Good luck
XLM silence before the storm?XLM is a very quiet project, it continues its calm trend, despite great fluctuations in the market, it shows remarkable resistance to the influence of BTC. As you can see, XLM needs more time to show a strong uptrend

XLM - MASSIVE ACCUMULATION IN PROGRESS - CryptoManiac101XLM / USD TA
Looking at XLM, I can't help it but get a feeling we still have a few weeks or even a month for the 'meme' coin frenzy.

XLMUSD - Price Action Has Been Consolidating For A Move HigherWe are still waiting for another move higher for XLM.
Some clues has surfaced regarding what we could possibly be looking at here.
It seems a little strange that we have been consolidating for this long only to have a small pop to the upside.
In this video I explain why this is the case.
In this type of move it is not exactly easy to produce a target however tracking the waves will suffice.
In a nutshell there appears to be more Wave 1-2 subdivisions in this current move than in any of the previous 5-Wave moves.
In my opinion this provides a valuable clue.
Remember to use Disciplined Money Management Principles to ensure longevity as a trader.
If you don't know the long term pattern shouldn't you be doing your research instead of just following the crowd?
Just remember: I am not a financial advisor, I suggest using this only as a guide. Always do your own research.


XLM to .47 around November 5thTime and Price Calc suggests that's where XLM is going. This is not pro advice.

Waiting for an bullish movement in LTCAfter a lateralization of the currency, XLM is leaving setup after retesting the local poc. We can expect an explosive move in the short term if we manage to overcome the marked area of the previous triangle.

Stellar up The mission of the Stellar Development Foundation is to create fair and balanced access to the global financial system. The new launch will support the network’s mission by connecting Stellar-based businesses to develop an efficient and cost-effective Pan African payments system.
Also, TEMPO CEO Suren Ayriyan expressed his excitement about the partnership with Flutterwave to provide services to Africa. He emphasized that its customers across Europe will now be able to easily send funds to Africa. Consumers can send money to their loved ones or conduct businesses in a faster and cheaper manner. Speaking further, Ayriyan noted that the money transfer company hopes to continuously collaborate with Stellar. According to the CEO, TEMPO hopes to provide cheap, secure, and swift global money transfers to its new and existing customers.
