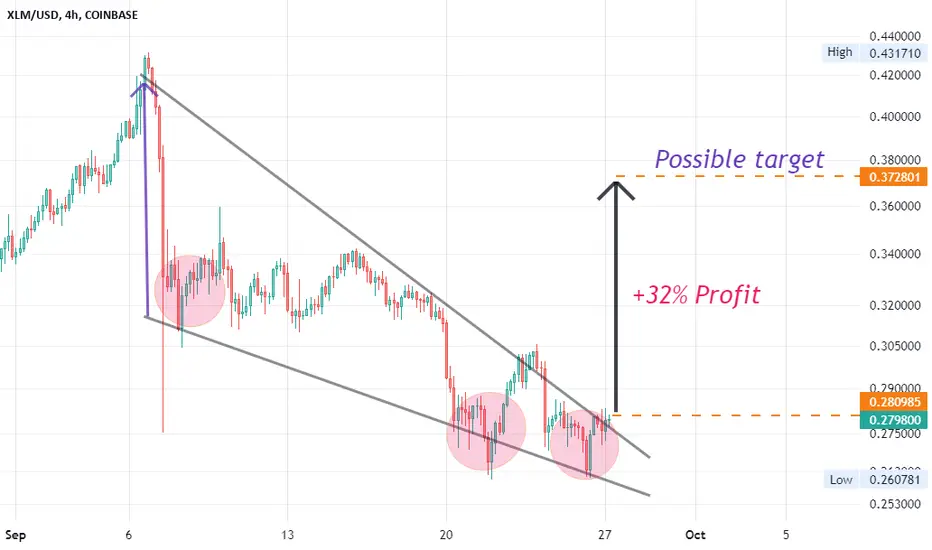
XLM OBSERVATIONStellar price is testing the green ascending trend line that acted as backbone for the uptrend since the beginning of October.
XLM price looks to be making a false breakout, a bear trap, that could see large buy-side volume resulting in a bullish recovery and breakout.
Expect a quick break above $0.41 towards $0.46.
STELLAR

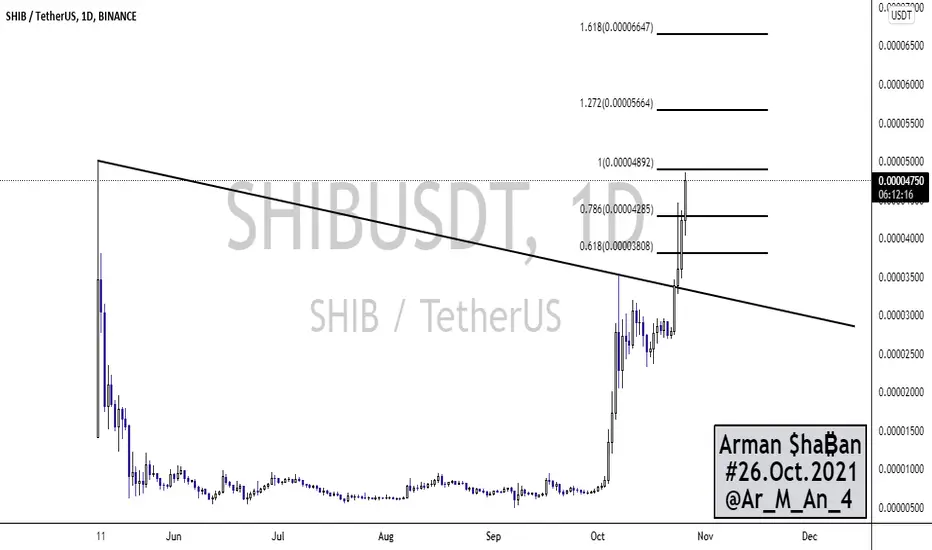
₿ SHIBUSDT 1D ₿ : 26.Oct.2021This analysis is a check of the chart in a Daily time frame and everything is clear on the chart and does not need additional explanation ... However, if you have any questions, feel free to ask .
⚠️ This Analysis will be updated ...
👤 Arman Shaban : @Ar_M_An_4
📅 26.Oct.2021
⚠️(DYOR)
XDC: A cousin to Ripple & compatible with the ISO20022 standardLooking at this chart it may seem like not much is happening but this is virtually the same chart Ripple had in 2017 before the huge burn up. XDC is probably going to be a very well known name shortly due to the trade finance angle and ISO 20022 compatibility.
coinmarketbag.com
investorplace.com

XLM breakoutStellar broke up this triangle 📐 and I think there is chance for run to 0.943 and even higher. Just bought this local range breakout. XLM let's go!🚀
ENTRY : local high @ 0.370
SL : local low @ 0.319
TARGETS : 0.519, 0.610, 0.943
RRR : 2.9 TP1, 4.7 TP2, 11.3 TP3
INVALIDATION : when SL level hit
Check my other stuff in related ideas.
Please like👍, comment🗣️, follow me✒️, enjoy📺!
⚠️Disclaimer: I'm not financial advisor. This is not a financial advice. Do your own due dilingence.

Stellar Lumens vs Tether Chart Analysis (XLMUSDT #10)Here we go again and now you will understand why I didn't chart USDT pairs in the past.
XLMUSDT (Stellar Lumens) has the same chart as LINKUSDT and TRXUSDT, these two were just published in my profile minutes ago.
In fact, the XLMUSDT is also the same chart as OMGUSDT the only difference is that OMGUSDT is more advanced, moving ahead.
Since the entire market is linked/connected, the rest are very, very likely to follow and thus we are bullish on all these coins.
To proof my point (last time I promise):
We have the strong drop 7-Sept.
Notice the correction from May to July and the bullish wave that followed.
Right now prices are above MA200 (black line on the chart), just a little more consolidation and it can go into bullish continuation.
If prices break below the colored lines (EMAs), the bearish gain some strength but the bulls are still in control since we are trading within higher lows.
If the last low breaks, we can say the bears are back on top.
Any other trading, retraces/corrections/price swings, aren't really important in the long run.
My view is that we will grow for years.
The Altcoins will be growing for years... If you go further back, you can see what I mean by higher lows:
Remember to hit LIKE.
Remember to bless me with your FOLLOW.
Comment also.
Thanks a lot for your continued support.
Namaste.

✅XLM💥+1000%Stellar is a blockchain project founded in 2014 by Ripple co-founder Jed McCaleb and venture capital investor Joyce Kim. At the beginning, Stellar shared a lot of its code with the XRP ledger, but the project has since taken on unique characteristics of its own. However, the XRP and Stellar blockchains are still often compared since they both offer fast and cheap transactions and share some common history. You can read more on this topic in our in-depth article on Stellar (XLM).
Key features of the Stellar blockchain:
Created in 2014
Provides fast and cheap transactions
XLM can be used as a bridge currency for international payments
Users can create custom tokens on the Stellar blockchain
The native asset of the Stellar blockchain is called lumens, and is commonly described with the ticker XLM. While XLM can be used for peer-to-peer transactions just like any other cryptocurrency, it also performs a role in the Stellar blockchain as a defense mechanism against spam transactions – a small fee of XLM is necessary to complete each transaction.
XLM is also designed to be used as a bridge currency to facilitate cross-border transfers between different currencies. For example, Alice can send EUR to Bob, and Bob receives USD on the other end of the transaction. Due to the network’s speed, fluctuations in the XLM price have a very limited impact on the transaction.
However, XLM is not the only asset that can be transferred through the Stellar blockchain – users can create custom tokens that can be transacted quickly and efficiently. For this reason, some ICOs and STOs have selected Stellar as their platform of choice.
The Stellar protocol also has a built-in decentralized exchange functionality where users can create buy and sell orders through the protocol itself – this feature can be accessed through interfaces such as StellarX.
One of the key players in the Stellar ecosystem is the Stellar Development Foundation (SDF), which funds the development of the open-source Stellar protocol and maintains the Stellar codebase.
The foundation is a non-profit organization which also supports the Stellar ecosystem by promoting the usage of the Stellar protocol through airdrops, grants and other mechanisms. The SDF has also launched a community fund which allows members of the Stellar community to have a say in which projects working on Stellar receive funding from the foundation.

XLMUSDT trade will be 12XXLMUSDt trade is showing signs of growth with 12X growth in next boost session. As trade crosses resistance point then trade will be up.

XLM: Triangle breakoutThis could be a nice swing trade. $0.41 is a good resistance so i’m looking there as a TP.
Maybe the price comes down for a retest of that trend line but i doubt it.
Good luck!

🔥 XLM Bullish Channel ContinuedA few weeks ago I made an analysis on XLM. Here I argued that XLM was trading in a bullish pattern since the reversal from the bottom trend line.
With both previous targets close to being achieved, it's time to look a step further.
Since we're trading in a bullish channel for almost 1.5 years now, I'm expecting this pattern to hold for the coming weeks.
New targets placed at $0.5 and $0.6 respectively. Be aware that the price might re-test the bottom trend line again.
Happy trading!

Will XLM continue the bull run ?* XLM forms a Descending Triangle pattern in 3H time frame, with it's important support around $0.365 and the above trendline as resistance for the pirce.
* As XLM is in a healthy uptrend we can expect continuation of trend after breaking the above trendline.

Stellar Lumens (XLM) - Structure and TargetsIn this study of Stellar Lumens, I contrast the 2018 market rally with the current bull market, within the context of a common rising channel.
Do you think it can provide a repeat performance of 2018, or are the headwinds just to great this time?
Share your targets and ideas, below.

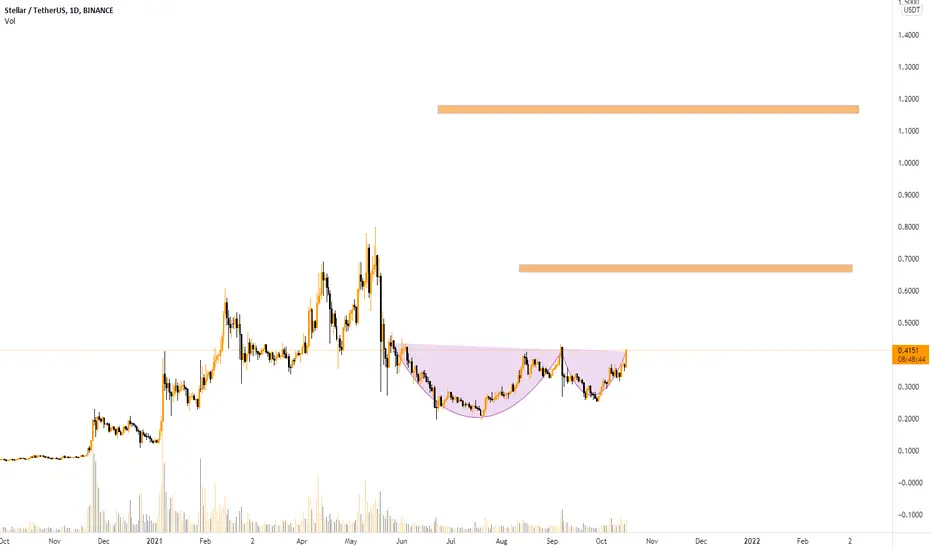
XLM cup and handle#XLMUSDT
$XLM shaped a cup and handle pattern. that can cause more increase toward $0.6 and $0.64 (68%). but for now price struggle to break out from resistance zone around $0.4, and support zone is around $0.33.

all safe still in the treding channeltreding safe in the uptrend expecting a bounce fgrom here somewere in the 0.43

Stellar (XLM) - October 21Hello?
Welcome, traders.
By "following", you can always get new information quickly.
Please also click "Like".
Have a nice day.
-------------------------------------
(XLMUSD 1W Chart) - Medium to Long-Term Perspective
Above the range 0.09017343-0.16420803: Expected to continue upward trend
(1D chart)
Resistance section: 0.40293161-0.44798284
Support section: 0.23438790-0.29261600
A move above the resistance zone is expected to accelerate the uptrend.
If the decline is from the support area, it is likely to touch near the 0.16420803 point, so trade cautiously.
-----------------------------------------
(XLMBTC 1W Chart) - Mid-Long-Term Perspective
1103 Satoshi - 1288 Satoshi or more: Expected to create a new wave.
(1D chart)
Resistance section: near the 746 Satoshi point
In order to transition into an uptrend, the price must rise above the resistance zone to maintain the price.
------------------------------------------
We recommend that you trade with your average unit price.
This is because, if the price is below your average unit price, whether it is in an uptrend or in a downtrend, there is a high possibility that you will not be able to get a big profit due to the psychological burden.
The center of all trading starts with the average unit price at which you start trading.
If you ignore this, you may be trading in the wrong direction.
Therefore, it is important to find a way to lower the average unit price and adjust the proportion of the investment, ultimately allowing the funds corresponding to the profits to regenerate themselves.
------------------------------------------------------------ -----------------------------------------------------
** All indicators are lagging indicators.
Therefore, it is important to be aware that the indicator moves accordingly with the movement of price and volume.
However, for the sake of convenience, we are talking in reverse for the interpretation of the indicator.
** The MRHAB-O and MRHAB-B indicators used in the chart are indicators of our channel that have not yet been released.
(Because it is not public, you can use this chart without any restrictions by sharing this chart and copying and pasting the indicators.)
** The wRSI_SR indicator is an indicator created by adding settings and options to the existing Stochastic RSI indicator.
Therefore, the interpretation is the same as the traditional Stochastic RSI indicator. (K, D line -> R, S line)
** The OBV indicator was re-created by applying a formula to the DepthHouse Trading indicator, an indicator disclosed by oh92. (Thanks for this.)
** Support or resistance is based on the closing price of the 1D chart.
** All descriptions are for reference only and do not guarantee a profit or loss in investment.
(Short-term Stop Loss can be said to be a point where profit and loss can be preserved or additional entry can be made through split trading. It is a short-term investment perspective.)

The falling wedge is almost completeHello friends,
I think Stellar makes its final downward move.
Stellar in short term (for more details see the attached Idea):
As you see, it's a falling wedge pattern. Pretty sure everyone knows that a bullish signal of a falling wedge is a more reliable indicator than a bearish signal of a rising wedge!
A Possible scenario is shown in the chart.
XLM/USD - buy signalJust draw Fib circles from the downtrend and from the uptrend.
You can see, that both resistance were broken.
Also 200MA was crossed.
And mirror line, which was described at this idea :
The patter called :Wide Mouth Openning, which means huge potential for price.
Global idea :

₿ 1INCHUSDT 1W ₿ : 17.Oct.2021Update: As we can see, in the weekly time frame, the price is involved with the POC Line volumetric resistance and is one of the most powerful resistances in front of the price ... If the price can break this resistance, the next important resistance is $ 4, which is from 6 months. The past has not been able to close above this range so far ... so if the $ 4 resistance is broken, the price path to climb will be smoother and the next targets will be clear on the chart.
⚠️ This Analysis will be updated ...
👤 Arman Shaban : @Ar_M_An_4
📅 16.Oct.2021
⚠️(DYOR)

₿ AVAXUSDT 1D ₿ : 16.Oct.2021This analysis is a check of the chart in a Daily time frame and everything is clear on the chart and does not need additional explanation ... However, if you have any questions, be free to ask .
⚠️ This Analysis will be updated ...
👤 Arman Shaban : @Ar_M_An_4
📅 16.Oct.2021
⚠️(DYOR)

XLM Stellar huge wedge breakout!XLM Stellar just broke out 20% bull from a wedge pattern! The uptrend is continuing. Look for resistance around .4321.. If it breaks through that we could see that turn into support which would help XLM greatly. - DiMarco

₿ XLMUSDT 1W ₿ : 16.Oct.2021 (Log)This analysis is a check of the chart in a weekly time frame and everything is clear on the chart and does not need additional explanation ... However, if you have any questions, be free to ask .
⚠️ This Analysis will be updated ...
👤 Arman Shaban : @Ar_M_An_4
📅 16.Oct.2021
⚠️(DYOR)

My take on Stellar Lumens (XLM) Price predictionAs a holder of XLM, I have set my targets from mid 2020 after the March crash due to C-19 assuming it was the bottom, bought it October 2020.
This is my take on its price and current situation which I believe its going up in the price from now, the only condition I see a dip if the B wave of BTC finishes soon and C wave takes it lower from the 60-68K in which XLM and the other assets will go hard with it. but I think its unlikely now IMO
Fundamentally XLM is solid project and positive for price action to the upside. Technically once it breaks 0.47$, I don't see any thing can stop it from continuation except for the BTC condition mentioned above

XLM/USD - Is Stellar waking up? Stellar day may lead to rally!Stellar Lumens pumped today with a lovely green candle on the daily which has now pushed us right below a major resistance line at $0.42 cents.
The indicators seem primed to take us much higher and break above this key resistance. Can XLM do it?
My bet is on the bulls, as the overall market is heating up. BTC and ETH are just about to break their own ATH... so XLM and the overall altcoin market will start to heat up.
Just a matter of time. If you look for an entry, get in when XLM makes the $0.42 resistance support and ride the pump to $1... which is our current ATH for XLM.
Like and follow if you liked this idea!

XLM Cup and Handle Pattern is Breaking Out Now!XLM pattern created is Cup And Handle Pattern wich is almost at Breaking out point , my targets are simple new ATH and beyond.! goodluck