XLM: Pullback in UptrendStellar (XLM) technical analysis:
Trade setup : Following a breakout from a Falling Wedge pattern, price spiked up to $0.19 where it got very overbought (RSI > 75) and traders took profits (selling pressure). Now it’s pulled back to support of $0.12, which could be a swing entry level. Fibonacci retracement levels are $0.12 (78.6%) and $0.13 (61.80%).
Trend : Neutral on Medium-Term basis and Uptrend on Short- and Long-Term basis.
Momentum is Bullish (MACD Line is above MACD Signal Line and RSI is above 55).
Support and Resistance : Nearest Support Zone is $0.12, then $0.10. The nearest Resistance Zone is $0.13, then $0.19.
STELLAR

XLM - Reevaluating My Perspective on Market Trends Since 2017In this engaging video, I've dedicated a significant amount of time to reevaluating my perspective on market trends since 2017. I recognized the importance of taking a break from intense analysis to shed any preconceived biases in my wave counts, enabling me to approach the charts with a fresh perspective.
Today, I'm excited to share my updated perspective on the current market count after meticulously reviewing all the data once again. I'm pleased to report that the process was surprisingly smooth, allowing me to refine my ideas and insights.
But that's not all; I'm committed to continuing this journey of revisiting and processing many more ideas in the future. It's essential to stay flexible in the world of finance and adapt to changing dynamics.
Lastly, I'd like to emphasize that I'm overwhelmingly bullish on the long-term prospects. However, I firmly believe in making informed decisions and taking positions when the timing aligns with the market's movements. Join me in this video as we delve into my refreshed perspective and insights!

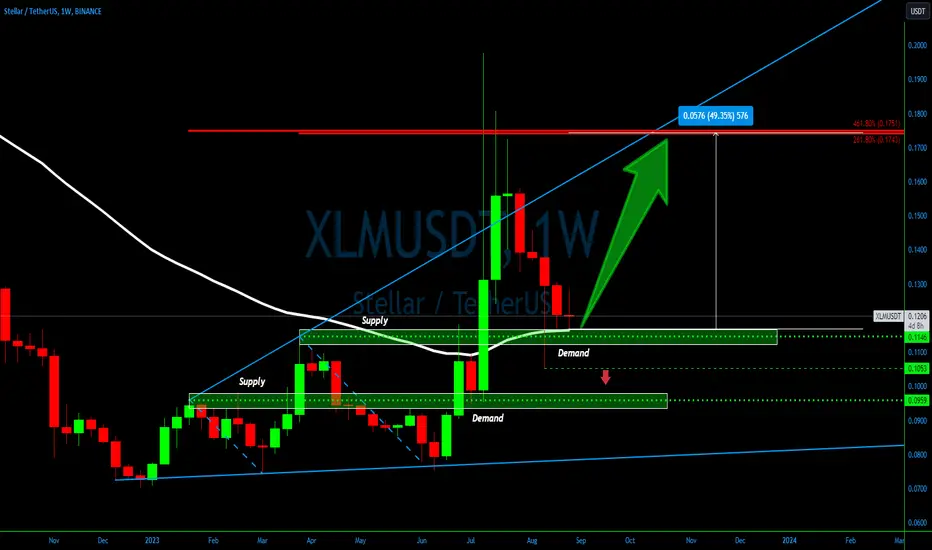
Unpacking XLMUSDT Price Patterns💎 Diving into #Stellar's long-term price trajectory, we spot some captivating patterns. The weekly #XLMUSDT chart reveals the price nestled in a robust demand zone, a magnet for buyers. Moreover, the 200 Exponential Moving Average has been consistently rebuffed in the past weeks.
💎 The bullish uptrend is evident with the formation of LLs and LHs. Given #XLM's position at support, it hints at a promising risk-reward scenario for bullish traders. As long as the price hovers above the current demand zone and crucially, remains north of the recent low at $0.1053, the scales tip towards an uptrend continuation.
💎 Eyeing the upside, a formidable resistance looms at $0.1750, marking a 50% surge from the present rate. This resistance's potency is amplified by a dual Fibonacci level, specifically at 261.8% and 461.8%. We could witness either a swift rally or an extended consolidation before #XLMUSDT ascends. In this volatile dance, patience and discipline remain our steadfast partners.
XLM\XRP - I Told You This Was A Fake Out... Who Listened?Back once again to highlight some key points about what most herders have been thinking over the last couple of months. Nothing new, just some hard facts about how ridiculous these sheep like creatures appear to me when they speak nonsense garbage.
A lot of these people that doubted my predictions are just useless nobodies that never invested 2 seconds of their time to learn anything about how markets operate.
I spent over 8 years creating the AriasWave methodology and have become an expert at reading these waves as a result. I no longer need to bother wasting my time preaching my views to people. I do however like to go against these fools every now and then to rub salt in their wounds.
Most importantly there are still some good followers out there that still appreciate my work and those people are these reason why I decide to come back and post. So if you are one of those people and want me to start producing more content then start showing your support by doing the needful.
We all use social media these days, so you know what to do.
Currently there is not enough of a clear pattern for me to label the start of the third-of-a-third wave down but it's coming, so perhaps stay tuned and I may post something sooner rather then later.

Long Grayscale Crypto Altcoin Products GXLM Stellar Lumens ZcashXLM Price Live Data
The live Stellar price today is $0.107277 USD with a 24-hour trading volume of $104,424,569 USD. We update our XLM to USD price in real-time. Stellar is down 3.56% in the last 24 hours. The current CoinMarketCap ranking is #28, with a live market cap of $2,709,539,393 USD. It has a circulating supply of 25,257,395,966 XLM coins and a max. supply of 50,001,806,812 XLM coins.
The Zcash trust is the other top opportunity. Both Stellar and Zcash have good setup to provide near 100% moves in a fast manner

XLM: Pullback in UptrendStellar (XLM) technical analysis:
Trade setup : Following a breakout from a Falling Wedge pattern, price spiked up to $0.19 where it got very overbought (RSI > 75) and traders took profits (selling pressure). Now it’s pulled back to support of $0.12 and is oversold (RSI ~ 30), which could be a swing entry level.
Trend : Downtrend on Short-Term basis, Neutral on Medium-Term basis and Uptrend on Long-Term basis.
Momentum is Bearish (MACD Line is below MACD Signal Line, and RSI is below 45).
Support and Resistance : Nearest Support Zone is $0.130, which it broke, then $0.120, and $0.100. The nearest Resistance Zone is $0.190.

Stellar Lumens Fractal to $4.00XLM has not put in a new ATH in 4.5 years.
XLM has been in a bear market for 65 weeks.
We await the light.
1X10^(-27)LM

$XLM Targets 21¢- CUPDATE & HANDLELSE:XLM targets 21¢ with a Cup n' Handle Pattern
The target is the distance from the bottom of the cup to the top of the cup.
A 1.618 fib level from the bottom of the cup to the top matches the C&H target.
1X10^(-27) LM ☕🍵

🔥 XLM Falling! Triangle Break Out SignalI've been looking extensively at XLM over the last few weeks. In my previous analysis I was patiently waiting for a moment to enter long. In the end, my entry target has never been hit and my bias switched bearish.
As of today, XLM has seeming broken out of the triangle. Since it's a bearish break out, we're looking to short this token.
Stop above the most recent top, target at the lows just before the July pump.

🔥 XLM Triangle Break Out Soon: High Risk-Reward SignalXLM has seen some crazy volatility over the last two weeks. With XLM on the verge of breaking out, I'm anticipating that volatility will return and XLM will see new 2023 highs.
I'm waiting for the price to break out the triangle and close above 0.167 before considering an entry. Stop below the most recent swing lows, target at 0.30.

$XLM - CUP & HANDLE COMPLETE?XLM looks to have come close to completing a cup and handle.
Look for a breakout to claim support above 20¢
Tea-Time
Can you Handle it?

XLMUSD: Closing over the 1W MA200 can lead to 0.3200XLMUSD is on the third straight green 1W candle after the massive one that broke over the 1W MA200 for the first time in more than a year. However it closed the 1W candle under it, and so did last week's. Naturally, the uptrend needs a 1W candle to close over the 1W MA200 in order to confirm more upside.
The 1D timeframe is on healthy 1D technicals but 1W is overbought (RSI = 73.412, MACD = 0.010, ADX = 20.860) so failure to close above it, can deliver a pullback towards the 1D MA50 for one final buy entry.
Based on the price as well as the RSI pattern, the current trading sequence is comparable to the July-August 2020 1W MA200 tests. That gave the pullback but after it crossed over, the first target was the 0.618 Fibonacci level. That's now at 0.3200.
## If you like our free content follow our profile to get more daily ideas. ##
## Comments and likes are greatly appreciated. ##

Stellar (XLM) Rising to the NorthernTrend Bullish Signal
Stop at support
XLM’s price has hiked significantly over the last few years. Back in 2018-2019, it kept falling below its previous ATH of around $0.93 (recorded in early January 2018). It was only in 2021 that its price again rose, hitting a price level of over $0.7 around mid-May. However, as the cryptocurrency market collapsed in the second quarter of 2022, XLM went into a bearish dive.
At press time, XLM was changing hands at $0.088468, with a market cap of $2.1 billion.
Here’s when Stellar (XLM)price action will turn north
The price of Stellar Lumens (XLM) has dropped since the beginning of April and is in the process of creating its fourth consecutive bearish candlestick. Going by the general trend in the crypto-market right now, we should be prepared for more bearish movement from the token.
At press time, XLM was trading at $0.08848.
On April, Brazil’s central bank launched the pilot for its experimental central bank digital currency (CBDC). The test for Brazilian CBDC, Digital Real, is taking place on the Stellar blockchain network.
Soon thereafter, Pendulum announced the release of the Spacewalk bridge that connects the Polkadot infrastructure to Stellar’s blockchain so Polkadot can access fiat and stablecoin currencies. The Spacewalk bridge will allow Polkadot to access the entire infrastructure created by Stellar, especially that related to cross-border payments.
Stellar is today one of the best platforms for facilitating faster and easier international financial transactions. It is based on a decentralized on-chain protocol. Stellar users trade in Lumens (XLM) which is the platform’s native cryptocurrency.
Another important feature of Stellar is that individuals are more interested in Stellar than organizations, as it is a platform for small-amount payments. It is gaining popularity due to its simple user interface.
Stellar enables real-time transactions to occur anywhere in the world in as little as five seconds. A new smart contracts platform called Soroban has released its second preview. The upgrade intends to increase platform developer friendliness, scalability, and sensibility.
Last year, Ethereum transitioned from the proof-of-work (PoS) to proof-of-stake (PoS) consensus mechanism following the Merge. A major reason for this step was claimed to be the adoption of eco-friendly processes. In this regard, Stellar is very promising, as it has a smaller carbon footprint. Its authentication cycle is also fast, keeping energy use to a minimum.
Acting as a decentralized currency exchange, Stellar helps you track all of your assets with an order book. You can sell, buy and manage all of your assets here, with XLM acting as an intermediate currency for paying transaction fees. The currency is very useful for the users because it helps you reduce transaction costs.
Transactions on the Stellar platform are performed swiftly due to the ease of Lumens. The currency not only makes transactions seamless for the sender and the recipient but also ensures that transactions are secure.
Jed McCaleb, Co-founder, and CTO of Stellar said in an interview with CoinMarketCap that XLM is used in a fundamental way for the network.
XLM is listed on a number of crypto exchanges including Binance, eToro, Huobi Global, CoinTiger, FTX, and OKEx. This shows that the currency is an increasingly accepted choice of investors now.
A total of 100 billion XLMs were issued when the Stellar network was launched in 2015. In 2019, the group announced that it was burning over half of the cryptocurrency’s supply. Stellar mentions on its website that currently, there are around 50 billion XLMs in existence; 20 billion XLMs are in circulation and 30 billion XLMs are retained by the Stellar Development Foundation for project development. Nothing more will be created.
Where Stellar trumps other financial platforms is its low transaction fees, which have drawn a huge number of cryptocurrency users to it. It is one of the few blockchain networks that has been successful in collaborating with large tech corporations, such as Deloitte and IBM. Stellar, in partnership with IBM, launched a project that enables FinTech to engage in financial transactions using assets such as stablecoins.
It must be noted that Stellar is one of the large corporations that are operating in the cryptocurrency market. It is one of the most centralized cryptocurrency networks active on the internet. While the Stellar network uses decentralized nodes, it doesn’t have that many validators. Such an infrastructure gives the group a lot of control over the operations and price movement of XLM.
In 2016, Deloitte announced a partnership with Stellar, along with four other blockchain networks, to provide new technological capabilities to its global financial institution client base.
In June 2018, Fortune reported that New York financial regulators approved Stellar Lumens to trade on the Bit exchange, the first time the state’s authorities have given it the green light.
In October 2021, IBM partnered with Stellar to facilitate cross-border payments by banks. The system uses XLM as a bridge currency for transactions and it has been successful in the South Pacific region.
The same year, Moneygram announced a partnership with Stellar. Its integration with Stellar facilitates the conversion of the USDC stablecoin into cash and vice versa. The facility aims to encourage the liquidity of cryptocurrencies and the integration of traditional and cryptocurrency markets.
In October 2021, Flutterwave, a global payments technology company, also announced two new remittance corridors between Europe and Africa on the Stellar network. The step is a major step in Stellar’s expansion in the global market.
It also succeeded in receiving certification from the Islamic scholars of Bahrain in 2018, aiming to integrate the technology into the field of sharia-compliant financial products, reported Reuters.
“We have been looking to work with companies that facilitate remittances, including in the United Arab Emirates, Saudi Arabia, and Bahrain. It’s a huge market,” said Lisa Nestor, the then-director of partnerships at Stellar. Since the Middle East and South Asian regions are key areas of growth for the group, where a lot of countries are run on a sharia-compliant system, this is a major success for Stellar.
Developing economies are the focus of the Stellar network in the areas of remittances and loans. It primarily aims to target those who are still not part of the traditional banking system.
In June 2022, the global platform for modern money movement, Nium, and Stellar announced a partnership to enable payouts to 190 countries. “This integration truly drives home the value that blockchain-powered cross-border payment solutions bring to the current financial system,” said Denelle Dixon, CEO and Executive Director of the Stellar Development Foundation. “At SDF, we are always working to fill up the map and connect the network to more of the globe. Together with Nium, we are thrilled to expand the reach of the Stellar network so significantly.”
Another prominent feature of Stellar is that it gives power to the community to decide what project(s) the blockchain should focus on.
We will now briefly give an overview of the key performance indicators of XLM, such as price and market capitalization. We will then summarize what the world’s leading crypto-analysts have to say about the future of this currency, along with its Fear & Greed Index.
The market capitalization of the cryptocurrency follows its price trends throughout. In early January 2018, it was nearly $9 billion, and it skyrocketed to as high as $16.5 billion (May 2021) during the crypto-boom of 2021. In fact, it was performing fairly well in 2022 too, until the market crashed during the year’s second quarter.
Stellar has seen many growth spurts over the past few years, such as when Mercado Bitcoin announced its use of the platform. In less than a year, Stellar housed almost 3 million user accounts. Since that time, however, Stellar has built a network of partners that includes Flutterwave and MoneyGram.
The Stellar network is considered a rival to the Ripple network. While Ripple helps banks make fund transfers, Stellar helps individuals outside the banking system make fund transfers. Its simple, swift and economical process has made it very popular among users across several developed countries.
These developments are certain to boost Stellar’s credibility among the users and raise the price of Lumens. Besides, XLM is one of the most eco-friendly cryptocurrencies. Its consensus model is faster than both PoS and PoW, making it the preferred choice of many investors.
The unique features of Stellar such as strategic partnerships and convenience, make XLM one of the most reliable crypto investments. Its growth as a payments network will be the most important factor influencing the future of XLM.
Despite being embroiled in a legal dispute with the Securities and Exchange Commission (SEC), Stellar’s Lumens coin is a major cryptocurrency to wager on.
In June 2022, the system upgraded Protocol 19, building payment channels and key recovery channels. Stellar is also working on the Project Jump Cannon to facilitate a robust execution environment for smart contracts.
In 2022 itself, many crypto exchanges such as WhiteBIT, CoinMe, and Mercado Bitcoin enabled USD-backed stablecoin transactions, increasing the access to USDC on Stellar.
Coinbase Wallet announced in November 2022 that it will no longer support the XLM token, along with BCH, ETC, XRP, effective 5 December. Coinbase cited “low usage” as a reason for delisting the four coins.
The SDF has also established a $100 million fund to encourage developers to create applications for the Soroban smart contract platform. Soroban adds Turing-complete smart contracts to the Stellar blockchain, allowing developers to create new financial services rails on the network.
The Stellar Community Fund (SCF) has announced that 21 projects will receive funds as part of its 11th round. The required funding for the winning projects will be given to them in XLM tokens. The grants total more than 13 million XLM for the entire round.
South Korea’s leading cryptocurrency exchange, Upbit, announced the temporary suspension of deposits and withdrawals of the Stellar network’s native token, XLM, and other assets on the network. Upbit stated that the event was caused by the need for maintenance of the Stellar network and the wallets in it.
In March 2022, Stellar stated in its blog that it will launch Project Jump Cannon, an E&D venture to introduce native smart contracts for its blockchain. The same month, it also introduced the Starbridge project that would create bridges between Stellar and other blockchains, enabling interoperability.
Since December 2022, the Stellar network has been working with the United Nations High Commissioner for Refugees (UNHCR) to provide its blockchain payment solutions to those affected by the war in Ukraine.
In January 2023, Stellar (XLM) announced its decision to join the U.S. Commodity Futures Trading Commission (CFTC) Global Markets Advisory Committee (GMAC). It is important to note that the committee is composed of a diverse group of members with backgrounds in both traditional finance and cryptocurrency. As a result, Stellar’s (XLM) unique perspective on Layer 1 protocols may not carry the same weight as that of more established players in the space.
If Stellar continues to adopt more of such innovations and succeeds in building a larger community, it can prove to be a significant player in the crypto market.
The latest Fear & Greed Index projects a ‘fear’ market sentiment for XLM.

XLM Price Surge and Support LevelsXLM experienced a significant price increase in the past month, making it one of the top currencies in the market last week. The currency broke through the resistance level of $0.087 and then pulled back to that level before continuing its upward trend without breaking the short-term trend line. Positive news in the market caused the currency to surge with bullish spike candles. The price of Stellar rose by almost 100% and reached the resistance level of $0.19, resulting in a strong negative reaction. However, the price showed a positive response to the support level of $0.125 during a corrective wave. As long as this support level holds, we can anticipate further price growth towards the resistance area at $0.19.

Stellar XLM price entered the procurement zoneIf you believe in the bright future of the Stellar project and want to buy XLM, then we have good news for you.
The XLMUSDT price came to the liquidity zone of $0.65-0.85 in which it is justified to place "buy orders with a grid".
It seems that in general, the XLMUSD price is approaching the end of the falling trend
And purely theoretically, a good potential for growth will open
Here is 3 months ago, we painted and showed the trade history of Stellar for 8 years, who is interested, welcome:
_____________________
Did you like our analysis? Leave a comment, like, and follow to get more

STELLAR LUMENS (XLM) new volume 💣🚀💣Hello 🐋
we expect to see more gain for the price in log term targets 🚀💣
before more gain, we can see correction to the downside ❌🧨
Please, feel free to share your point of view, write it in the comments below, thanks 🐋

XLMUSD has started a parabolic rally to the former HighXLMUSD crossed last week over the 0.382 Fibonacci level and despited the subsequent pull back, it is again rising aggressively today.
The price action is very similar to the previous Cycle. When the price crossed above the 0.382 Fibonacci, it pulled back to the 0.236 and then started a parabolic rally that reached the 0.786 Fibonacci in 6 months.
Trading Plan:
1. Buy on the current market price.
Targets:
1. 0.48000 (Fibonacci 0.786).
Tips:
1. The price just formed a Golden Cross (1d), which is on the previous Cycle was formed right at the start of the Parabolic Rally.
Please like, follow and comment!!

#XLM/BTC 1D (Binance) Falling broadening wedge breakout & retestStellar Lumens is pulling back to demand zone where a bounce towards 200EMA would make sense, especially after a morning star.
⚡️⚡️ #XLM/BTC ⚡️⚡️
Exchanges: Binance
Signal Type: Regular (Long)
Amount: 12.6%
Current Price:
1) 0.00000317
Entry Targets:
1) 0.00000314
Take-Profit Targets:
1) 0.00000364
Stop Targets:
1) 0.00000289
Published By: @Zblaba
CRYPTOCAP:XLM #XLMBTC #Stellar #Lumens #P2P
Risk/Reward= 1:2
Expected Profit= +15.9%
Possible Loss= -8.0%
www.stellar.org

XRPUSD - LongWell this will be an interesting trade for sure - loads of Fundamental reasons, but... #crypto
I am long, I awaited a little break to the upside - which I see here.
I managed risk by the dollar amount I invested. No Stop at this level as I see insane movements could take me out.
No leverage was used.
I am actually new to stacking crypto assets - what a rabbit hole it is.
HODL - as they say.

AW XLM ANALYSIS - The End Of Corrections Suck People In...Welcome to this video where I analyze the waves and discuss the potential conclusion of a brief correction, indicating a possible end to the current bullish market trend. The alignment of waves suggests that the bullish alternative is unlikely. Although the timeline for the end of the bull run may vary, I anticipate it to be towards the end of next year. This weekend, I will thoroughly review and refine my analysis to strengthen my views and perspectives, emphasizing the crucial points of interest. Join me as we delve into this topic in depth.

Inv h&s on XLMUSD points to a .147 - .15 targetYou can see here on the 1 day chart xlmusd has formed an inverse head and shoulder pattern with it only just recently rounding out the 2nd shoulder and returning now back to the neckline. As always I must wait for a breakout confirmation above the neckline and some confirmation from volume before basing my buys off of this but I anticipate it will likely confirm in the not so distant future considering the recent move by coinbase to use stellar for USDC. I’m hoping to get a retracement too before a full breakout above the neckline in which case I will try to wisely piece meal buys on the dip. I have placed an arbitrary dotted measured move line where I think a potential breakout could occur in which case the target is somewhere aroun 14-15 cents. *not financial advice*

XLMUSD Above the 1W MA200 for the first time in more than 1 yearStellar (XLMUSD) hit and broke today above the 1W MA200 (orange trend-line) for the first time since the week of May 02 2022. That's more than 1 year of trading below a key long-term Resistance that is now broken. The 1W MA50 (blue trend-line) has supported this price action for the past 2 weeks.
The time XLM hit the 1W MA200 during the previous Cycle, it failed to close the week above it and had a medium-term pull-back to the safety of the 1W MA50 before it started the final part of the parabolic rally from October 2020 to May 2021. Notice that the 1W RSI then was on the exact same (overbought) level it is today.
As a result, if it fails to close above the 1W MA200, we will wait for a pull-back to buy, preferably as close to the 1W MA50 as possible. If it closes above the 1W MA200 though, we will buy on the market price. In either case, we will target the top (Higher Highs trend-line) of the multi-cycle Triangle pattern at 0.7000.
-------------------------------------------------------------------------------
** Please LIKE 👍, FOLLOW ✅, SHARE 🙌 and COMMENT ✍ if you enjoy this idea! Also share your ideas and charts in the comments section below! **
-------------------------------------------------------------------------------
💸💸💸💸💸💸
👇 👇 👇 👇 👇 👇

XLMUSDTHello Crypto Lovers, This is a 1D frame analysis for XLMUSDT After hitting the second support line, the price had a slight dip but the buying pressure pushed the price back up above the support line. Since then, the price has been able to gain 38% progress. Currently, the price is facing the first resistance line and there is a possibility of a correction if it fails to break above it today. However, if it is able to break above the first resistance line, we expect it to progress towards the second resistance line. Warning: This is just a suggestion and we do not guarantee profits. We advise you to analyze the chart before opening any positions. Take care
