Crypto Market Update - NANO/BAT/XLM/ICX/ENGSorry this video is so long, but I didn't feel like updating all of my charts right now. Also apologize for the noise - my laptop's fan was going crazy and I didn't feel like re-recording this (pretty tired). Hope it's helpful. Feedback is appreciated.
This is not financial advice. Just me rambling and talking about what I've been seeing in the market recently.
-Victor Cobra
Stellarlumens

XLM Stellar - Bullish divergence picking up, after BTC shakedown
This is Stellar XLM !
I’ve seen this going down and down and down for weeks. A couple of weeks ago, we saw this nice bullish divergence on the EFI and the MACD-H indicators.
It was going up pretty healthy and ready for a rally, only to be hit by BTC , which was barting down.
As a result, alts were hugely red, and XLM was no exception. It gave back the gains, but hung on the 0.08202 line, which became support the days after that.
It continued consolidating, and had a false breakout that broke the local 0.08202 support line.
After that, we tend to see a new uptrend, and since then the 21 day EMA is up, and prices are above the EMA with the EMA itself serving as support.
today we broke the previous high, tracing a new higher high, and supported with huge volume .
To me, this looks like a good chance for a reversal of this bearish trend , and starting of a new uptrend.
I will watch this closely and use my own system to scalp on the shor timeframes if I have time.
As always, my targets are flexible, and I will assess the situation. Targets are never fixed according to me, but to get an idea:
Entry: Around 0.10
Target 1 0.14158 A previous breakout, now being a possible resistance
Target 2 0.1863 Previous support zone
Stoploss 0.08635 Current EMA level. If we get down to this, I want to get out and reassess. It could be that we can then re-enter, if we bounce on this local support.
R/R Ratio
Target 1 1:3
Target 2 1:5,7

XLM weekly chart looks very good. Bullish breakout is imminent. XLM gave a green 1 according to Tom Demark count on the weekly chart. Stoch RSI is oversold on the weekly chart and MA7 level is broken. On the daily chart we have closed yesterday with a green 2 which is a clear buy signal. I expect a bullish breakout. First big resistance will be at weekly MA100 level which passes at: 2521. If it can break that level I expect the price continue to increase. You can find resistance and support levels on the chart.
Here is my trading idea:
Buy @ 2380-2410 TP1: 2500 TP2: 2700 SL: 2050
***This information is not a recommendation to buy or sell. It is to be used for educational purposes only.***


XLM Stellar Lumens buy zoneThis how u should waiting to make a buy or not buy.
Find support / Find Resistance / Find average movement zone and calculate % u could earn
Set ur alarm.
Make a test buy around support zone.
Set a stop loss -3% or keep power for a rebuy.
Keep an eye on BTC always.
don't blame yourself if u missed a buy, just wait for the next trade opportunity.
Patience always reward.
Happy Tr4Ding !

XLM - time to shortIt looks like a good opportunity to short.
You can take the profit on the target zone or wait a bit more for the touch of the downtrend line.

Buy the bottom.We are in short term strong oversold conditions.
Good moment to buy with low risk.
Buy area somewhere around current low. 2140-50. I think we will reach it one more time. So dont hurry to buy.
Lumen bottom thrustsome guy on twitter said lambos. no but honestly this thing is looking ready for some action. Just look at BTC recent action for the fractal information.

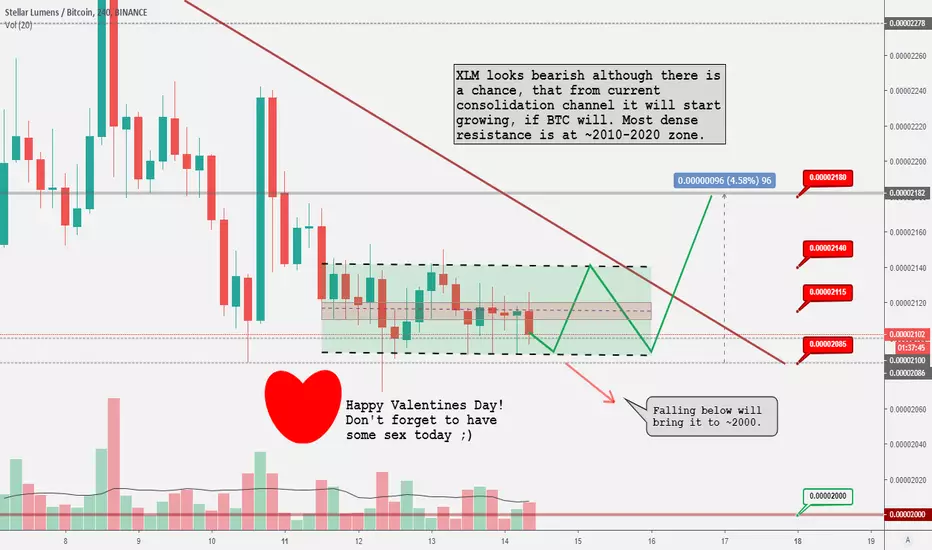
XLM chart updateNothing interesting here as Stellar is still in bear trend. On smaller 4H timeframe I can see consolidation channel with potential to go both sides. I'd recomend to stay away from XLM till it clearly show its direction.
XLMUSD Levels to tradePattern: Channel Down on 1D.
Signal: Bearish (1) as long as it trades below 0.1000. Bullish (2) if it breaks above 0.1000.
Target: TP(1) = 0.05555, TP (2) = 0.12750.

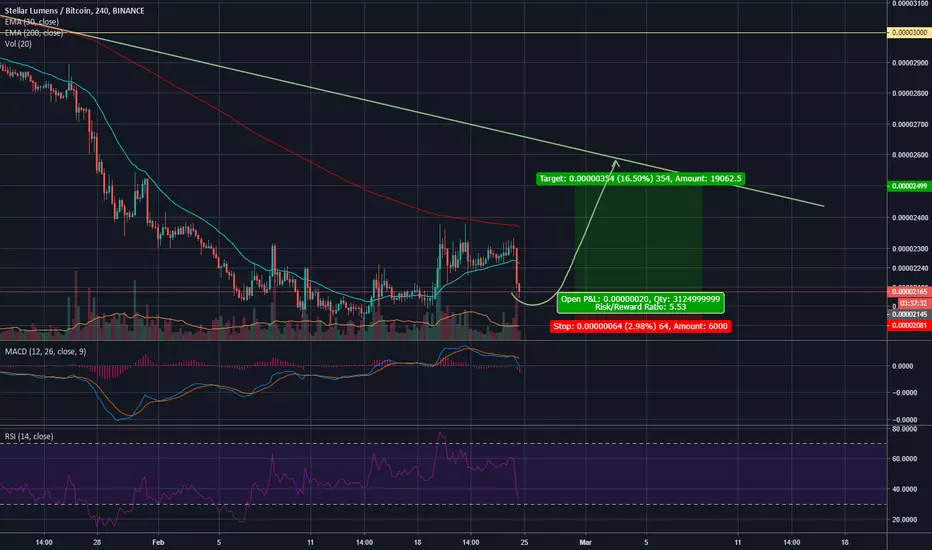
Stellar LumensLong time XLMBTC falling in falling wedge - reversal pattern.
Fundamental analisys
IBM plans to further expand its Stellar-based cross-border payment system, covering ‘a substantial portion of the world’. IBM has big plans for Blockchain World Wire, its Stellar-powered payment system that was launched in September. Jesse Lund, Head of Blockchain Solutions at IBM, has recently revealed in an interview that a ‘a lot of announcements are coming soon’, but he already spilled the beans on some important details that might make the XLM price shoot through the roof
u.today

XLM gives a descent lookBITTREX:XLMBTC
Very quick update on Stellar...
Giving a nice look while attempting to make consecutive higher highs. Showing confirmed support/resistance flip at ~2230. 4H Stoch crossing bullish, RSI looks okay.
Target would be swing high around 2550 for a scalp play. Solid R setup.
Twitter @BuellerFund

XLM Finally Bounces, and What This Means For The MarketTime for an update on one of my favorite coins. Unfortunately, XLM has truly suffered since the November breakdown. The good news is, we're finally bouncing. If you've been following me, you'll know that I suggested that XLMBTC would likely fall all the way towards 2000 after 3500 broke down. It's actually a good sign that we found decent support there, since it means that we haven't really broken our long term lower support on the Bitcoin ratio. We also made it to the 7 cents zone, which was the next level down I was looking at on the log chart once 11 cents broke.
From here, we can assume that we'll test at least the broken 2500 support as resistance. If that breaks, we'll probably test the major downtrend from the entire bear market (currently in the 3000-3100 area - my second green X). If that breaks as well, we will probably have a trend reversal for XLM. This coin has a history of making massive parabolic moves, so it would be good to pay attention to it. Despite the FUD, XLM is still once of the most widely used cryptocurrencies today, and it will likely attract some serious FOMO if the bull market returns.
Before we move up to 2500, however, we may have to test 2200ish again. A lot of alts are making some pretty wild up and down moves, which seems to be whale accumulation - flushing out retail sellers who are setting stop losses and taking supply from the market to make an eventual push up easier. This is just my bullish bias though. XLM has looked really weak recently, so it's always possible that we could just head back down. However, this current breakout has pretty massive volume, so I would give it some credibility. Additionally, I've seen XLM as a market leader during the bear market, and if we can have a sustained bounce that breaks some major resistances, it will be a good sign that the bear trend has ended (or is very close to ending).
This is not financial advice.
-Victor Cobra

XLM IS MOVING CORRECTLY LIKE PREVIOUS ANALYSISGood Day Everyone, Raxhel Here!
I hope u all in a green %,
I am interested with this coin since long time, waiting a great time to buy, and here it is, the bull is finally coming!
if you follow my analysis before, you are gaining pretty good money right now.
if you can see my the movement of stellar is persistently correct like my analysis.
before, I drew 4 resistance that has to break, and also, I drew where to buy (buy zone).
now stellar is about to break the 3rd resistance. for you day trader you should better consider this 4 resistance if you want still continue ur daily trading actively.
for long term investment, i would say stellar has possibility to go up to 102 % in the mid of april 2019.
Enjoy this simple analysis, I hope it is easier for u to follow the trade.
*remember, it is not your professional trading adviser, do not trade money that you cannot afford to lose, set your own stop loss, and be smart!
your like, comment and follow can increase my interest to update consistently :).
With Love,
;)
Raxhel.

Fly and flyStellarLumens (XLM) is an ancient coin. During the current downtrend in all major cryptocurrencies it crueshed hard. I'm looking forward to mooning BTC trend so StellarLumens could be one of top gainers in near future. Buy it in red box and sell it at the purple. Stop is under the red box.
May you all have nice profit and make the better world.


XLM/BTCthis looks juicy....I think my chart explains my trading outlook on this coin....2100 seems like a solid entry point with the descending triangle inside a descending triangle.....possibly wait for confirmation of the break of 2130 prior support/resistance for ultimate protection but I think this is pretty bullish.... set a safe 5% stop loss at 2k ezpz


STR/BTC XLM/BTC - Preflight Research -Technicals on the Chart.
For Education Only Please...
Longmoney
PS. TV has some scaling issues

Daily Bullish Signal $XLM #XLM (10 Feb 2019)RED ARROW indicates the EXPECTED Time and Targets
Level Stoploss point up to maximize profit and reduce risk
I'm working all the time, even in Bearish Market

$XLM Stellar Lumens downside target acquired!$XLM update
The descending triangle pattern breakdown, which I mentioned in previous posts, was able to reach the full measured target of 2250 sats, plus a bit deeper.
Price ultimately found what could possibly be its local bottom exactly where we bottomed in mid March, as you can see where the green horizontal line meets the deep March wick.
RSI dipped below 20, which is pointed out by the white circle. This level is the lowest daily RSI we've seen on XLM's chart history (Bittrex). While we did get some relief here, and the RSI is signaling drastically oversold, I'm not yet convinced that this is anything more than a dead cat. Price reached a point of bounce or face the potential of significantly greater downside. Lower TFS hinting that bulls could be tiring quickly, but Bitcoin looks better than it has in days, which could help. I'd be looking for lower TF RSI and Stoch RSI to reset before things looks interesting for longs.
Notably, you will see the diagonal dotted line where price found support. Although not perfect, this diagonal does have relevance as price has respected it for over a year, since its peak last January. Worth keeping an eye on.
Still flat, waiting for more info.
-Bueller
@BuellerFund

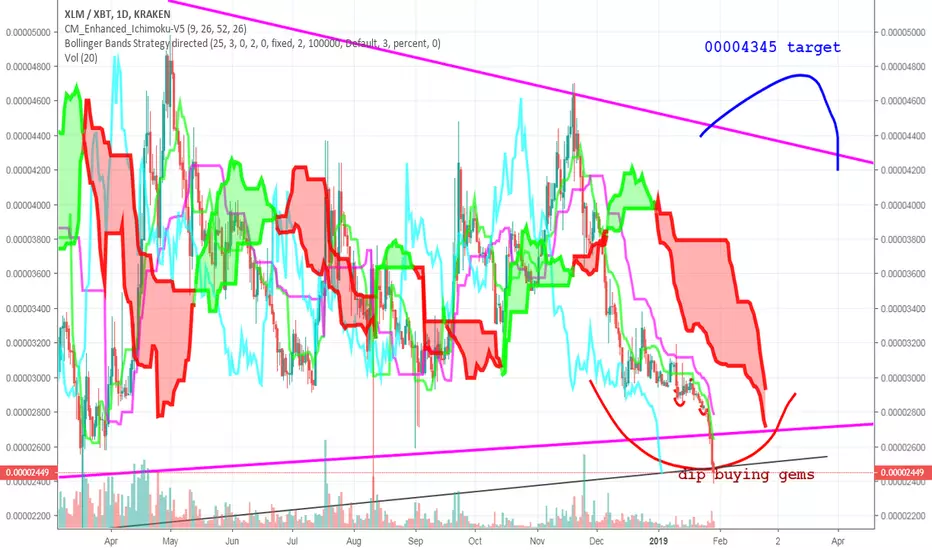
Parabolic Collapse - Dip Buying GemsNow Is The Moment For Fear Buying
play the swing back to 00002855 and 2990