#Stellar Lumens at 16-Month Low, will XLM Recover?Past Performance of Stellar Lumens
Steep losses in April pushed Stellar Lumens prices back to Q1 2022 lows as aggressive XL sellers reversed gains posted in March 2022. Currently, XLM has support, but sellers are still in control until there are conclusive reversal patterns confirming bulls. XLM is stable in the previous trading day versus the USDT, dumping eight percent week-to-date.
Stellar Lumens Technical Analysis
Although prices are stable, sellers are in control. XLM found support at around $0.17, flashing with March and Q1 2022 lows. Considering the significance of the support level, traders may wait for trend definition. Ideally, gains above $0.19 in the daily chart may signal a shift in trend, favoring buyers and unwinding sharp losses posted at the tail end of last week. Conversely, a wide-ranging bear breakout below the Q1 2022 low marks another pace, driving XLM to new 2022 lows. In this case, XLM may slide to January 2021 lows of $0.13.
What to Expect from XLM?
Current price action favors sellers. From the daily chart, XLM prices are in late 2022 territory, below 2021 lows. An unexpected breakdown at spot rates would see XLM bulls' hopes dashed.
Resistance level to watch out for: $0.19
Support level to watch out for: $0.13
Disclaimer: Opinions expressed are not investment advice. Do your research.
Stellarlumens

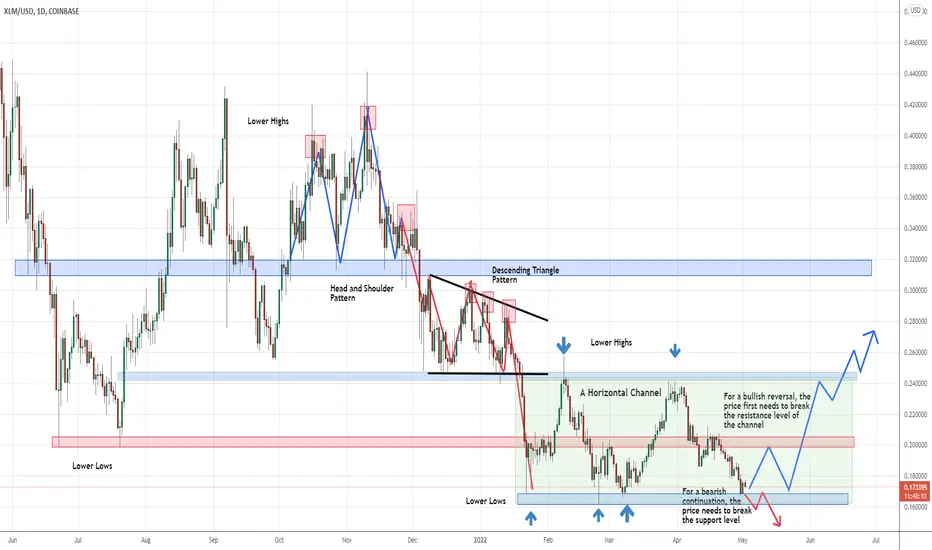
A Break From the Current Range Will Determine the DirectionStellar Lumens has been moving in a bearish trend since the summer of 2021, creating lower lows after periods of consolidation. Currently, the price is channeling in a horizontal range after breaking down from a descending triangle pattern early in 2022. The price now has once again arrived at the support level. For a bearish continuation, price needs to clearly break the support level of 0.1600. For a bullish reversal, price first needs to clear the resistance of the channel, which is 0.2400 level.
xlm possible target 0.2320xlm harmonic pattern target 0.2320 on 4h chart. Of course if btc lets.
Note: this is just an amateur work for practice. Do not take it as a financial advice. Do your own research please.

XLM Stellar Lumens: 1M Chart ReviewHello friends, today you can review the technical analysis idea on a 1M linear scale chart for Stellar Lumens (XLMUSD).
Stellar Lumens price on a monthly chart moved past the recent resistance and looks to head higher. Fibonacci Retracement levels shown along with 200 SMA and RSI.
If you enjoy my ideas, feel free to like it and drop in a comment. I love reading your comments below.
Disclosure: This is just my opinion and not any type of financial advice. I enjoy charting and discussing technical analysis . Don't trade based on my advice. Do your own research! #cryptopickk

XLM (Stellar Lumens) Coin Analysis 28/03/2022Fundamental Analysis:
Stellar is an open network that allows money to be moved and stored. When it was released in July 2014, one of its goals was boosting financial inclusion by reaching the world’s unbanked — but soon afterwards, its priorities shifted to helping financial firms connect with one another through blockchain technology.
The network’s native token, lumens, serves as a bridge that makes it less expensive to trade assets across borders. All of this aims to challenge existing payment providers, who often charge high fees for a similar service.
If all of this sounds familiar, it is worth noting that Stellar was originally based on the Ripple Labs protocol. The blockchain was created as a result of hard fork, and the code was subsequently rewritten.
Fees are a sticking point for many. However, high costs when making cross-border payments aren’t just exclusive to fiat-based payments solutions such as PayPal — transaction fees have also been known to go through the roof on the Bitcoin and Ethereum blockchains because of congestion.
Stellar is unique because every transaction costs just 0.00001 XLM. Given how one unit of this cryptocurrency only costs Les than a cent at the time of writing, this helps ensure that users keep more of their money.
Few blockchain projects have managed to secure partnerships with big-brand technology companies and fintech firms. A few years ago, Stellar and IBM teamed up to launch World Wire, a project that allowed large financial institutions to submit transactions to the Stellar network and transact using bridge assets such as stable coins.
Although other blockchains have community funds, meaning that grants can be given to projects that help further the ecosystem, Stellar allows its users to vote on which ventures should be given this support.
This network is secured using the Stellar Consensus Protocol, which is described as having four main properties: “Decentralized control, low latency, flexible trust, and asymptotic security.”
Through SCP, anyone is able to join the process of achieving consensus, and no single entity can end up with the majority of decision-making power. Transactions are also confirmed cheaply and within a few seconds — and safeguards are in place if bad actors attempt to join the network.
Jed McCaleb founded Stellar with the lawyer Joyce Kim after leaving Ripple in 2013 over disagreements about the company’s future direction.
In explaining the rationale behind Stellar in September 2020, McCaleb Announced “The whole original design of Stellar is that you can have fiat currencies and other kinds of forms of value run in parallel with each other and with crypto assets. This is super important to drive this stuff mainstream.”
McCaleb’s goal is to ensure that Stellar can give people a way of moving their fiat into crypto — and eliminate the friction that people normally experience when they are sending money around the world.
He currently serves as the CTO of Stellar, as well as the co-founder of the Stellar Development Foundation. This not-for-profit organization aims to “unlock the world’s economic potential by making money more fluid, markets more open, and people more empowered.”
A total of 100 billion XLM were issued when the Stellar network launched in 2015 — but things have changed since the release date. At present, the total supply stands at 50 billion XLM, and the circulating supply is currently 24.69 billion.
In 2019, the Stellar Development Foundation announced that it was burning over half of the cryptocurrency’s supply. This means that it now controls approximately 30 billion XLM. While some of this capital is earmarked for marketing and helping the organization develop, about one third is reserved for making investments in other blockchain ventures.
Explaining why it took this drastic move — and promising not to burn any more XLM in the future — the foundation explained: “SDF can be leaner and do the work it was created to do using fewer lumens… Those 55.5 billion lumens weren’t going to increase the adoption of Stellar.”
The current CoinMarketCap ranking is #31, with a live market cap of $5,747,715,926 USD. It has a circulating supply of 24,687,940,800 XLM coins and a max. supply of 50,001,806,812 XLM coins.
Technical Analysis:
The Asset is currently at the 78.6% Fibonacci Retracement Zone which is Hypothetically the Golden zone for the Illiquid Assets. it is a very Powerful Accumulation zone and we can observe the smart money inflow, eventually Big Impulsive wave thus start of the new cycle.
There exist the Regular Bullish Divergence of Price Value from MACD, which is the very Significant sign of Bearish Trend Reversal eventually Start of the new Bullish Trends.
As the price value Start its Bullish trend From these kind of Discounted Zones such as Fib 78.6% or lower, we can Rationally expect the ATH to be easily Achievable and ultimately developing the new cycle thus new ATH.
There are Total of 3 Targets defined by the Average Confluences of the Fibonacci Expansion and Fibonacci Trend Base Extension. these confluences Points can even be counted as the Major Pivot Points.
The 3 TP gets its confirmation as the Bullish trend Triggers the 2 TP followed by some Price correction and Reaccumulation. on its Up Formation rally.

XLMUSD Could Go Parabolic with a 3,000+ Percent Potential Gain! The last time XLM was this bullish it rallied 3,000% back in 2020 in roughly 365 days. If this were to hypothetically happen again, then we would reach roughly $7.00+ a coin. The stellar foundation is a major player in the crypto space and totally overlooked in my opinion. Read more about their project here: www.stellar.org
#thedailyinvestor

XLM LONG TERM.XLM long term prediction. " Stellar is an open-source network for currencies and payments. Stellar makes it possible to create, send and trade digital representations of all forms of money—dollars, pesos, bitcoin, pretty much anything. It’s designed so all the world’s financial systems can work together on a single network." (source: www.stellar.org)

XLM breaks bearish channel - Bullish price actionXLM has broken upward from its bearish channel. EMA9 is converging on EMA50; crossover would be nice confirmation, but it's probably worth a long position at this stage already. Set tight stop loss because you never know what Putin will do next to spoil the party.

XLM are you ready?We still have 1 or 2 days. If the green candle manages to close above the orange resistance, historical resistance, and break the blue descending trendline that we have been carrying with us since May 2021, well, I'm positive for the future.

BIG PictureJune 1st, 2023 is the 1:1 time extension from wave A. That means that around that date, we may be at a very good price to buy. It doesn't need to do a full extension, but harmonics usually like these things to line up in some relative fashion. This is why we use the fibonacci sequence. I've noted some relative buy zones in the green boxes. Laddering buys is usually recommended by professionals.
Alright now let me first say that I think Stellar is the real deal, and for good reason. They are one of the only projects completely focused on developing their regulatory compliance while innovating on the network and encouraging new developers to work with them. The "Clawback" (Transaction Reversal) technology is next level, and not something that other blockchains are capable of doing right now. This is a big step in maintaining compliance and being able to actually integrate with conventional regulatory backdrops. Stellar is the dark horse in crypto.
Now, that being said, Biden just released his executive order on crypto.
We are seeing more headwinds than tailwinds right now, so I expect there to be more price declines as exchanges leave and projects shut down that cannot comply with regulatory requirements*. I will note that we are already seeing announcements of projects (YFI/USDT) shutting down 25 apps/projects with seemingly no notice or good reasoning besides the fact that the developers just got bored! That's Not Good! It seems the fakes and non-committed projects are going to start cracking and running away so be careful out there.
The stock market and bond markets are beginning crashing. This first leg down the bias has still been positive, but now the "buy the dip" mentally is fading and prices at the grocery stores and pump are going up!
The market bias is now starting to flip bearish which will drive the major indices tumbling as the Fed starts raising rates. This all will drive crypto lower as liquidity leaves the systems. I expect you will all see prices you never thought you would see again, but I can't guarantee that.
My advice to any holders is HODL, as long as you're not using leverage or loans or anything. Like I said, prices could fall extremely dramatically because the levels of liquidity via margin debt and leverage that is in the system right now is unprecedented. You need to remember though that if you're a long term holder, this is not a project you should be selling ever IMO. I expect XLM to go to $30 over the next 10 years, so this is gonna be a ride of a lifetime if you can hold on throughout.
This is not trading or financial advice. I'm not telling you to sell any XLM or buy any. I am saying that it could go to 8 cents or maybe even 4 or 5 cents and if it does...I would borrow and invest Heavily at that point.

XLM/USD - Static/Dynamic SR LevelsCurrent outlook on XLM/USD pair using both static and dynamic SR trendlines. Reversal incoming??

Potential Bullish Setup? Looks About RightDynamic and static major support + falling wedge pattern. Downtrend is starting to squeeze…

Final Moments To Catch Stellar Lumens XLM At This SupportHi friends, hope you are well, and welcome to the new update on XLM.
Falling wedge:
On a daily time frame, XLM is bounced from the support of falling wedge pattern with bullish divergence.
Broke out broadening wedge and a re-test:
On a 4-hr time frame, Stellar broke out the resistance of a broadening wedge. Now the priceline is testing the resistance of this wedge as support. There is also a 50 simple moving average support as well.
Tested strong support:
On a weekly time frame, XLM has already tested the $0.18 support and is also likely to form a double bottom as well. Once the priceline will be able to breakout the resistance of the falling wedge
which is formed on a daily time frame then it can reach the big resistance of $0.44.
Conclusion:
If XLM successfully re-tests the resistance of broadening wedge as support and starts a bullish reversal move from here, then there will be a high probability for the breakout from the falling wedge as well.

Stellar Lumens XLM Big Double Bottom With Bullish DivergenceHi friends, hope you are well and welcome to the new update on XLM.
Broadening wedge:
On a 4-hr time frame,XLM has reached the resistance of broadening wedge:
Falling wedge and bullish divergence:
On a daily time frame, Stellar has bounced from the support of a falling wedge. There is also bullish divergence flashed, as the priceline is forming lower low and RSI is setting higher low.
Double bottom formation:
The priceline is also forming a double bottom at $0.18 support.
Conclusion:
If the priceline of XLM breaks out broadening wedge, on a 4-hr time frame, then there will be a high probability for the breakout from the bigger falling wedge pattern.
Note: Above idea is for educational purpose only. It is advised to diversify and strictly follow the stop loss, and don't get stuck with trade

XLM Scalp SignalStellar is healthily bouncing off the trend line, which makes for a quick scalp in the 4 Hourly time frame.

$XLMUSDT - Possible rebound hereHello everyone!
Waiting for Stellar to close above this level, which is 0.786 of the last impulse wave.
Best of luck with your trades.

XLM Moon ShotAccording to Elliot Wave Theory: The 5th wave, if the longest, typically travels 1.618 the distance of from the start of wave 1 thru the end of wave 3. That puts us around $18.00 for the top of this bull run.
elliottwaveplus.com

XLM short play- Broke through crucial support and is consolidating below it.
- No support up until $0.12
- EMA's curling away from each other, signaling more downward movement might be on the horizon

Stellar (XLM) Foldback Pattern suggest a major price spike is inFoldback Patterns are a theory that price action repeats the same swing structure as the past. In the case of XLM, the Foldback Pattern with the combination of a 180-day Gann Cycle suggests that a big price spike for XLM is likely to occur very soon.

XLMUSD Accumulation almost over. Look for a 1D MA200 break.Stellar got rejected at the end of December on the 1D MA200 (orange trend-line) and that stopped the rebound from developing into a full rally sequence. That is the Resistance to beat if XLM wants to see a new bullish phase. Practically the pattern from late June until now seems like a giant Accumulation Phase and both in price action and 1D RSI terms is similar with that of April - November 2020.
It was a 1D Death Cross (MA50 crossing below the MA200) that started the Accumulation Phase and another that priced its bottom and ended it. The Golden Cross (MA50 crossing above the MA200) was formed on the peak of the first price rally, so it just confirmed it. Right now XLMUSD is coming off that second Death Cross, so we can argue that the bottom may already be priced in. The confirmation however will come in my opinion once the 1D MA200 breaks, so if you don't want to risk buying now, then buy upon a break-out.
--------------------------------------------------------------------------------------------------------
** Please support this idea with your likes and comments, it is the best way to keep it relevant and support me. **
--------------------------------------------------------------------------------------------------------


XLM CUP(date) ON THE HANDLE - THE NEW(est) ANGLEXLM CUP(date) ON THE HANDLE - THE NEW(est) ANGLE
An update to my CUP & HANDLE ideas for XLM
These are just my angles on the pattern...
By no means the final survey...

XLM CUP(date) ON THE HANDLE - THE NEW(est) ANGLEXLM CUP(date) ON THE HANDLE - THE NEW(est) ANGLE
An update to my CUP & HANDLE ideas for XLM
These are just my angles on the pattern...
By no means the final survey
Sorry to spam the idea so much, i mess up alot before posting... i think i handle arc right now..jeesh
