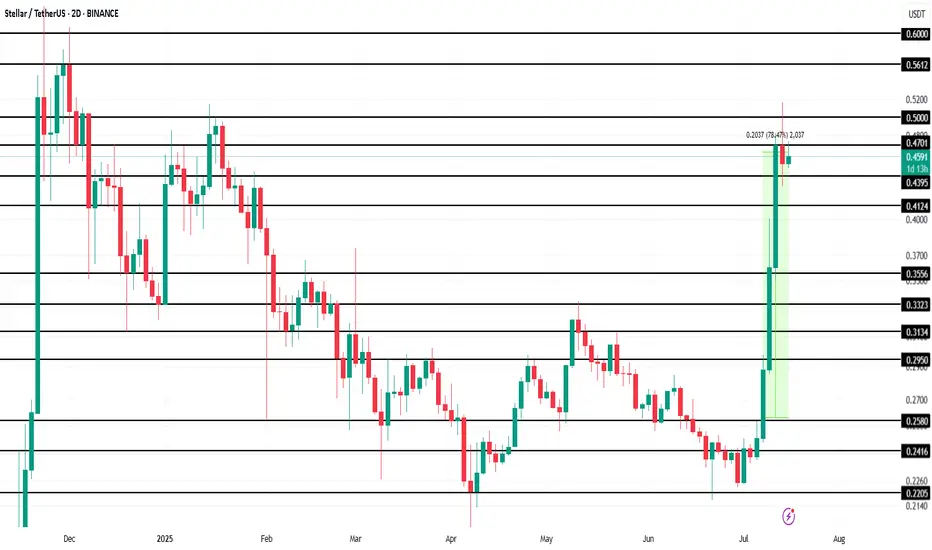
Stellar (XLM) Makes History Amid 78% Price Surge This WeekBINANCE:XLMUSDT is currently trading at $0.46, up 78.5% over the past week . However, the altcoin faces resistance at $0.47, a level it has struggled to breach in recent days. The ability to break this resistance is crucial for continued growth, as it will determine whether XLM can push higher.
BINANCE:XLMUSDT futures market activity has also surged, with Futures Open Interest hitting an all-time high of $520 million in the last 24 hours. This indicates that traders are increasingly interested in the asset's derivatives, which are capitalizing on its rise.
Given the strong sentiment from futures traders and the technical indicators, it is likely that BINANCE:XLMUSDT will push past the $0.47 resistance and target $0.50 in the coming days . A successful breakthrough could lead XLM toward its next target at $0.56, marking an eight-month high. This would signify continued strength for the asset.
However, if the broader market sentiment shifts or investors begin to sell their holdings, BINANCE:XLMUSDT could face a significant pullback. If the price falls below the key support levels of $0.43 and $0.41 , it could slide further to $0.35, which would invalidate the current bullish outlook.
Stellarusd
XLM will be one of the big winners during the coming breakout!XLM, which has historically traded closely with XRP, will be one of the big winners during the upcoming breakout in May—potentially continuing into June, July, and even August.
Good luck, and always use a stop-loss!

"Stellar vs Tether" Crypto Market Heist Plan (Swing Trade)🌟Hi! Hola! Ola! Bonjour! Hallo! Marhaba!🌟
Dear Money Makers & Robbers, 🤑 💰💸✈️
Based on 🔥Thief Trading style technical and fundamental analysis🔥, here is our master plan to heist the XLM/USDT "Stellar vs Tether" Crypto Market. Please adhere to the strategy I've outlined in the chart, which emphasizes long entry. Our aim is the high-risk Red Zone. Risky level, overbought market, consolidation, trend reversal, trap at the level where traders and bearish robbers are stronger. 🏆💸"Take profit and treat yourself, traders. You deserve it!💪🏆🎉
Entry 📈 : "The heist is on! Wait for the MA breakout (0.2900) then make your move - Bullish profits await!"
however I advise to Place Buy stop orders above the Moving average (or) Place buy limit orders within a 15 or 30 minute timeframe most recent or swing, low or high level.
📌I strongly advise you to set an alert on your chart so you can see when the breakout entry occurs.
Stop Loss 🛑:
Thief SL placed at the recent/swing low level Using the 2H timeframe (0.2600) swing trade basis.
SL is based on your risk of the trade, lot size and how many multiple orders you have to take.
🏴☠️Target 🎯: 0.3400 (or) Escape Before the Target
🧲Scalpers, take note 👀 : only scalp on the Long side. If you have a lot of money, you can go straight away; if not, you can join swing traders and carry out the robbery plan. Use trailing SL to safeguard your money 💰.
XLM/USDT "Stellar vs Tether" Crypto Market Heist Plan (Swing Trade) is currently experiencing a bullishness,., driven by several key factors.
📰🗞️Get & Read the Fundamental, Macro, COT Report, On Chain Analysis, Sentimental Outlook, Intermarket Analysis, Future trend targets.. go ahead to check 👉👉👉
📌Keep in mind that these factors can change rapidly, and it's essential to stay up-to-date with market developments and adjust your analysis accordingly.
⚠️Trading Alert : News Releases and Position Management 📰 🗞️ 🚫🚏
As a reminder, news releases can have a significant impact on market prices and volatility. To minimize potential losses and protect your running positions,
we recommend the following:
Avoid taking new trades during news releases
Use trailing stop-loss orders to protect your running positions and lock in profits
💖Supporting our robbery plan 💥Hit the Boost Button💥 will enable us to effortlessly make and steal money 💰💵. Boost the strength of our robbery team. Every day in this market make money with ease by using the Thief Trading Style.🏆💪🤝❤️🎉🚀
I'll see you soon with another heist plan, so stay tuned 🤑🐱👤🤗🤩

XLMUSDT, We are near buy zone areaHello everyone
According to the chart that you can see , the price is in correction wave and we think the price should come and do the end of corretion in buy zone area and after that is ready to move up , you can buy in 2 part in each of the buy zone area and after that at least 50% percent profit is near to us.
Be lucky
AA

XLM charts with April 'flash crash' thesis zones.Here's my latest XLM chart, which includes potential levels that could be hit, along with an alternative path for the 5th wave, assuming the bottom is already in on the chart.
- If wave 4 is already complete, then the wave 6 "flash crash" low would likely be higher than the chart shows.
- If wave 4 isn't complete, then the wave 6 "flash crash" would likely sweep that low, prior moving into the real breakout beginning in the month of May.
- The real breakout, the 7th wave, would likely take out the previous pattern high making a run for what could potentially become a new all-time high in XLM.
Keep in mind that the "flash crash" in April is a theory and may not come to fruition or could be off in timing. However, I do believe that the breakout will begin in May, even if the "flash crash" does not occur in mid to late April as I've theorized.
Good luck, and always use a stop loss!

XLM is going to put some smiles on people's faces very soon!The XLM chart appears to be showing some serious potential for growth. Currently trading within a descending wedge pattern and displaying a 5th wave internal wave count, XLM could outperform many people's expectations if the 5th wave plays out. Although many people tend to prefer XRP over XLM, I wouldn't count it out just yet, as—with recent price increases—it has potentially become more desirable compared to XRP due to its lower entry price range. As we know, many people don’t have a lot of extra cash just lying around nowadays.
Good luck, and always use a stop loss!

$3.00 + XLM by September is very likely! It's no mystery that XLM and XRP often trade like they are family. Much like an older brother, XRP generally paves the way for XLM—the younger sibling—and the two share a similar charting structure. However, since the "Trump election pump," although both have broken out, XLM has yet to break above the upper trendline of the current wedge pattern. This leads me to believe that we may soon see XLM surprise everyone. Instead of following, it may take the lead this time by breaking out of the wedge pattern, setting a new all-time high, and then entering price discovery along with its older brother, XRP. Together, they will likely lead the entire crypto market, as they are two of the ISO 20022-compliant tokens with the most potential for widespread adoption.
Keep an eye on XLM—I believe it will not only play catch-up but may even lead XRP and the broader crypto market in the next leg up.
Good luck, and always use a stop-loss!

Will there be one more liquidation candle for XLM?XLM closely follows XRP's price action. Many investors, traders, and speculators understand that this relationship can provide distinct advantages at times, depending on market circumstances. However, it appears that XLM may have one more liquidation event in mind before the next leg up. Although there is no guarantee that this will occur, I believe it is very likely, as the weak doji candle—currently at the $0.23 cent level—would allow another liquidation event to clear the last remaining remnants of sell-side liquidity currently resting below the previous liquidation candle. I could be wrong, but this is an area to keep your eyes on in the event that the price continues to move downward.
Good luck, and always use a stop-loss!

Stellar (XLM) Price Breakout Fuels 30% Surge Hopes
Stellar Lumens (XLM), the cryptocurrency designed to facilitate fast and low-cost cross-border payments, has recently shown signs of a potential breakout, sparking speculation about a significant price surge. After a period of relative stagnation, XLM has demonstrated renewed momentum, capturing the attention of traders and investors alike. This article delves into the factors contributing to this potential breakout, examines technical indicators, and explores whether a 30% surge is a realistic possibility.
Stellar’s core mission is to provide an efficient and inclusive financial ecosystem, particularly for underserved populations. It aims to streamline international transactions, making them faster, cheaper, and more accessible than traditional banking systems.1 This focus on real-world utility has always been a strong foundation for XLM, and recent developments suggest this utility is beginning to translate into market action.
Factors Driving the Potential Breakout:
Several factors contribute to the current bullish sentiment surrounding XLM:
• Increased Network Activity: A key indicator of a healthy blockchain network is its level of activity. Recent data suggests a significant uptick in transactions on the Stellar network. This increased usage indicates growing adoption and demonstrates the platform’s real-world utility. This increased activity could be attributed to new partnerships, integrations with existing financial institutions, or the organic growth of its user base.
• Growing Institutional Interest: While not as prominent as Bitcoin or Ethereum, Stellar has been quietly attracting institutional interest. Its focus on regulated financial services and its compliance-friendly approach make it an attractive option for institutions seeking to explore the potential of blockchain technology. Increased institutional involvement often translates to larger trading volumes and can significantly impact price action.
• Favorable Regulatory Landscape: The regulatory landscape for cryptocurrencies is constantly evolving. Positive regulatory developments, particularly those related to cross-border payments and digital assets, can create a favorable environment for projects like Stellar. Clearer regulations can foster greater confidence among investors and encourage wider adoption.
• Technical Indicators: From a technical analysis perspective, XLM has shown promising signs. Recent price action has seen XLM break through key resistance levels, suggesting a shift in momentum.2 Trading volume has also increased, further supporting the bullish narrative. Several technical indicators, such as moving averages and relative strength index (RSI), point towards a potential upward trend.
• Focus on Decentralized Finance (DeFi): While Stellar isn't primarily known for DeFi, the network has seen increasing development in this sector. The growth of DeFi applications on Stellar could attract new users and capital to the ecosystem, further driving demand for XLM.
Technical Analysis and Price Prediction:
Analyzing XLM's price charts reveals a potential breakout pattern. The price has been consolidating within a defined range for a period, and the recent break above this range suggests a potential shift towards an upward trend. This breakout is further supported by increased trading volume, indicating strong buying pressure.
Several technical indicators suggest a bullish outlook:
• Moving Averages: The price of XLM has crossed above key moving averages, such as the 50-day and 200-day moving averages, which are often interpreted as bullish signals.
• Relative Strength Index (RSI): The RSI, a momentum indicator, is showing increasing strength, indicating growing buying momentum.
• Volume: The increased trading volume accompanying the price breakout provides further confirmation of the bullish trend.
Based on these technical indicators and the current market momentum, a 30% surge is a plausible scenario. However, it’s crucial to remember that the cryptocurrency market is highly volatile, and price predictions are not guaranteed.3 Several factors could influence XLM’s price action, including overall market sentiment, regulatory developments, and competition from other cryptocurrencies.
Is a 30% Surge Realistic?
While the technical indicators and fundamental factors suggest a potential for significant price appreciation, a 30% surge should be considered a potential target rather than a certainty. The cryptocurrency market is known for its volatility, and unforeseen events can quickly change market sentiment.4
Conclusion:
Stellar’s XLM is showing promising signs of a potential breakout. Increased network activity, growing institutional interest, favorable regulatory developments, and positive technical indicators all contribute to the bullish sentiment. While a 30% surge is a realistic possibility based on current trends, investors should exercise caution and conduct thorough research before making any investment decisions. The cryptocurrency market is highly volatile,5 and it’s essential to manage risk effectively.6 However, the current momentum surrounding XLM suggests that the project is well-positioned for future growth and could offer significant potential for investors. The focus on real-world utility and the development of the Stellar ecosystem continue to be key factors to watch in the coming months.

XLM and XRP 's breakout#xlm #stellar price has just made a breakout of the falling trend and it seems CRYPTOCAP:XLM is heading to a retest. A successful retest will likely ride #xlmusd to the impulsive wave.

xlmI'm hoping this area is green, and if it can't hold, we should come and check further down in the purple lines.

Stellar (XLM) - Key Levels! Nov, 2024Key Support & Resistance Levels:
🟢Support Zone= $0.41 - $0.44
🔴Resistance Level= $0.537
⚠️Major Resistance= $0.637
If resistance levels are met and a candle close fails to break through them, there could be a short-term pullback or consolidation. Furthermore, if not, price action holds above the current support zone. Expect a further continuation to the downside in the short term.
‼️Next Line of Support if bulls fail to hold pressure against bears:
= $0.332

XLM going to $0.15 and then crashing over 40% ( BELOW $0.10 !!!)Hey,
It's all in the chart.
- Please like/boost if you agree and comment as it encourages me to continue sharing my ideas - My thoughts are not financial advice - Consult with a registered investment advisor before making any investment.
Bye for now,
@BeYour0wnBank

XLM to .135 USD short termXLM is approaching a trendline that begins at the 2018 ATH
we should expect some resistance here and for short term traders this could be a good tp
if your a long time stellar holder, hang on, as you can see we there is about to be alot of upside in 2025

Long Position on XLMUSDT / Volume ProjectionBINANCE:XLMUSDT
COINBASE:XLMUSD
SL2 ---> Mid-risk status: 5x-8x Leverage
SL1 ---> Low-risk status: 3x-4x Leverage
👾The setup is active but expect the uncertain phase as well.
⚡️TP:
0.1045
0.1055
0.1070
0.1085
0.1100
0.01112(In Optimistic Scenario)
➡️SL:
0.0977
0.0955
🧐 The Alternate scenario:
🔴If the price stabilizes below the trigger zone, the setup will be cancelled.

Ripple “protégé” - Stellar is also trying to rise in XLM priceWhile encouraging news is starting to circulate around #Ripple and the price of OKX:XRPUSDT is slowly getting off its knees, by the way, a month ago we came up with an idea for CRYPTOCAP:XRP 👇
The #Ripple “protégé” #Stellar is also trying to rise in price a bit.
For two years, the OKX:XLMUSDT price probably formed a Double Bottom pattern. And for the next 1.5 years, the #XLMUSD price will be able to work out the goals of the pattern:
1️⃣ target - the base of the Double Bottom - $0.195
2️⃣ target - growth in the region of $0.64-0.65 for CRYPTOCAP:XLM by the end of 2025.
But under the current conditions, we do not believe that CRYPTOCAP:XRP can cost $10, and CRYPTOCAP:XLM more than a dollar. Unless they arrange denomination in projects 10-100 times or something?)

XLM/USD: Recent Bearish Candle on 45-Minute Timeframe Stellar Lumens (XLM), the cryptocurrency known for its fast and inexpensive cross-border transactions, has recently displayed a bearish candle on the 45-minute timeframe. This has sparked some worry among traders, prompting questions about a potential downturn for the XLM/USD pair. Let's delve into this recent development and analyze its significance within the broader context of XLM's price movement.
Understanding the 45-Minute Chart
The 45-minute timeframe offers traders a short-term view of the market, focusing on price movements over a 1.5-hour interval. It allows for a more granular analysis compared to daily or weekly charts but provides less historical context than longer timeframes. A single bearish candle on the 45-minute chart signifies a price drop within that specific timeframe. However, its significance depends on several factors.
Dissecting the Bearish Candle
The interpretation of the bearish candle hinges on its characteristics. Here's what to consider:
• Candle Size: A large bearish candle with a significant price drop carries more weight than a small one with a minor price movement.
• Volume: High trading volume accompanying the bearish candle indicates stronger selling pressure, potentially amplifying the downtrend.
• Position in Trend: If the bearish candle appears during a downtrend, it reinforces the bearish sentiment. Conversely, a bearish candle following an uptrend might be a short-lived pullback.
Is this a Sign of a Trend Reversal?
A solitary bearish candle on the 45-minute timeframe shouldn't be interpreted as a definitive sign of a trend reversal. Here's why:
• Short Timeframe: The 45-minute timeframe captures a limited snapshot of price movement. Broader trends are often better identified on daily or weekly charts.
• Market Noise: Short-term price fluctuations can be caused by various factors, including random market noise or temporary imbalances in supply and demand. These may not translate into a sustained downtrend.
Looking at the Bigger Picture
To assess the potential impact of the bearish candle, it's crucial to consider the following:
• Overall Market Sentiment: Is the broader cryptocurrency market experiencing a correction, or is the bearish candle specific to XLM?
• Technical Indicators: Analyze technical indicators on higher timeframes (e.g., daily charts) to identify potential support and resistance levels.
• Fundamental Factors: Are there any upcoming events or news stories that might influence XLM's price?
What to Do?
Traders with open XLM positions should monitor the situation closely. Here are some possible actions:
• Hodl (Hold On for Dear Life): If you believe in XLM's long-term potential, consider holding your position and waiting for the market to stabilize.
• Set Stop-Loss Orders: Setting stop-loss orders can help mitigate potential losses if the price continues to decline.
• Increase Investment (For the Bold): If your risk tolerance permits and you believe the bearish candle is a temporary blip, this could be a buying opportunity. However, exercise caution and only invest what you can afford to lose.
Conclusion
The recent bearish candle on the XLM/USD 45-minute timeframe is a cause for short-term observation, not necessarily panic. Analyze the broader market trends, technical indicators, and relevant news to make informed trading decisions. Remember, cryptocurrency markets are inherently volatile, and short-term fluctuations shouldn't overshadow XLM's long-term potential as a utility-driven cryptocurrency.

XLM (Stellar) Technical Analysis and Trade Idea 📈🚀Taking a comprehensive view of XLM (Stellar) , we observe a prevailing bullish trend, particularly evident when analyzing the weekly charts. Although there was a recent minor downturn, the daily chart exhibited bearish movements. However, the overall sentiment is optimistic once again. Notably, we’ve identified bullish price action—a decisive break in market structure on the 4-hour timeframe—which could potentially shift the 4-hour trend to bearish in trhe short term before it continueds bullish. In our video, we delve into trend analysis, explore price action dynamics, dissect market structure, and introduce key technical analysis concepts. Toward the video’s conclusion, we present a trade idea. It’s essential to emphasize that this information serves educational purposes only and should not be construed as financial advice. 📈🚀📊

Another look at the XLM chart.The current XLM chart leaves plenty of room available for major gains over the next 6 months to a year. XLM generally runs with XRP.
Good luck, and always use a stop-loss!

XLM will likely drop an additional 25% before it rebounds.XLM appears to be working its way to the bottom trend line of the wedge pattern that has formed on the daily chart. If it does, it will likely bounce, and make a run for the top trend line of the wedge pattern. This could present many opportunities for day/swing traders, and make it easier to determine entry and exit points if it plays out.
Good luck, and always use a stop.

XLMUSDTThis is a 1D frame analysis for XLMUSDT As we can see, we can observe a double bottom pattern which after the failure and the uptrend is currently heading towards a support line and after the slow patterns we can take from the market in a stepped manner for higher numbers. Keep in mind that there is a possibility that the price may start a movement from the first support line to the second support line after the drop, so keep an eye on both zones.

IS ELLIOT WAVE THEORY REAL? STELLAR LUMENS XLMHello Traders,
Here is the monthly chart of Stellar Lumens looking at this purely from an Elliott Wave perspective. I know little about the technical details of the protocol/token etc.
From an EW perspective price looks to be inside a bullish wave 3 with the target at the 1.618 extension.
Lets see what happens.

$XLM Targets 21¢- CUPDATE & HANDLELSE:XLM targets 21¢ with a Cup n' Handle Pattern
The target is the distance from the bottom of the cup to the top of the cup.
A 1.618 fib level from the bottom of the cup to the top matches the C&H target.
1X10^(-27) LM ☕🍵
