Stellarusd

Has Stellar Bottomed?Stellar Lumens, #XLM aka #STR, appears to be catching a bid here and breaking out of this extremely low volume sell off over the past 5 months, with today's and yesterday's session showing > 5x average daily volume.
Still early, but resistance is the 200 day at 3200 sats.

XLM - time to shortIt looks like a good opportunity to short.
You can take the profit on the target zone or wait a bit more for the touch of the downtrend line.

Daily Bullish Signal $XLM #XLM XLM/USDT (27 Dec)BLUE ARROW indicates the EXPECTED Time and Targets
Level Stoploss point up to maximize profit and reduce risk
I'm working all the time, even in Bearish Market

XLMPrice of stellar formed a solid support above the $0.1000 level and rallied above the $0.1050 and $0.1100 resistance levels. On the upside, the next major resistance for buyers could be $0.1150 or $0.1200.

Goodbye StellarGoodbye, not "good buy" obviously.
As you can see that the long-term resistance just turned into a very strong support, that's a very bearish sign ( Textbook ).
Weekly RSI still has plenty of space to drop, I mean, a real significant drop.
There are 2 levels watch:
0.1$ , there will be a bounce here but I don't think it's a big one.
0.05$, potentially the bottom, I'll definitely buy there.

XLMUSD: Long term sell targets accomplished. Consolidation aheadBoth TP = 0.1802 and 0.1713 (July, June lows) got hit following the late November collapse of the whole market. As with most coins, the achievement of the last short targets marks the end of our shorting strategy on XLMUSD as we believe that the market is near a long term bottom zone. Traders who wish to keep trading Stellar Lumens can consult the 1W chart which is now a Channel Down (RSI = 40.059, MACD = -0.029, Highs/Lows = -0.0439) indicating that there may be a recurring pattern sequence within the Channel. This shows a 34 day consolidation at the end of which another -6.50% drop potential to 0.1277. We are personally waiting for a bottom to be formed before engaging again.
** If you like our free content follow our profile (www.tradingview.com) to get more daily ideas. **
Comments and likes are greatly appreciated.

XLMUSDBuy Price: Green area
Profit: blue arrow
Invest Suggestion: 15 Percent
Profit Expectations: - 10 - 20 Percent
Looking at the chart of Stellar, I could see a pattern: the last two months, every time that currency, or closed or opened daily candle in fibo of 0.61, it had a great high that day or on the next days.
So, be ready to buy Stellar, it will touch fibo 0.61 !!!
If you are going to enter this trade, be sure to put your SL below that fibo 0.61 line, if the cadle close below that line, it will drop hard!
According the way you trade, sell when you get some profit.
Keep following your and please "like" this idea. Any doubts? Send in the comments or in our telegram.
Thanks for visiting.

XLMUSD: Ascending Triangle on 1D.XLMUSD has been one of the strongest performers of the past 2 months. Proof of that are the Higher Lows printed on 1D since Sept 11, that have created an Ascending Triangle (RSI = 55.984, MACD = 0.007, Highs/Lows = 0.000) with 0.3053 as its Resistance. If the price rebounds on a new Higher Low near 0.2325, then it will most likely test the 0.3053 Resistance. Otherwise it may test the 0.18020 Low again. Note that this is a medium/ short term pattern. In order for XLM to restore a longer term buying sentiment, the 0.3523 Lower High on 1W needs to break.
** If you like our free content follow our profile (www.tradingview.com) to get more daily ideas. **
Comments and likes are greatly appreciated.

Stellar. Rocket PUMPGreetings from Benice team!
Stellar coin has recently attracted much attention. It is very interesting that they have announced the possibility of adding it to Coinbase pro and of distributing coins for free on the blockchain wallet at the same time. Anyway, they are whetting our appetite. The news about the free distribution of coins has even appeared on RBC channel! Having in mind that the price is on the border of the wedge at the moment, its breakout can forward the price to the level of 0.2943; 0.3212; 0.3423 and finally 0.4431.
Recommendation: Long position from the current level (0.256647).
If you find this review useful, leave a like!
Subscribe to updates of the idea!
Thanks a lot for your attention!

XLM / USD SHORT TERM TRADE - 10% PLUS LEVERAGE - CryptoManiac101XLM / USD TA
Enjoy this trade advice my Crypto Maniacs, but remember to invest only what you can afford to lose or you're going right back to poverty on drop. We are not your financial advisors. Exclusive Members please refer to trade instructions in your private groups.

XLM/USD Resistance found!XLM resistance found for a mid-term position. Stay tuned, and if it bounces, long position.
I will update the chart when it keeps going.
Volume now is decreasing and a new big wave is expected.

XLMUSD: Approaching the bearish break out point of the Triangle.After completing the previous Inverse Head and Shoulders pattern, XLMUSD is now as expected a few candles away from the bearish break out mark (0.2170) of the 1D Triangle (RSI = 41.811, MACD = -0.002, Highs/Lows = -0.0120, B/BP = -0.0193). After the break out, it should successively test the previous Higher Low levels (0.2053 and 0.1930) before accomplishing our medium term TP set = 0.1802 and 0.1713 (July, June lows).

XLMUSD: Inverse Head and Shoulders completed. Short.XLM has broken the Channel Down to the upside and complete an Inverse Head and Shoulders pattern on 1D (RSI = 53.287, ATR = 0.0159). Technically it should resume the downside as the Triangle (shown in orange) is applying selling pressure on a Lower High. If 0.2170 breaks, them the Triangle is nullified and XLMUSD will resume the downtrend towards the 0.1930 support. We remain bearish with TP = 0.1802 and 0.1713 (June 29, 2018 low).

STELLAR 12 MONTH PREDICTION MIN $10 MAX $120 - CryptoManiac101XLM / USD 12 MONTH TA PREDICTION
Let's start with main question, WHY WOULD IT GO UP?
1. Liquidity coins will be in demand
2. IBM World Wire Integration
3. Institutional Investors
4. Media Hype
5. Bullish MASSIVE accumulation pattern
6. Newer partnerships to be released
Minimum XLM 12 Month prediction is $10
Maximum XLM 12 Month prediction is $120
Enjoy this trade advice my Crypto Maniacs, but remember to invest only what you can afford to lose or you're going right back to poverty on drop. We are not your financial advisors.


XLMUSD: Triangle broken, Channel Down emerging.XLMUSD has broken the 4H Triangle (RSI = 50.142, Highs/Lows) that was created after the 0.3050 Top was made and is developing a Channel Down on 1D (STOCH = 32.408, Williams = -69.863, ROC = -3.162). In order to sustain this, we need to test 0.2198 this week and make this a Lower Low. 1W is still on a Lower High sequence, so on the long term we remain bearish on Stellar with TP = 0.1802 and 0.1713 (June 29, 2018 low).

Stellar could give us a surpriseStellar seems to be bullish, there are many factors fundamentally that could generate a tremendous rally.
Technically it seems to be forming a descending triangle which is bearish but given current sentiment regarding a coinbase listing as technological development it may turn things around...
Obviously if it breaks the current support of triangle this trade will be canceled.
We shall see, as always be safe.

Sideways on a 4H Triangle. 1D Gap fill upon break-out. Short.Stellar is consolidating within a 4H Triangle (RSI = 50.704, ADX = 18.250, Williams = -54.760, CCI = -36.8849, Highs/Lows = 0.0000) having settled around the 0.500 Fibonacci retracement level after the 0.2263 low. At the moment the momentum is neutral on 1D also (Williams = -45.261, Highs/Lows = 0) and 0.2380 has to be crossed in order to break the Triangle. Based on the 1W Lower Highs pattern, this should take place soon and make a new Lower Low. That is why are keeping our short on XLMUSD with TP = 0.1802 and 0.1713 (June 29, 2018 low).

XLMUSD - 4h Chart AnalysisLike Ethereum, Stellar also recovered a little bit of ground against the US Dollar starting with the 19th of September pushed mainly by the total market capitalization which went above the level of $200 B.
The RSI has neutral position, the Stochastic is indicating that the price might slightly continue to increase while the MACD seems to try crossing the Signal line which can also be considered as a bullish signal.
On top of that, the resistance level of 0.2559$ has been broken today so the next level which can be considered a target price is 0.2679$ (Resistance Level 2).

XLM - Could be running out of steam! XLM had an amazing move up with Ripple last week and continues to mirror its moves so far this week. It is currently below the supply zone and FIB level, which is causing some resistance and we could see a move back down to the demand zone + breakout level around 3542.
MACD histo is near going positive but looks like it has stalled as well as signal line turning down again. RSI seems to be turning down but still has room above to hit resistance if we could find some momentum to the upside. For a long play, wait for a test of the demand zone to enter a trade as a break down from there could lead to a move down to the initial breakout around 3319.
Thanks guys!

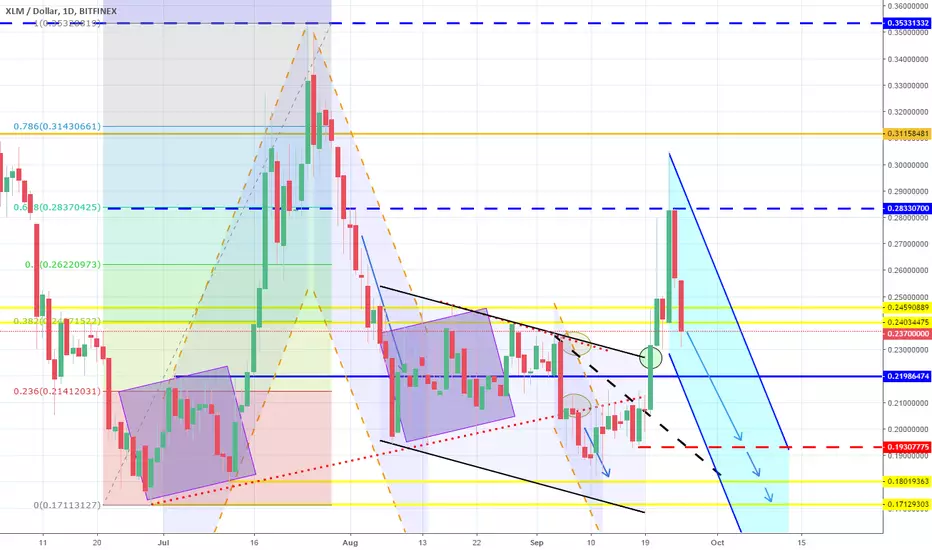
Rejected on a new 1W Lower High. Quick Gap Fill to 0.1936.XLMUSD broke the previous Channel Down on 1D on fundamental market parameters making a high at 0.3050, which is however a technical Lower High on 1W (RSI = 48.747, MACD = -0.010). Since the Lower High was within the 0.681 - 0.786 (0.2337 - 0.3143) Fibonacci retracement zone, we expect the price to make an equally quick technical gap fill on 1D to 0.1930. We have entered new shorts targeting this gap (0.1930) as well as the previous two targets: 0.1802 and 0.1713 (June 29, 2018 low).