2 fightsXLMEUR recovered yesterday somewhat from the Monday sell-off. Overnight (Asia trading hours) some selling continued in XLM vs BTC, and USD, not sure why.
Today:
Fight 1: remain above the lower band of the uptrend channel
Fight 2: Resistance level of 0,255
Have a nice day!
Stellarusd

Weak Monday...Sadly it's looks like the uptrend will be broken today... or not? Let's see..
I still believe in this uptrend channel but the story changes so quickly. With every BTCUSD whale drop of 1%, XLMEUR drops 2,5%..
Hang in there

New uptrend channelI have drafted a new uptrend channel with some new resistance lines. XLMEUR has been recovering nicely and it looks like we have successfully broken the 0,255 resistance over the weekend.
Today
range between 0,26 and 0,27
RSI to remain in the between 55 and 70
XLMBTC to trade around 4000s
resistance levels around 0,28 0,313 and 0,325
but watch out for those whales..
Have a nice day!

Break the resistance!Yesterday XLMEUR has been flirting with the resistance level at 0,255 cents (around 0,30$). I would like to see that this resistance is broken so that higher levels come into play. Some good news on XLM vs USD support on Binance and Bittrex should help.
Today :
range between 0,245 and 0,27
new resistance levels will drawn in the weekend, expect around 0,28 and 0,30
XLMBTC between 3800 and 3950
RSI remains high
BTCUSD should sometime recover and drive the Alts up
Have a great day

The rangeXLMEUR was recovering nicely yesterday when the whales attacked again. Imo some exchanges need more oversight. This dumping is not helping this industry. I expect more of these attacks and more side ways trading until we have some really good news
Today
We trade the range 0,23 to 0,25
Support resistance of 0,255 needs to be broken first for higher highs..

Recovery or small correction?Yesterday markets suddenly recovered. Yesterday I mentioned that the RSI was so low that a nice buying opportunity existed, but it was so short!
So what's next for XLMEUR?
range between 0,23 and 0,26 eur
support at 0,2550 eur needs to be broken before we can go higher
XLMBTC, level around 3800s
RSI will remain high
Good luck folks!

A new support levelSo market are trading down. Sad, I had to draw a new support line..
For RSI lovers: a nice buy moment!

FUD Weekend is overkraken:XLMEUR ended up on the lower end of my Saturday predictions... Slowly it's moving downward to the next support level around 0,22. From a technical perspective it's all BTCUSD related..
I find RSI levels still high..Most likely we will be testing the 0,22 level soon.

Weekend duf...Weekend duf: nothing exciting to mention for crypto markets. XLMEUR has been traded around 0,24 / 0,25 the last days. For higher highs we need to break the support line at 0,25. RSI levels remains relatively high between 50-60. Sathosi wise XLMBTC is now trading at 3881 and it would be good to see this going back to 4k.
Expectations for this weekend
IS: Neutral
XLMEUR: between 0,23 and 0,26
XLMBTC: 3700 and 4100 sats
What would be good:
If we break the 0,26 and slowly move up again.
Jed announcing some new projects
However: the BTC whales will probably attack to push BTC below the 7k mark.
I am going to enjoy the sun this weekend
Have fun!

Hitting support!XLMEUR back up to the support level around 0,25. Looking forward to see if it can break it and move further up (or not). RSI levels are quite high, so I am not so sure. If those BTC whales attack again we could be testing 0,22 again. More likely scenario is that we go higher... but on what? I am missing the good news lately. Fill me in please!

Fudcovery?Yesterday markets were driven down by FUD... Yesterday when XLMEUR was around 0,22 cents RSI levels were so low that a nice buying opportunity existed.
Overnight markets recovered. XLMEUR remains around 0,25
I have neutral view at the moment. XLMEUR is mainly following crypto markets at the moment.

Oeff... a tough oneSo XLMEUR continues to be weak and the support has been broken. I will evaluate next steps today..

Too earlyThe upper channel did not confirm and was broken within 12 hours of writing my previous idea. Back to Neutral again.
So storyline is reconfirm support line.

Yes, time for change of directionYesterday I realised that it's time for change. So I had a look at the chart and thought... it's time that we move up for a while. We have tested the support level twice and now we are slowly moving up.
My 3 week view
BTCUSD: 10k
XLMBTC: 4300
XLMEUR: 0,36
RSI: remains in 40 to 60 band
IS: from Neutral to Long
Not sure if this materialises, but would be nice if BTCUSD would test the 10k level in the comings weeks.
Have a good week!
KR, TP

Stellar ... Lumens ... **** $STARS$ ****I guess there is nothing much to say.. chart speak by itself... Bulls are rounding Stellar for a while now... Bullish is in the Air.
C&H Completed: Bullish
Cypher Completed: Bullish
Shark Completed: Bullish
Volume supress: Bullish
MACD converging: Bullish
EMA 13 playing around with EMA 34.. seem will try to touch her again and maybe cross her too..
BUT.. There is this PINK line.. determined by:
(A): EMA 13 bouncing on EMA 34 on March 26, and
(B): EMA 13 crashing on EMA 34 on May 15.
++ 1:1 Target of Shark pattern..
ALL THIS AT .786 retrace fib level.
so Pink line is the first target... and if Stellar breakthrough it ... well.. do you have hot water ready for at least one coffe?
This is just Psychedelic Mad Painting .. in this Sunday's night TV Show Episode called "STARS .. STELLAR.. LUMENS"
GoodTrade
-CJ-

Where's Stellar? And where could she go?Cause Im a new student around here.. i would like to confirm with you if this could be a valid C&H?...
And if it is.. are this the measures?
Thanks
GoodTrade

Weekend!The nice thing about crypto currency markets is that they trade 24/7. I have not sent an update since Thursday morning. 2 things: again XLMEUR is following my channel. Furthermore the support level is clearly confirmed. We have now reached the rocket to the moon. But will it lift off?
I have no clue to be honest. We have traded side ways and down for 3 to 4 weeks. I think it is time for a reversal. But when?
My IS would is moving to Long. Hopefully we can reach Satoshi level 5000 is a couple of weeks!

A new day, a new chartSo XLMEUR deserved a new chart. I revised the channels to the new reality and revised the support aka bounce a bit lower
For today:
XLMEUR to hover between 0,27 and 0,29
XLMBTC to float around 0,00004000
Expect to trade within the down trend channel
RSI to remain in the middle
Until? who knows!

Bouncing againSo the whales have attacked again causing a couple percent drop. BTCUSD back to 8168 at the time of writing this episode.
My thoughts for XLMEUR for today:
- remain above the bounce area
- recovery again to 0,30 cent to the Euro
- remain above 4000 Sat's and climb to 4100 Sat's
If not, we need to think about a new trend going down faster than anticipated..
time will tell

Stellar is also one of today’s anti-heroes Stellar is also one of today’s anti-heroes as its price declined for 11.61 percent in the past 24 hours. XLM/USD reached the support area at 0.3189 and jumped off it towards the resistance area at 0.3377. The currency pair has also crossed the descending trend line in passing. There is a Shooting Star candlestick pattern in the moment of writing.
The possible scenarios for XLM/USD are the following:
1. XLM price will jump over the resistance area at 0.3377 and move towards the next resistance level, which lies at 0.3540.
2. XLM/USD will jump off the resistance area at 0.3377 and decline towards the next support area at 0.3189 (the only obstacle is the descending trend line).
3. Stellar will stay close to the current levels without significant changes.
As for the daily chart, Stellar is close to the Ichimoku cloud in the moment of writing. We have a downside midterm tendency, but the situation is still unclear.
Check the full crypto analysis HERE

The strategy trades Stellar/ Dolla on TF H4.- The price is tested area 0.30733.
- Double reversal candle is shaped on TF Daily.
- On TF H4: Price action confirmation--> Buy

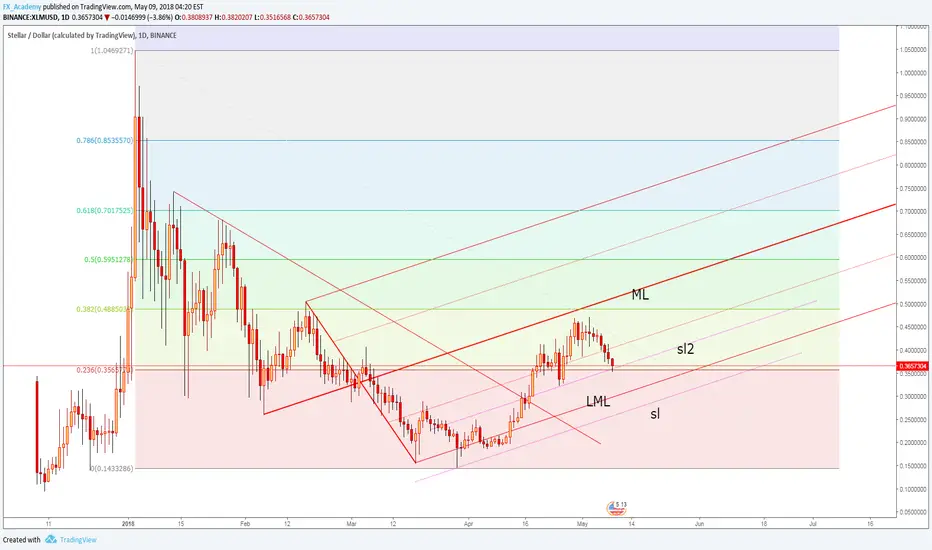
Stellar retreat underwayThe current drop is natural after the failure to reach the median line (ML) of the ascending pitchfork. It has also failed to reach the 38.2% Fibonacci retracement level, so the drop is natural. A breakdown below the inside sliding line (sl2) will confirm a further drop towards the LML and towards the outside sliding line (sl). Only a false breakdown below the mentioned support levels followed by a retest will signal another bullish momentum.
Stellar Machine Learning 3-Day Crypto SignalThe rolling three-day signal for Stellar (XLM) is "Don't Own". This is day two of the three-day signal. The signal will be updated and shared again on Thursday. For further details or discussion, feel free to leave any questions or check out signature/profile.
