#STMX/USDT#STMX
The price is moving within a descending channel on the 1-hour frame, adhering well to it, and is heading towards a strong breakout and retest.
We are experiencing a rebound from the lower boundary of the descending channel. This support is at 0.001610.
We are experiencing a downtrend on the RSI indicator, which is about to be broken and retested, supporting the upward trend.
We are in a trend of consolidation above the 100 Moving Average.
Entry price: 0.001926
First target: 0.002150
Second target: 0.002380
Third target: 0.002730
Stmx

STMXUSDT 1WSTMX ~ 1W Analysis
#STMX Since this chart is formed, this is the lowest support in this coin and never broken. Buy from here with a minimum target of 20%+

STMXUSDT at a Make-or-Break Level – What’s Next?Yello, Paradisers! Are we about to see a major bounce on STMXUSDT, or is a breakdown lurking? Let’s break it down.
💎STMXUSDT has been in a healthy retracement and is now approaching a key support zone. If the price takes inducement and reaches this level, we’ll be watching for bullish price action confirmations—particularly a Bullish I-CHoCH on lower timeframes. This would significantly increase the probability of a bullish move.
💎Additionally, if we see a W pattern or an inverse head and shoulders forming in this area, it would further strengthen the bullish case. Stay alert and monitor price action closely.
💎However, if STMXUSDT breaks below the strong support zone and closes a candle beneath it, our bullish setup becomes invalid. In this scenario, it’s better to stay patient and wait for a more favorable price action setup.
🎖Remember, Paradisers—trading is all about waiting for high-probability setups. Discipline and patience always win in the long run. Stay sharp!
MyCryptoParadise
iFeel the success🌴

#STMX/USDT#STMX
The price is moving in a descending channel on the 1-hour frame and is expected to continue upwards
We have a trend to stabilize above the moving average 100 again
We have a descending trend on the RSI indicator that supports the rise by breaking it upwards
We have a support area at the lower limit of the channel at a price of 0.005357
Entry price 0.005440
First target 0.005670
Second target 0.005907
Third target 0.006192

#STMX/USDT#STMX
The price is moving in a descending channel on the 1-hour frame and is expected to continue upwards
We have a trend to stabilize above the moving average 100 again
We have a descending trend on the RSI indicator that supports the rise by breaking it upwards
We have a support area at the lower limit of the channel at a price of 0.005430
Entry price 0.006270
First target 0.00671
Second target 0.007100
Third target 0.007567

STMX/USDT DAY TRADESTMX/USDT DAY TRADE
This coin can show a daily new volume for an uptrend.
Follow this update for the live trading

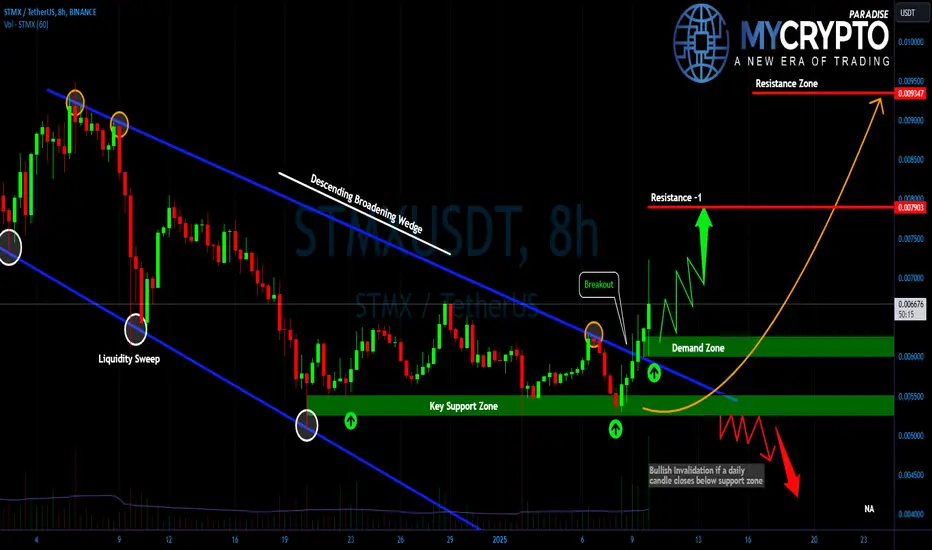
Is #STMX Ready for a Breakout? Don’t Miss This Move!Yello, Paradiser! Are you ready for what’s brewing with #STMX? The setup on the charts could be pointing to a big move don’t miss this critical update!
💎#STMXUSDT is currently displaying a bullish reversal structure that demands attention. A descending broadening wedge, recognized as a bullish pattern, has already confirmed its breakout. Before this breakout, a liquidity sweep near the wedge’s lower boundary suggested stop hunting behavior, a move often followed by significant directional momentum.
💎With the breakout in place, the demand zone between 0.006015 and 0.006256 now plays a pivotal role. This area could act as a springboard for upward momentum, with the price targeting 0.007893as the first resistance level. If bullish momentum persists, the next significant level lies around 0.0093, potentially marking an extended rally.
💎On the downside, if the demand zone fails to hold, it could trigger heightened selling pressure, dragging the price down to support at $0.005270. A close below this level would invalidate the bullish structure and open the door for further declines.
💎Volume remains a critical factor here. A surge in volume would lend confidence to directional moves, while lowvolume breakouts in either direction should be approached with caution, as they are often indicative of fakeouts.
💎The demand zone at $0.006015 offers a logical area for risk defined entries, aligning with the overall bullish continuation thesis. While the current outlook favors a gradual advance toward resistance levels, traders must stay vigilant for potential macroeconomic shocks or sudden market reversals.
Trade smart and keep your focus on the bigger picture!
MyCryptoParadise
iFeel the success🌴
STMXUSDT: Out of Fuel? Long-Term Opportunity Awaits! STMXUSDT: Out of Fuel? Long-Term Opportunity Awaits! 🚦
STMXUSDT has exhausted its fuel in intermediate zones. Right now, its movement hinges on the liquidity tied to breaking the green trend line I've highlighted. That’s why the blue box could serve as a solid long-term buying opportunity— but only under the right conditions.
What to keep in mind:
Trend Line Break: Liquidity from the green trend line will be crucial for significant movement.
Blue Box as Long-Term Buy: A great zone for patient traders.
Key Indicators: Always confirm with CDV, volume profile, and other tools before entering.
The market rewards the prepared! Don’t just trade—trade smart. Boost, comment, and follow for more high-value analyses. 🚀
Let me tell you, this is something special. These insights, these setups—they’re not just good; they’re game-changers. I've spent years refining my approach, and the results speak for themselves. People are always asking, "How do you spot these opportunities?" It’s simple: experience, clarity, and a focus on high-probability moves.
Want to know how I use heatmaps, cumulative volume delta, and volume footprint techniques to find demand zones with precision? I’m happy to share—just send me a message. No cost, no catch. I believe in helping people make smarter decisions.
Here are some of my recent analyses. Each one highlights key opportunities:
🚀 GMTUSDT: %35 FAST REJECTION FROM THE RED BOX
🎯 ZENUSDT.P: Patience & Profitability | %230 Reaction from the Sniper Entry
🐶 DOGEUSDT.P: Next Move
🎨 RENDERUSDT.P: Opportunity of the Month
💎 ETHUSDT.P: Where to Retrace
🟢 BNBUSDT.P: Potential Surge
📊 BTC Dominance: Reaction Zone
🌊 WAVESUSDT.P: Demand Zone Potential
🟣 UNIUSDT.P: Long-Term Trade
🔵 XRPUSDT.P: Entry Zones
🔗 LINKUSDT.P: Follow The River
📈 BTCUSDT.P: Two Key Demand Zones
🟩 POLUSDT: Bullish Momentum
🌟 PENDLEUSDT.P: Where Opportunity Meets Precision
🔥 BTCUSDT.P: Liquidation of Highly Leveraged Longs
🌊 SOLUSDT.P: SOL's Dip - Your Opportunity
🐸 1000PEPEUSDT.P: Prime Bounce Zone Unlocked
🚀 ETHUSDT.P: Set to Explode - Don't Miss This Game Changer
🤖 IQUSDT: Smart Plan
⚡️ PONDUSDT: A Trade Not Taken Is Better Than a Losing One
💼 STMXUSDT: 2 Buying Areas
🐢 TURBOUSDT: Buy Zones and Buyer Presence
🌍 ICPUSDT.P: Massive Upside Potential | Check the Trade Update For Seeing Results
🟠 IDEXUSDT: Spot Buy Area | %26 Profit if You Trade with MSB
📌 USUALUSDT: Buyers Are Active + %70 Profit in Total
🌟 FORTHUSDT: Sniper Entry +%26 Reaction
🐳 QKCUSDT: Sniper Entry +%57 Reaction
📊 BTC.D: Retest of Key Area Highly Likely
This list? It’s just a small piece of what I’ve been working on. There’s so much more. Go check my profile, see the results for yourself. My goal is simple: provide value and help you win. If you’ve got questions, I’ve got answers. Let’s get to work!

STMX. Here's Why This Project is Worth Watching. 12/16/24I recommend considering an entry from the current price level and down to the lower boundary of the consolidation range (support level).
This project shows strong potential and has been in accumulation for an extended period.
DYOR.

STMX/USDT Analysis: Blue Box Demand ZonesFocus on additional entry opportunities within the blue boxes, identified as strong demand zones for STMX/USDT.
Previous STMX/USDT analysis,
Key Insight
The blue boxes represent areas where significant buying activity is likely to occur, offering high-probability entry points for long positions.
Action Plan
Entry Strategy:
Monitor price action as it approaches the blue boxes.
Look for confirmation such as bullish candlestick patterns, wicks, or volume spikes before entering.
Stop Loss:
Place stops just below the lower boundary of the blue box to minimize risk.
Take Profit:
Target recent swing highs or resistance levels for profit-taking.
Note: Patience is key, wait for clear reactions within the blue boxes to optimize entries and maximize reward potential.
I keep my charts clean and simple because I believe clarity leads to better decisions.
My approach is built on years of experience and a solid track record. I don’t claim to know it all, but I’m confident in my ability to spot high-probability setups.
My Previous Analysis
🐶 DOGEUSDT.P: Next Move
🎨 RENDERUSDT.P: Opportunity of the Month
💎 ETHUSDT.P: Where to Retrace
🟢 BNBUSDT.P: Potential Surge
📊 BTC Dominance: Reaction Zone
🌊 WAVESUSDT.P: Demand Zone Potential
🟣 UNIUSDT.P: Long-Term Trade
🔵 XRPUSDT.P: Entry Zones
🔗 LINKUSDT.P: Follow The River
📈 BTCUSDT.P: Two Key Demand Zones
🟩 POLUSDT: Bullish Momentum
🌟 PENDLEUSDT: Where Opportunity Meets Precision
🔥 BTCUSDT.P: Liquidation of Highly Leveraged Longs
🌊 SOLUSDT.P: SOL's Dip - Your Opportunity
🐸 1000PEPEUSDT.P: Prime Bounce Zone Unlocked
🚀 ETHUSDT.P: Set to Explode - Don't Miss This Game Changer
🤖 IQUSDT: Smart Plan
⚡️ PONDUSDT: A Trade Not Taken Is Better Than a Losing One
💼 STMXUSDT: 2 Buying Areas

STMX | 2 Buying Areas
The analysis highlights two potential buying zones for STMX, strategically identified to maximize entry opportunities. These areas are derived from a combination of technical indicators, historical price action, and volume trends.
Zone 1 : A closer and more aggressive entry point, suitable for traders anticipating a quick bounce or reversal. This zone aligns with short-term support levels and might see increased activity from scalpers and day traders.
Zone 2 : A deeper buying zone, positioned at a stronger support level, offering a more conservative entry for those aiming for higher risk-reward setups. This area aligns with a broader market retracement and could attract long-term investors.
Both zones are marked based on a confluence of Fibonacci retracements, order blocks, and key market structure points. Always pair these zones with proper risk management strategies, as the market remains volatile.
I don't overcomplicate things and add a ton of dirty crap to my charts, but you can check out the success of my analysis below.
I approach trading with confidence backed by experience and past success in identifying high-probability setups.
While I don’t claim to be the best, my track record speaks for itself, and I strive to let my analysis and results do the talking. Watch these levels closely—markets can confirm what charts already whisper. Let’s see how this plays out together.
My Previous Ideas
DOGEUSDT.P | 4 Reward for 1 Risk much more if you hold it.
RENDERUSDT.P | HTF Accuracy
ETHUSDT.P | Accurate Buyer Zone Identification | High Risk Reward if you hold it.
BNBUSDT.P | Accurate Buyer Zone Identification | High Risk Reward if you hold it.
Bitcoin Dominance | Great Characteristic Detection and Accurate Analysis

#STMX/USDT#STMX
The price is moving in a descending channel on the 4-hour frame and sticking to it well
We have a bounce from the lower limit of the descending channel, this support is at a price of 0.004610
We have an upward trend, the RSI indicator is about to break, which supports the rise
We have a trend to stabilize above the moving average 100
Entry price 0.005170
First target 0.005436
Second target 0.005700
Third target 0.006093

Bullish on STMX1. We have price closing above the daily OB+
2. We will have a failure of model22 in the H4 hence expecting immediate repricing
3. Weekly chart = Bullish
4. We have strong draws as the OB- in H4 and the further buyside liquidity to purge

STMX sell/short setup (1D)Considering that STMX is trading below the downward trend line and we have a bear CH on the chart, we are looking for a sell/short position in the premium ranges of the previous wave.
The targets are marked on the chart.
Closing a daily candle above the invalidation level will violate the analysis
For risk management, please don't forget stop loss and capital management
When we reach the first target, save some profit and then change the stop to entry
Comment if you have any questions
Thank You

Could #STMX Be Setting Up for a Massive Bullish Rally? Yello, Paradisers! Are you ready for what could be a pivotal move of the #STMXUSDT? Let's look at the latest analysis of the #StormX:
💎#STMX is flashing strong signs of a bullish continuation from a critical support zone, which was once a descending resistance. We’ve been tracking $STMX’s movements within a descending channel, and recently, it broke above this pattern, retested the upper channel, and is now showing resilience at this crucial support level.
💎If #STMXUSDT holds the line at $0.0047, we could witness a substantial bullish rally, similar to what we’ve seen in past market trends.
💎A breakout above $0.00693 could pave the way for a move toward higher resistance zones, potentially triggering a significant price surge.
💎However, Should the current momentum waver, the next bullish rebound might find footing around the $0.0036-$0.0041 support zone.
💎A daily close below the current demand area could invalidate the bullish scenario and open the door to a deeper correction. Stay sharp and play it smart
Stay focused, patient, and disciplined, Paradisers🥂
MyCryptoParadise
iFeel the success🌴

STMXUSDTSTMX ~ 1W
#STMX Make purchases gradually in this demand zone block. So far the price continues to maintain this block of demand. short term target of at least 20%+

STMX Price Update & Analysis in a Weekly TimeframeHello everyone, I’m Cryptorphic.
For the past seven years, I’ve been sharing insightful charts and analysis.
Follow me for:
~ Unbiased analyses on trending altcoins.
~ Identifying altcoins with 10x-50x potential.
~ Futures trade setups.
~ Daily updates on Bitcoin and Ethereum.
~ High time frame (HTF) market bottom and top calls.
~ Short-term market movements.
~ Charts supported by critical fundamentals.
Now, let’s dive into this chart analysis:
STMX rebounded from the support trendline, dropping as low as $0.003695 and rallying up to $0.010995, a 190% gain.
Although the rally was impressive, it wasn't enough to break the resistance trendline. Currently, the price has been rejected and is once again approaching the support levels.
Key Levels:
- Primary Support: $0.00442
- Lower Support: $0.003322
- Primary Resistance: $0.0083
- Higher Resistance/Targets: $0.0129, $0.0245, $0.0433, $0.0760
DYOR, NFA
Please hit the like button to support my content and share your thoughts in the comment section. Feel free to request any chart analysis you’d like to see!
Thank you!
#PEACE

STMX/USDT: POTENTIAL BULL FLAG! 50% PROFIT POTENTIAL SETUP!!Hey everyone!
If you're enjoying this analysis, a thumbs up and follow would be greatly appreciated!
STMX looks good here for a long. It is forming a bull flag-like structure. It breaks out from this bull flag and currently, retesting it. Long some here
Targets:- $0.0094/$0.0108$0.0129
SL:- $0.008
Lev:- Use low leverage (2x-4x)

STMX: Consolidation with Key Levels to WatchThe market sentiment for STMX is currently neutral with mixed signals from technical indicators. This suggests potential consolidation or a movement in either direction depending on market catalysts.
Key Factors Influencing STMX Price
1. Technical Indicators and Their Implications:
The MACD is neutral, indicating a lack of strong momentum in either direction. This often suggests the price might consolidate before making a decisive move.
Both %K and %D are in neutral territory, suggesting that the asset is neither overbought nor oversold. This indicates potential sideways movement.
The RSI is close to 50, reinforcing the neutral sentiment and suggesting there is room for the price to move in either direction without being constrained by overbought or oversold conditions.
Potential Market Scenarios
Bullish Scenario:
A break above the local resistance at $0.010014 could lead to further upward movement, potentially targeting the solid resistance at $0.010995. This move would likely confirm bullish momentum and attract more buyers.
Bearish Scenario:
If STMX fails to break above the local resistance, it could retest the support levels at $0.009269 and $0.008524. A break below $0.008524 could signal further declines, potentially leading to a bearish trend.
Conclusion and Market Outlook
STMX is currently in a consolidation phase with significant support and resistance levels to monitor. The mixed signals from technical indicators suggest that traders should watch for a breakout above resistance or a dip to support levels for potential entry points.

STMXUSDT Technical Analysis in Weekly TimeframeHello everyone, I’m Cryptorphic.
For the past seven years, I’ve been sharing insightful charts and analysis.
Follow me for:
~ Unbiased analyses on trending altcoins.
~ Identifying altcoins with 10x-50x potential.
~ Futures trade setups.
~ Daily updates on Bitcoin and Ethereum.
~ High time frame (HTF) market bottom and top calls.
~ Short-term market movements.
~ Charts supported by critical fundamentals.
Now, let’s dive into this chart analysis:
The STMX/USDT weekly chart presents a clear symmetrical triangle pattern, indicating a potentially significant move shortly.
The price is currently hovering near the support trendline, suggesting a potential bullish breakout if the pattern holds. Key levels to watch:
- Lower Support: Around $0.003322.
- Immediate Resistance Levels/Targets: $0.0083 to $0.012936.
A successful breakout above the upper resistance line could target higher targets.
DYOR, NFA.
Please hit the like button to support my content and share your thoughts in the comment section. Feel free to request any chart analysis you’d like to see!
Thank you!
#PEACE

#STMXIn time H2, it is moving within a density that can grow to the supply area after a correction movement due to the weakness in momentum and then break down towards the support due to the inability to break the dynamic trigger with correction and density. Therefore, in the area of supply and dynamic trigger, you can enter a sell position with confirmation.

STMXUSDT(StormX) Daily tf Range Updated till 25-07-24STMXUSDT(StormX) Daily timeframe range. it had a cool pump. but gotta be careful with this one, its a high risk and reward alt. now it tried to break 0.008206 but need another push for that. local retrace point at 0.006055.

STMXUSDT.1DUpon closely examining the STMX/USDT daily chart, several key technical factors draw my attention, shaping my analytical perspective and trading strategy.
Overview of Market Dynamics:
The price currently stands at $0.005124, marking a slight decrease of 2.73%. The chart exhibits a series of fluctuations within defined ranges, pointing towards a volatile yet somewhat range-bound market environment over recent months.
Trend Analysis:
A clear pattern isn’t dominant; however, recent price action below the former support level at R1 ($0.006364) indicates a downward trend has taken hold. The challenge now is to see if the price stabilizes or continues to descend towards the marked support level S1 at $0.003006.
Support and Resistance Levels:
R1 at $0.006364: Recently breached, this level now poses potential resistance.
R2 at $0.008765 and R3 at $0.010842: These are critical upper resistance levels which might come into play should a strong upward reversal occur.
S1 at $0.003006: This is the immediate support level that traders should watch closely. A break below could signal a significant bearish move.
Relative Strength Index (RSI):
The RSI is positioned at 46.73, which is slightly below the neutral 50 mark. This suggests a mild bearish momentum but isn't indicative of extreme conditions, allowing for potential reversal scenarios if market sentiment shifts.
Moving Average Convergence Divergence (MACD):
The MACD line is marginally above the signal line but approaching a crossover. This potential crossover could either strengthen the bearish outlook if it moves below the signal line or signal a buying opportunity if it stays above.
Volume and Market Sentiment:
Not explicitly shown on the chart, but volume analysis in conjunction with price action could provide deeper insights into the strength of the current trends and potential reversals.
Strategic Trading Advice:
Given the current market conditions and technical setup, my strategy would involve a cautious approach to any bullish positions. I would look for stabilization or bullish reversal signals near S1 at $0.003006 before considering long positions. Setting a tight stop-loss just below this support can help mitigate risks should the downtrend continue.
For more aggressive traders, monitoring the RSI and MACD for signs of divergence with price might offer early signals of a potential reversal. Any substantial volume increase on bullish days could also provide confirmation needed to initiate a long position.
Conclusion:
In summary, STMX/USDT presents a slightly bearish short-term outlook with critical junctures at R1 and S1. A strategic approach would involve waiting for clear technical signals of reversal or stabilization. As always, maintaining a disciplined approach to risk management is crucial in navigating such potentially volatile environments.
