STMXUSDT POSSIBLE SHORT CHANCEAs you can see in STMX, there is a shoulder head shoulder pattern, although it is not very symmetrical. But in 4 hours, if the candle closes below the line I draw, there may be a chance to open a short (it may be a trap). Also, profit sales can be made in the green boxes I draw (it is more logical to determine your profit yourself).
DEFINITELY NOT INVESTMENT ADVICE!!!
Stmx

stmxI am waiting for the collision on each of the red lines of the direction, the correction towards the trend line
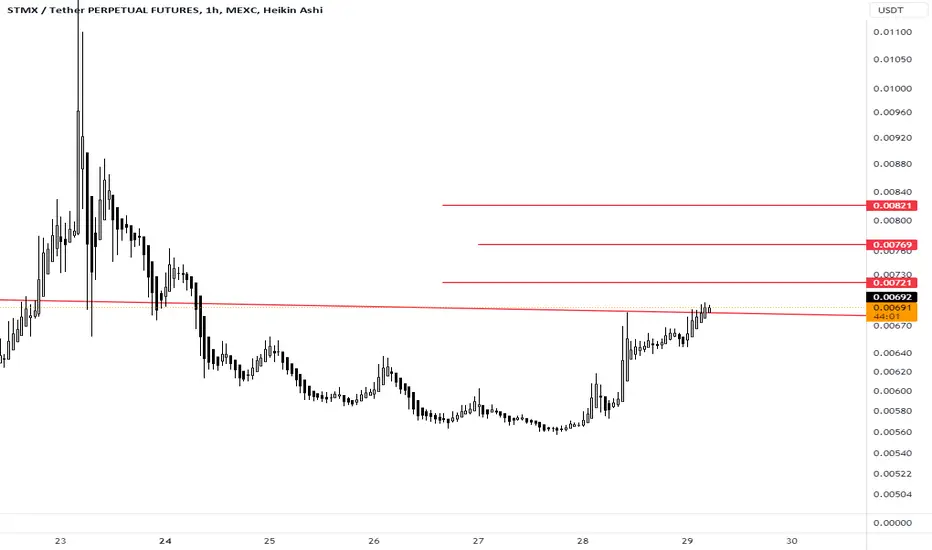
The support and resistance area around 0.007740 is importantHello?
Traders, welcome.
If you "Follow", you can always get new information quickly.
Please also click "Boost".
Have a good day.
-------------------------------------
(STMXUSDT chart)
(1M chart)
The key is whether it can find support above 0.005660 and rise above the MS-Signal indicator.
(1W chart)
Therefore, if it rises above 0.007740 and shows support, it is a buying time from a mid- to long-term perspective.
(1D chart)
From a short-term perspective, there is an uptrend as the price is holding above the HA-High indicator on the 1D chart.
However, if you refer to the explanations of the 1M chart and 1W chart, the important point is whether it can rise with support in the 0.005660-0.007740 range.
If supported and raised in this way,
1st: 0.012750
2nd: 0.019146-0.020898
The area around the 1st and 2nd above corresponds to the split selling section.
Therefore, it is recommended to proceed with buying when the HA-Low indicator or HA-High indicator on the 1D chart is newly created and shows support from the indicator.
------------------------------------------
There are a few coins (tokens) that are showing a lot of uptrend that I feel like I won't have a chance to buy unless I buy them right now.
However, if you look closely at support and resistance points, there are only a handful of coins (tokens) that break through significant support and resistance points upwards.
Therefore, you need to be very careful when trading coins (tokens) that are currently skyrocketing.
-------------------------------------------------- -------------------------------------------
** All descriptions are for reference only and do not guarantee profit or loss in investment.
** Even if you know other people's know-how, it takes a considerable period of time to make it your own.
** This is a chart created with my know-how.
---------------------------------

STMX COIN NEXT POSSIBLE MOVE!! STMX TRADE SETUP !$STMX Coin Update &Possible Move !!
• weekly candle bearish & almost in last 4 days price almost drop 37%+ without liquidation wick.
• MACD &RSI are Bearish on 1D &4H tf.
• Bounce back expected from its support area. ( fundametally weak so longterm trade not recomanded.
FOLLOW FOR MORE

STMX/USDT Big Breakout Bull Flag So 12x Potential from My Entry? STMX/USDT Technical Analysis - Big Bull Flag Breakout Signals Potential 12x Gains!
Greetings, Crypto Traders! Today, we'll dive into a detailed technical analysis of the STMX/USDT trading pair, which has recently witnessed a significant bullish movement. As always, remember to exercise caution and follow proper risk management strategies. Let's explore the charts and identify potential entry and exit zones for maximum profit potential!
Weekly Time Frame Analysis
The STMX/USDT trading pair has just experienced a substantial breakout from a Big Bull Flag pattern on the weekly time frame. This bullish continuation pattern suggests the potential for further upward movement. However, we must exercise patience and avoid chasing the current price surge.
Buy Low, Sell High - Timing Matters
Considering the impressive 276% price surge in just 7 days, it is crucial to refrain from FOMO (Fear Of Missing Out). The smart approach is to wait for a retest of the breakout level before entering a position. Buying during a retest provides a more favorable risk-to-reward ratio and minimizes the risk of buying at the peak.
Best Accumulation Zone
In my opinion, the best accumulation zone lies in the range of $0.0042 to $0.0053. Waiting for the price to reach this zone will increase the likelihood of securing an advantageous entry position.
Long-Term Bullish Sentiment
The breakout from the Bull Flag pattern was accompanied by a significant surge in trading volume, indicating strong buying interest. This adds to the long-term bullish sentiment for STMX/USDT. However, a proper retest is essential to validate the strength of this breakout.
Price Targets and Potential Gains
Upon a successful retest, the next potential target for STMX/USDT lies around $0.060. This ambitious target represents a whopping 12x gain from the entry box. While aiming high is exciting, always remember to take profits along the way and adjust your stop-loss levels to secure your gains.
Critical Levels to Watch
Keep a close eye on the following levels:
Support: $0.0055 and $0.0042
Resistance: $0.0093, $0.025, and $0.058
These levels can offer valuable insights into market sentiment and potential price reactions.
Conclusion
The STMX/USDT trading pair has shown great potential with its recent Bull Flag breakout on the weekly time frame. However, exercising patience and waiting for a retest before entering a position is a prudent approach. Keep an eye on the critical support and resistance levels to gauge market dynamics. Remember, always trade responsibly, and stay informed about the latest market developments.
Happy trading and best of luck in your crypto endeavors!
Disclaimer: This analysis is not financial advice. Trading cryptocurrencies involves risk, and past performance is not indicative of future results. Always conduct your research and consult with a professional advisor before making investment decisions.
Follow us for More Quality Analysis.

STMX, Follow Up - TargetsHere are the projected targets for stmx, since i posted the educational on it, Take care guys\

STMX Thank you for the usdt- KnowledgeLets look at stmx and we are going to see how u trade the swing high. Now most of the coins I send are at the bottom waiting for the pump (more profit) but if u want to trade a pump this is what u look for:
You will notice that stmx is forming higher highs, you then want to find a position, Look for a period of consolidation on a support level in this case this was 0.00466, 40 hrs of consolidation testing support level 9 times. That is my first entry point.
I included another trade i sent in the bottom which will demonstrate this methodology
The second entry point for those who like to trade pump is on the breakout and retest, you will see we broke out and retested the trendline for 3 hours, then the pump. I presume everyone knows the right way to draw a trendline.
That is it basically, You need to hunt for trades that are "boring" and trade into the excitement.
I included another trade i sent in the bottom so u can see this trading method on a trade i sent

Stmx Getting Ready For Massive Recovery Seems Like Ready For Massive Recovery Macd Crossover Showing Bulls Strength
Formed Falling Wedge In 3 days Tf Incase Of Breakout Expecting 300 to 340% Bullish Rally In Midterm

TRADE OF THE DAY | STMX broken market structure | Possible 13.3%TRADE OF THE DAY | STMX broken market structure | Possible 13.3%
STMX like alot of other ALTS right now is looking like further downside could ensue with this latest Binance-SEC bombshell. What makes this more appealing than the others is the clear break of market structure and a significant long term support sitting within a nice take profit target to comfortably deliver a 1:1 R:R here.
We do have a bearish divergence in play along with a strong break down in the RVI trendline
All targets are on the chart

$STMX/USDT 1D (#Bybit) Ascending wedge breakdown and retestStormX got rejected on 200EMA resistance then printed an evening star, bearish continuation is in play after a pull-back to 200MA.
⚡️⚡️ #STMX/USDT ⚡️⚡️
Exchanges: ByBit USDT
Signal Type: Regular (Short)
Leverage: Isolated (2.7X)
Amount: 4.9%
Current Price:
0.005235
Entry Targets:
1) 0.005575
Take-Profit Targets:
1) 0.004305
Stop Targets:
1) 0.006420
Published By: @Zblaba
$STMX #STMXUSDT #StormX #DeFi
Risk/Reward= 1:1.5
Expected Profit= +61.5%
Possible Loss= -40.9%
stormx.io

STMX: NEXT INCREASE COIN AFTER PEPE?STMX showing a new level of volume.
We will follow up to see if it's able to break out.

Stmx Building Up for Massive Recovery Seems Like Has Already Bottomed Out And Building For Massive Breakout Testing Multiple Resistances At Same time Major Trendline Counter trendline Breaking bullish Pennant Once these resistances got cleared Recovery Will Be solid & Massive Expecting 400 to 450% bullish Wave Incase Of Successful breakout

STMX ANALYSIS (4H)Hi, dear traders. how are you ? Today we have a viewpoint to BUY/SELL the STMX symbol.
For risk management, please don't forget stop loss and capital management
When we reach the first target, save some profit and then change the stop to entry
Comment if you have any questions
Thank You

Expecting a 20% increase for STMX!At the moment, the asset has consolidated above the 0.238 Fibonacci level and continues to move upward.
In the local picture, I predict a breakthrough of the resistance level around $0.006 with subsequent upward movement, reaching $0.0075 (0.382 Fibonacci).
The final goal is $0.012 (0.618 Fibonacci).
This is not a financial recommendation, and everything you do is done at your own risk!

✳️ StormX Did Over 2800% In 2021, Repeat? Positive Is Possible! We are looking at an interesting level being activated for StormX (STMXBTC), it caught my attention recently and I belief this is one of those old ones that changed name. We used to trade it long ago as well.
STMXBTC grew by 2,800% in 2021 with Bitcoin going above $40,000 or $50,000.
So it doesn't matter how far up Bitcoin goes or the price, the potential is always there, these market are "irrational" as some of the old people love to say.
Anything and everything is always possible.
Just as the worst case scenario is possible, the best case scenario is also possible.
Just as wars and banking crisis can happen, also market booms, innovation, prosperity; good news, it is also always possible.
Just as today any institution can announce another major attack on something that you love... Out of nowhere, a major positive development can also show up, that's how it goes.
The interesting level here is 18 satoshis (0.00000018).
STMXBTC hit 18 sats in May 2022 and this lead to a 365% bullish wave.
In 2021 this same level became relevant before a 960% bullish wave.
It seems this level is being activated again... Not yet, but since trading volume has gone to zero, something might happen in the coming days.
That's basically it, it is likely that the bottom has already been hit and so we are bound to see a 2021 repeat?
Namaste.


STMX potential to increase more than 100%#STMX/USDT
$STMX holds above ascending support, which is the same with SMA20. also RSI is above HMA in daily and 4h time frames.
🐮 price has to break out from resistance zone and descending resistance that is the same with SMA200, then it can fly more than 100%.


SAND SANDBOX LONG 20220701Blue * 3 in Context
Waiting for Green in first ribbon
Risk Reward: 3.2
SAND, SANDBOX, SANDUSD, SANDUSDT, SANDUSDTP, CRYPTO, CRYPTOCURRENCY
DISCLAIMER
This is only a personal opinion and does NOT serve as investing NOR trading advice.
Please make your own decisions and be responsible for your own investing and trading Activities.

STMX StormX LONG 20220701Signal: Blue * 3
Waiting for Green for confirmation
Risk Reward: 3.5
STMX, StormX, STMXUSD, STMXUSDT, STMXUSDTP, CRYPTO, CRYPTOCURRENCY
DISCLAIMER
This is only a personal opinion and does NOT serve as investing NOR trading advice.
Please make your own decisions and be responsible for your own investing and trading Activities.

StormX Long-Term (360% Potential Mapped)Hello my fellow cryptocurrency trader, I hope you are having a wonderful day.
Here we have the STMXBTC pair, let's read what the charts are saying.
This altcoin has been going through a bear market for more than a year.
The ATH was hit April 2021.
After more than a year of correction, we are starting to see some recovery signals.
First, the trading volume has gone to virtually zero, signaling that the current trend (bearish) has no force.
Second, we see the weekly candle moving above EMA10 and EMA21 after a long-term higher low.
We have potential here for growth in the weeks and months to come.
Keep an eye out for this one and stay tuned for more.
Namaste.

Btc x USD are you thinking btc is a joke?stop seeing it as correlated with stocks or Bags
Bitcoin is unique and has a life of its own

STMX/USDT LONG SCALP SETUP!Hello everyone, if you like the idea, do not forget to support with a like and follow.
Welcome to this STMX/USDT TRADE setup. STMX looks good here.
STMX is trading inside a symmetrical triangle in 1hr time frame. Once it breaks out from the triangle expect a 15% move to the upside.
I'm buying some hear and adding more near the lower trendline of the triangle. You can either long now or long after the breakout.
Entry range:- $0.186-$0.188
Target:- 10-15%
SL:- $0.181
Lev:- 10x-20x
It's a low-risk and high-reward trade setup.
If you like this idea then do support it with like and follow.
Also, share your views in the comment section.
Thank You!
