How to interpret charts from indicators (trading strategy)Hello?
Traders, welcome.
If you "Follow", you can always get new information quickly.
Please also click "Boost".
Have a good day.
-------------------------------------
Please understand that the 'Vol & Trend' and 'Strength' sub-indicators are a synthesis of existing indicators, and cannot be disclosed because they have been judged to be unsuitable for publishing as public scripts.
----------------------------------------
It is not easy to see and interpret all the indicators displayed on the chart.
Therefore, it should be viewed and interpreted as the most critical interpretation method.
The first thing to look at is the position of the MS-Signal (M-Signal on the 1D chart), HA-Low, HA-High, M-Signal indicators on the 1W and 1M charts.
The most important of these is the location of the MS-Signal (M-Signal on the 1D chart) indicator and price.
The price is currently located below the MS-Signal indicator, indicating a downtrend.
To add one more thing to this, you can also check the relationship with the M-Signal indicator on the 1W and 1M charts.
Since the price is located below the M-Signal indicator on the 1W chart and 1M chart, it can be interpreted as a downtrend from a mid- to long-term perspective.
Therefore, you can see that the chart as a whole is starting to enter a downtrend.
In order to trade in this situation, you need to check the location of the HA-Low and HA-High indicators.
Currently, the HA-Low indicator is rising and is about to be created.
Therefore, if today's candlestick closes around now, we would expect the HA-Low indicator to form at 21552.44.
Therefore, it becomes important whether it can rise above 21552.44.
Since the M-Signal indicator on the 1W chart is passing around 21552.44, whether it can rise above 21552.44 has become an important question.
If the HA-Low indicator is created at 21552.44 and fails to rise above 21552.44, there is a possibility of renewing the previous low, so you need to think about countermeasures.
If support is received at the 21552.44 point, it is likely to touch the vicinity of the MS-signal (M-Signal on the 1D chart) indicator.
At this time, if you succeed in breaking through the MS-signal (M-Signal on the 1D chart) indicator, the possibility of rising to the vicinity of the HA-High indicator increases.
When the candle is formed today, the body of Heikin Ashi is showing a bullish sign.
Therefore, even if the price fails to rise, if the price remains above the Heikin Ashi body, it can be interpreted that there is a high probability of a rise around 21552.44.
At this time, you need to check whether it is supported or resisted at the point 21552.44.
As such, indicators on price charts represent trends and support and resistance roles, making it the most intuitive way to anticipate future movements.
To support this, 'Vol & Trend' and 'Strength' auxiliary indicators are utilized.
This auxiliary indicator strengthens the interpretation of the price chart indicators by providing additional evidence when the movements of the price chart indicators are judged ambiguous.
The 'Vol & Trend' sub-indicator is an indicator related to trading volume.
Therefore, you can check the buy strength and sell strength according to the movement of trading volume.
You can also check whether the volume is trending up or down.
The 'Strength' sub-indicator consists of the Stoch, StochRSI, RSI and CCI indicators.
The most important of these are the StochRSI indicator and the RSI indicator.
The RSI indicator is an indicator that is related to the HA-Low and HA-High indicators.
Therefore, it is not directly interpretable.
However, it is paired with the Stoch indicator and used as a basis for determining an upward trend or a downward trend.
It is currently looking to switch from a downtrend to an uptrend.
The StochRSI indicator is used to predict periods of volatility.
In addition, it is used as a basis for determining whether the trend will change to an uptrend or a downtrend in the future due to the change in the wave.
The current downtrend has turned to an uptrend, and it appears to be coming out of the oversold zone.
The CCI indicator is used as a basis for judging whether there is an upward trend or a downward trend.
However, it shows a trend that is more than short-term.
All of these indicators are scored as uptrend, stationary, and downtrend to make an overall judgment.
'Vol & Trend' indicator
Stationary : 1
Downtrend: 1
'Strength' indicator
Uptrend: 1
Matching: 2
Downtrend: 1
It is a situation where the basis for judgment of the sub-indicators is not needed, as all indicators that are near the current price chart are located below the price.
If it starts to show stationary or sideways movements near the price chart, then with the help of the indicators, you will be able to use it as a basis for judgment.
Someone said it's a chart with all the indicators, yes, that's right.
However, it is not always possible to see all indicators.
You only need to report it when necessary and use it as a basis for judgment.
We do not think of additional interpretation methods for each indicator other than the interpretation methods described above.
You should pay attention to this.
By combining support and resistance points here, you can create a trading strategy.
No matter how you analyze the chart, analysis ends its role with analysis.
To trade, you need to create a trading strategy based on chart analysis and correlation with support and resistance points so you can start trading.
However, when it comes to most chart analysis, there is a tendency to ignore trading strategies.
If you ignore your trading strategy, you will most likely not be able to find the right way to respond if the movement comes out in the opposite direction you thought.
Therefore, both chart analysis and trading strategy are important, but you need to do chart analysis to create a trading strategy.
If you forget about this and invest all your time and effort into chart analysis, you will end up with a higher chance of failing trades when you run out of time to craft your trading strategy right.
Therefore, chart analysis should be completed in the quickest way to give you plenty of time to create your trading strategy.
To do so, it is urgently necessary to make efforts to predict movements beyond the current one, rather than looking at the charts based on past movements and past patterns.
-----------------------------------------------------------------
** All descriptions are for reference only and do not guarantee profit or loss in investment.
** Even if you know other people's know-how, it takes a considerable period of time to make it your own.
** This is a chart created with my know-how.
---------------------------------
Stochastic RSI (STOCH RSI)

Why you should only think about charts when looking at chartsHello?
Traders, welcome.
If you "Follow", you can always get new information quickly.
Please also click "Boost".
Have a nice day.
-------------------------------------
When looking at the investment market, the first thing to do is to analyze the chart, and I wanted to say that the most important thing is how to create a trading strategy that suits your investment style with that chart.
-------------------------------------------------
Most people try to predict the movement of the investment market by looking at the announcement of various economic indicators and the contents of global issues (war, corona, etc.).
A big issue must be something that can cause great volatility in the investment market, but it is also clear that when such an issue accumulates, it can no longer create volatility.
So, you should be careful that trying to predict the movement of the investment market with such issues can make a wrong prediction.
Sudden big issues For example, in the case of a global shock due to an issue such as the 9/11 terrorist attack, it may cause great volatility without time to respond.
Other than these issues, most of the chart's price movement will react first.
In order to see this pre-reflection in advance, you need to look at the chart without reflecting factors that can change your psychological state, such as the announcement of various economic indicators or global issues.
I don't think this kind of work is a big deal, but it is a very important factor that occupies a fairly important part of investing.
We need to think a lot about how to figure out the trend only with the movement of the chart, away from the announcement of various economic indicators and thoughts about global issues.
As it rises above the indicator called Low, which was created on June 19, 2022, we can see that it is splitting the flow of the chart in half.
A change in the -100 indicator has always completed a low.
Although it is currently showing a different look than before, it will form a low as long as the -100 indicator is created.
The +100 indicator is an indicator that starts generating when a high is formed.
Therefore, a rise above the +100 indicator means that the uptrend to break the high is likely.
Therefore, in order to show a full-fledged uptrend from the current price position, it must rise above 38K.
The high point has been holding for a long time now.
However, the low point has not yet formed a clear point due to the change of the -100 indicator.
However, as the -100 point is moved near the current price range, the possibility of forming a low is very high.
This shows that we are facing a new trend.
Keeping the price above 17941.69 is most important from a short-term perspective to create this new trend.
The next most important thing is to keep the price above 20552.75.
Then, it completes the appearance of a trough (a phenomenon in which the price drops more before making a bigger rise) before showing an uptrend.
The StochRSI indicator is showing a fairly rapid decline.
We will verify what we said above by looking at where the Stoch RSI indicator finds support and resistance when it turns upside down.
This change in support and resistance points can tell you which direction the movement of the current chart is about to head.
You may think my explanation is inconclusive, but the conclusion has already been drawn.
We live in a flood of information.
It is quite difficult to infer an objective conclusion by synthesizing such a large amount of information.
Therefore, it is necessary to objectify all information using objectified tools and indicators.
Many celebrities' chart analysis methods and trading methods are introduced on the Internet or in books.
In order to make the contents of these people my own, it can only be acquired through numerous transactions and numerous experiences.
Over time, trends change and all patterns change and evolve.
In order to read the chart in line with these changes, I think it is better to use a simpler and faster way to analyze.
This is because you can keep up with the ever-changing trends.
It is more important to make your own mental state stable due to volatility by investing more time in the trading strategy than the time used for analysis.
What do you guys think?
-------------------------------------------------- -------------------------------------------
** All descriptions are for reference only and do not guarantee profit or loss in investment.
** If you share this chart, you can use the indicators normally.
** The MRHAB-T indicator includes indicators that indicate points of support and resistance.
** Check the formulas for the MS-Signal, HA-Low, and HA-High indicators at ().
** SR_R_C indicators are displayed as StochRSI (line), RSI (columns), and CCI (bgcolor).
** The CCI indicator is displayed in the overbought section (CCI > +100) and oversold section (CCI < -100).
(Short-term Stop Loss can be said to be a point where profit or loss can be preserved or additional entry can be made by split trading. This is a short-term investment perspective.)
---------------------------------

Regarding the SR_R_C (Stoch RSI + RSI + CCI) indicator...Hello?
Welcome, traders.
By "following", you can always get new information quickly.
Please also click "Like".
Have a good day.
-------------------------------------
We use several methods to analyze charts.
When you start studying charts, you study a lot of things.
However, you should forget everything you have studied, trends, patterns, and indicators when conducting real trading.
Otherwise, it is because you are stuck in the studied frame and try to fit the chart into the studied frame without interpreting the chart movement as it is.
I think that this behavior makes you analyze charts with subjective thoughts, which increases the chances of creating a wrong trading strategy.
To prevent this, we will explain a new indicator.
The SR_R_C indicator is a combined indicator of the Stoch RSI, RSI, and CCI indicators.
- The set values of the Stoch RSI indicator are 14, 7, 3, 3.
It is displayed as one line by treating it as the middle value of the K and D lines.
- The setting value of the RSI indicator is 14.
Instead of the existing Close value, we tried to maintain the continuity between the oversold section and the overbought section by calculating the Heikin Ashi Close value.
RSI indicators are displayed in columns.
- The set value of the CCI indicator is 9.
When the CCI value rises above the +100 point, it is marked as overbought, and when it falls below the -100 point, it is marked as oversold.
CCI indicators are displayed in bgcolor.
There are a lot of information on how to interpret each indicator if you search.
However, you can read the searched content and forget it.
The detailed interpretation method can add subjective interpretation to the objective information that can be obtained through the index, so you can forget about the method of interpretation of the index itself.
The core interpretation method of the SR_R_C indicator can be interpreted that if two or more of the three indicators are defective, a reversal of the trend is highly likely.
For example, if two or more of the Stoch RSI, RSI, and CCI indicators are in the oversold zone, it can be interpreted that there is a high possibility of turning into an uptrend.
Conversely, if it enters the overbought zone, it can be interpreted that it is highly likely to turn into a downtrend.
Trend patterns such as Fibonacci, Harmonic, and Elliott waves will show the result of the discussion depending on the selected point.
Therefore, in order to use these patterns, indicators, and tools, the selection of a selection point is the most important.
However, I think that auxiliary indicators, such as MACD, RSI, Stoch RSI, CCI, etc., can help to obtain objective information because there is no point of choice.
In conclusion, the reason for analyzing the chart is to make a trading strategy based on the analyzed content to make a successful trade, so it is important to analyze the chart in the most objective and essential way.
Even with any of these indicators, patterns, and tools, critically choosing the wrong support and resistance points will lead to trouble crafting a trading strategy.
Therefore, solid learning of support and resistance points is required before studying or utilizing all indicators, patterns, and tools.
Thank you for reading this long article to the end.
For reference, all indicators included in this chart can be used normally if the chart is shared.
Also, you can copy and paste the indicators to other layouts to use them neatly.

$COMP so ready for a full blown reversal #comp #compusdtThe overall pattern is a massive inverse fibonacci that's had a 227 touch followed by consolidation, & now, a higher low. The price will, I suspect, now form a regular fibonacci and touch the extension marked, which lines with the last price level on the small time frame. I suspect it will retrace there slightly, then continue up further. My ultimate target (in the coming weeks) is around $240, where the MA's/price levels are on the month chart. I see the stoch rsi on the week turning up to support this theory.

Using RSI and Stoch RSI IndicatorsHello?
Welcome, traders.
By "following", you can always get new information quickly.
Please also click "Like".
Have a good day.
-------------------------------------
The use of indicators has value in the sense that it provides objective information.
However, since the indicator is lagging behind (slower change) than the price and trading volume, care must be taken when using it.
To compensate for these shortcomings, support and resistance points are marked.
The RSI and Stoch RSI indicators are used to indicate support and resistance points, and to indicate oversold and overbought zones.
The oversold and overbought sections of the RSI indicator in the price chart are selected as the Close value of the price.
The oversold section and overbought section of the RSI indicator in the Long/Short-S indicator were selected as the Close value of the Heikin Ashi candle.
- Support and resistance points using RSI indicators are indicated by RSI 80 and RSI 20 indicators.
- Support and resistance points using the Stoch RSI indicator are indicated as Low and High indicators.
- In the Long/Short-S indicator, the Stoch RSI indicator was made to be displayed as the middle value of the K and D values.
In addition, the oversold section and the overbought section were made to be displayed, and a line was displayed to determine the strength of the ups and downs.
If it breaks out of the oversold zone and starts to rise, then falls without going up to the overbought zone, it means that the upside is weak.
Conversely, if it breaks out of the overbought zone and starts to fall and then rises without falling into the oversold zone, it means that the bearish force is weak.
- When the RSI and Stoch RSI indicators move out of the overbought zone, it is highly likely to lead to a strong decline.
RSI Indicator, Stoch When the RSI indicator moves out of the oversold zone, it is highly likely to lead to a strong uptrend.
I believe the support and resistance point indicators are weaker than the OBV, -100, +100, HA-Low and HA-High indicators.
However, I think the RSI and Stoch RSI indicators indicate meaningful support and resistance points because they mark the part that corresponds to the end of the wave.
Therefore, I think it can be used as a branch of split trading.
------------------------------------------------------------ -------------------------------------------
** All descriptions are for reference only and do not guarantee a profit or loss in investment.
** The MRHAB-T indicator, which is inactive on the chart, contains indicators that indicate support and resistance points.
** Background color of Long/Short-S indicator: RSI oversold and overbought sections
** Background color of CCI-C indicator: When the short-term CCI line is below -100 and above +100, oversold and overbought sections are displayed.
** The OBV indicator was re-created by applying a formula to the DepthHouse Trading indicator, an indicator disclosed by oh92. (Thanks for this.)
(Short-term Stop Loss can be said to be a point where profit and loss can be preserved or additional entry can be made through split trading. It is a short-term investment perspective.)
---------------------------------

Global Commodity Price Index versus SPXCommodities are basic good used in commerce of primary origin, produced on a large scale and used as raw materials by various economic agents.
Examples are soy, corn, cotton, meat, oil, natural gas, wood and water.
They are classified, according to their origin, into agricultural, livestock, mineral and environmental.
Its main function is the supply of raw materials for the production of industrialized goods.
Its commercialization works, according to the international market, through negotiations carried out on stock exchanges.
They are of paramount importance for the supply of primary goods for the functioning of society.
(Mundo Educação - UOL)
This index represents the benchmark prices which are representative of the global market.
They are determined by the largest exporter of a given commodity.
Prices are period averages in nominal U.S. dollars.
(fred.stlouisfed.org)
This index is at an all-time high, due to the high cost of energy and the world apocalyptic scenario.
The Stochastic RSI on the monthly chart is about to cross downwards.
Allied to this, the correlation with SPX is decreasing, which could indicate an important moment.
Historically, when these two technical events happened (stochastic crossing down and correlation falling), there was a sharp drop in SPX.
This can be seen in the red circles.

$COMP $COMPUSDT Large Inverse Fibonacci + Wedge-breakout coming?Like with most charts, I like to zoom all the way out to the monthly to see the larger picture at play. Here, it looks to be like there is a large inverse fibonacci retracement happening, in which the price has already hit the 227 extension. Combined with this, it looks as if the price has fallen within this large wedge, of which the month of July broke out of. Also, the price is squarely resting on the all time point of control. Lastly, the stoch rsi on the month is extremely flat and crossed. It looks to me as if the price is due for a move up! I do see a tiny fibonacci on the smaller time frames (an inverse one), that could result in the price dropping further from here. It just would seem unlikely to me though, given everything else I've mentioned that the chart has going in favor of a bullish scenario. That said, BTC to me looks as if it's got a bit of dropping left, and that could possibly affect the price trying to squeeze out any last bit of dropping possible.

Buy signal on weekly chart for $MSGEMadison Square Gardens Entertainment has upcoming earnings on August 19th. With the data provided by AXP travel & entertainment spending are up as spending has shifted from goods to experiences, entertainment, and services. This is exemplified in what retailers are reporting. And I think this will be positive for MSGE.
Currently, the middle and upper classes are doing fairly well while the lower class is suffering from the regressive tax of inflation, which is unfortunate. Those with disposable income and better economic situations are more likely to be MSGE customers boding for a good quarter and less risk from demand destruction.
MSGE is trading above its 52-week lows at 0.5629 its book value, providing tremendous value and a good risk-reward ratio. Its EBITDA and EBIT have gone from negative previously to positive in the past two quarters. Gross profit has turned positive for the past 4 quarters and net income has been improving over the past 3 quarters.
Anytime the K% crosses the D% on the Stoch RSI around the level of 1.73, MSGE goes for a decent rally. If you average the two past rallies (MSGE has a short trading history) from the week the bullish Stoch RSI cross happened to a relative peak, it's a 59.47% move that could be implied over the next 6-12 months. It has significant resistance at the $68.06 level.
It recently broke out through a downtrend line that started in mid-April. It is still in a downtrend, but it seems the prudent thing to do would be to create 1/3 to 1/4 of a full position in the stock now and buy the next tranche upon a higher low or higher high. I have a price target of $81 on it by the end of the year. That's roughly 40% upside from here. The highest PT on the street for MSGE is $100, the lowest is $63, and the average is $82.83.

Forecasts for QQQ (Nasdaq ETF)The further the price drops, the closer to the end of the drop we are, and the riskier it is to open a short position.
The risk-return relationship begins to not pay off.
Despite all this bad news out there, I still see the sun shine and I still see children playing in the park...

BTC/USDHi all,
BTC show's more and more recovery signs.
If nothing special happening, RSI is looking good.
StochRSI weekly is above 20.
MACD forming bullish divergence on weekly.
What do you think about BTC price?

Dow Jones: either up or downThe index is at the 21.4% Fibo retracement (March 23, 2020 retracement to the last top).
In the inverse retracement from January 3, 2022 to June 13, 2022, the price seems to have corrected in the region of 38.2%.
And it is in a bullish channel which in this context can be called a bearish flag.
The Stochastic RSI is retesting a resistance for the third time.
What to expect
In a bullish scenario, it is necessary for the price to fall at most to halfway through the channel, and remain above the 21.4% major retracement.
If it breaks the 38.2% inverse retracement, it will at least test the next 50% retracement.
Now, if it stays in the lower half of the channel, there is a higher probability of going all the way to the 38.2% retracement.

Bitcoin macro analysis (BTC/USD Index)Hello how are you?
On the long-term chart BTC follows a bullish channel.
It looks like he is testing the 38% Fibonacci retracement.
I placed the retracement considering the bottom of March 9, 2020 and the top of March 08, 2021.
Why did I consider these dates?
Explanation below.
BTC/USD indexed on Nasdaq
As Nasdaq is strongly correlated with BTC lately,
I analyzed in a separate chart the price of BTC indexed on the NDX.
Also on the same bull channel:
As we can see, we have the last bottom on March 9, 2020 and the last top on March 08, 2021.
Then, tracing the Fibonacci retracement by joining these dates, we saw that the price corrected until the 50% correction
Maybe test again? I don't know.
Fibonacci Channel
Reached -50% retraction.
Stochastic RSI, RSI and 100-month smoothed exponential moving average
On the monthly chart the price is in a theoretically cheap region, rarely seen.
On the RSI, the indicator broke the historic low.
And the stochastic RSI is still pointing down. When it starts to turn upwards it will be a good sign.
Another interesting sign is the 100-month regularized exponential moving average, as circled.
On-chain data
The volume of BTC on the network indicates important points.
In the yellow circles, where we had high volume on the Bitcoin network, this foreshadowed a strong swing in price, both up and down.
The percent of circulating supply that has not moved in at least 1 year
This indicator appears to be reversing downwards, which indicates that the circulating supply that has been idle for at least 1 year is starting to move.
We can see an inverse relationship as shown by the arrows.
Drawdown
In the past there was a drop of 87%, 80% and 82% approximately.
Now we're down 70%.
Have already fixed everything, or will you test that red diagonal channel, correcting 74% or more?
Stable coins dominance (dollar strength in the crypto market)
The dominance of the three main stable coins (USDT, USDC and DAI) has an inverse correlation to BTC.
When it goes up, the price of BTC goes down, and vice versa.
We have a bullish channel on the stable coin dominance chart, and when dominance reaches the top channel, it is usually a great buy signal, as shown in green circles.
Dollar dominance in the traditional market
Tested 50% Fibo retracement.
Hope this helps.

Bull Flag being formed for $DWAC continuation upward?Price is sitting right against the major trend line, inverse fibonacci on the 2nd to last extension, stoch rsi & mac d on weekly looking good too... thoughts?
Not trading advice*

First Destination of Bitcoin is $24.000Considering both the Bear Flag pattern and the Stochastic Relative Strength Index on the daily timeframe, as well as the weekly timeframe pattern, BTC's eyes are on the grave. The search for liquidity at a much lower level, in the $18-20K range, should not be overlooked. Of course, we may see an increase up to $35,000, but this possibility remains a difficult one when we consider the correlation to the US500 and US100 parities.

DAL 46.64 ShortFundamental Analysis
With Airlines getting business back up and running in a slow fashion, the Airline industry as a whole has to return back to profitability. However it looks like investor confidence is still not bullish, and DAL isn't an exception to this case. For the short-run, there is still a bearish outlook for the industry considering the consistent Covid variants causing havoc.
Technical Analysis
Price volatility since last year month-to-month.
Price is in a downtrend at resistance level of 46.64.
Widening channel with no breakout creating lower lows in the price without higher highs. This is a bearish trend in the near term.
MACD is flat near the zero line.
RSI level at 51.80. A breakout here can signal a potential upward momentum, however confirmation with a breakout at 46.46 is also needed.
Stochastics showing mixed readings so it's not valid.
Fibonacci retracements showing lows have retraced to 23.6 while resistance at 61.8 level has remained steady.
Candlesticks showing that every time there has been a push to the upside, a doji star has confirmed a reversal on several occassions.

Long various alt coins soonHello everyone,
I am seeing a potential buy signal on Ethereum and similar alt coins coming up soon (within the next couple of days if not now). I am a purely technical analyst. I believe all the possible news and rumors that all the traders in the world have heard and acted on are already priced in the market. So to me reading what the market is telling me is like reading ALL the news, without reading any! Though I do enjoy reading crypto news at times. Just remember the trading axiom to buy the rumor and sell the news. This was certainly the case for ADA and DOT last year!
Anyway I have offered an explanation of my system. I will not give you an analysis that suggests it can go two ways. Those kinds of analyses are pointless in my opinion. How does that help? I am telling you the market is showing at least a short term bottom, and so it is time for me to jump in.
In my previous analysis, I suggested a hard down move for bitcoin, possibly to 20k. But now that I am seeing this signal, I have changed my mind. The signals appear when they appear, and I heed them, regardless of what I speculated on prior.
That is it for now. If you have any questions, please feel free to ask.
Wishing you the best!

Closing the Week (1/14) Above The Trend Line with MA's Curled UpTrade at your own risk.
My analysis is bullish. We've got a green week candle about to close above the trend line, the 100 & 200 day moving averages on the week chart about to cross, the Mac D & Stoch RSI on the week looking decent to pump, moving averages strongly curling & trapping on the month, similarly on the 3 month. My target would be 200 day moving average on the day chart (as it hit during last years run) or slightly lower due to the MA coming down sharply on the 3 month, right around $14.50.

MATIC new entry point ! Hello everyone,
I know everyone is trying to be bullish on Matic, but on the 4 hours time frame we can find the current pattern Matic is sitting on.
The Stoch RSI is showing overbought signals pushing the price to drop by 14% during next week and 30% by the end of the year.
Make sure to follow my profile for more information related to the cryptocurrency market!
Have a nice trading week!

$88 Tomorrow Based on Technical Analysis227 Fibonacci Extension level, backed up by a clearing & close above all moving averages, a supportive stoch rsi & mac d on both the day & the week, & a historic matching of Tuesday/Wednesday pumps- most notably, June 2nd (Wednesday). Further support of analysis = 10 minute til market close massive volume push. Feel free to share my chart as well as comments & ideas. Thanks.

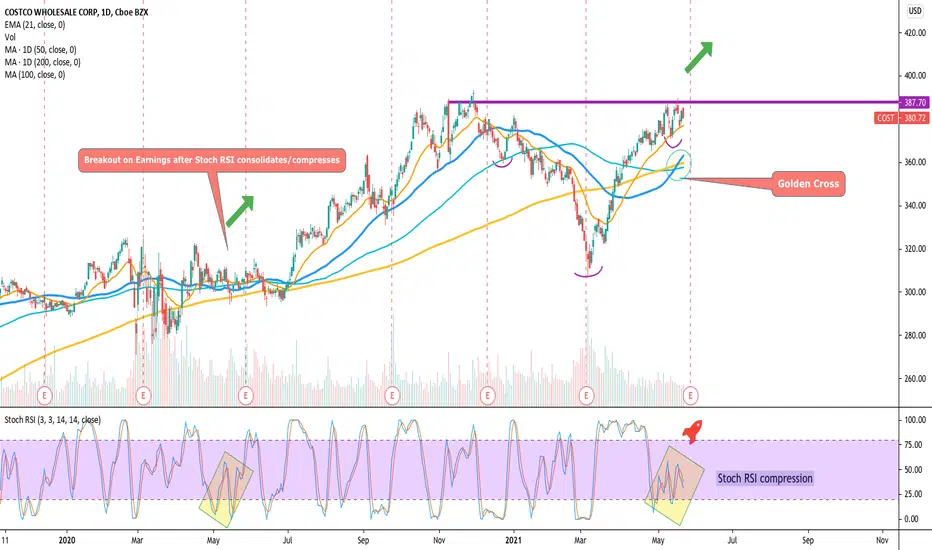
action packed chart of COST; to the moon off earnings!Bullish inverse head and shoulders formation on the daily chart for Costco. Earnings around the corner with expectations of a huge beat. Costco has their membership fees/incentives to help protect margins as inflation becomes a factor in everything from supplies to freight. Earnings whispers are $2.44 a share with a consensus of at least $2.28/share.
Stoch RSI compression repeated itself. The last time Stoch RSI compressed/consolidated right before earnings it went on a huge 18% run over the next 98 days, 27% over the next 186 days, and 22% by the next earnings report (196 days later).
"History doesn't repeat itself but it often rhymes"
I expect a similar breakout on earnings with this repeated pattern although price action has been terrible this earnings season even with beats & good guidance. COST could be the exception. Probably smartest to play it through options to risk less.
www.earningswhispers.com
btcusd weekly stochrsi suggests next few weeks should be greenthis trendline on btcusd's weekly stochrsi has held very significant support in the past and it seems to be doing the same now. If it does hold support on this line I anticipate the next few weeks to be bullsh ones.

OXT - BTC My AnalysisI am looking bullish on OXT / BTC I am trying to buy between 0.00001330 - 0.00001380 BTC
Stop Loss: 0.00001100
Sell target 1: 0.00001600
Sell target 2: 0.00001800
Guys don't forget to Click Like button for appreciate me.
Thank you so much.

13.8k or 7.8k? ~ DECISION TIME FOR BITCOIN IN THE NEXT WEEK -Yurlo
Please SMASH the like button if you appreciate the visuals I've provided for you today 👍
I've got both scenarios CLEARLY painted for you guys (bullish and bearish bias) In the next week I'm sure we'll get a better understanding on the market direction and what's in store for the month of October.
With the US elections coming up I wouldn't be surprised if the markets start to get VERY volatile.
Today is Sunday, and this day specifically usually paints the picture for the markets and how they will look over the next week.
Anything over 11k and I'm sure we'll see 11.2k - 11.4k
Anything under 10.5k and I'm sure we'll see 9.8k- 10.3k
Stoch RSI is suggesting possible overbought price action: will provide updates around today's daily close (8pm EST)
Are you currently bullish or bearish for $BTC (Bitcoin) or any market really.
Remember to stick to your trading plan unless your ideas get invalidated.
Sticking to low leverage will allow your brain to function at a more logical level instead of getting sucked into the head games played by the markets.
Proper sleep, eating well, and most importantly taking care of yourself will lead to a successful trading career.
90% of traders fail, don't be apart of that group.
Learn how to outperform the market by finding your niche in the market, and what works for you.
