Abbott and Amazon: Two Bright Spots in a Sea of Red◉ Abbott Laboratories NYSE:ABT
● The stock previously faced strong resistance near the $134 level, leading to an extended consolidation phase.
● During this period, a Rounding Bottom pattern emerged, signalling a potential continuation of the upward trend.
● Following a recent breakout, the stock has surged to its all-time high and is expected to maintain its upward momentum in the coming days.
◉ Amazon NASDAQ:AMZN
● Since August 2020, Amazon's stock has been consolidating, forming a clear Inverted Head & Shoulders pattern.
● After breaking above the neckline, the stock rallied sharply and reached an all-time high near $242.
● Following this, the price pulled back to retest the breakout level and with a successful retest, the stock is now well-positioned to resume its upward trend.
Stockanalysis

Breakout in Organogenesis Holdings Inc...Chart is self explanatory. Levels of breakout, possible up-moves (where stock may find resistances) and support (close below which, setup will be invalidated) are clearly defined.
Disclaimer: This is for demonstration and educational purpose only. This is not buying or selling recommendations. Please consult your financial advisor before taking any trade.

Breakout in ADT Inc...Chart is self explanatory. Levels of breakout, possible up-moves (where stock may find resistances) and support (close below which, setup will be invalidated) are clearly defined.
Disclaimer: This is for demonstration and educational purpose only. This is not buying or selling recommendations. Please consult your financial advisor before taking any trade.

Tesla (TSLA) Share Price Drops by Over 8%Tesla (TSLA) Share Price Drops by Over 8%
The Tesla stock chart today paints a grim picture for investors, as TSLA's price during trading on 25 February:
→ fell by more than 8% in a single day;
→ dropped below the psychologically significant $300 per share mark for the first time since early November 2024 (despite nearing $500 in late December 2024).
Why Tesla (TSLA) Shares Have Fallen
Tesla’s sales in Europe fell by 45% in January compared to the same period last year, even as overall EV sales in Europe grew by 37%.
This sharp drop in European sales has heightened concerns that CEO Elon Musk’s political activities are negatively affecting the company’s business.
Technical Analysis of Tesla (TSLA) Stock Chart
Price movements in 2024 formed a key upward trend channel (marked by blue lines), but yesterday’s decline led to a bearish break below the lower boundary of this trend. Specifically:
→ The $330 level, where the lower blue boundary was breached, now appears to be a significant resistance level.
→ The B→C retracement is approximately 50% of the A→B decline – a bearish signal.
→ Price movements in 2025 outline a descending trend channel (marked in red), which is becoming increasingly relevant.
If the psychological support level of $300 per TSLA share fails to hold, the price may continue to decline towards the key $270 level. This level acted as resistance to growth in the second half of 2024 but was broken after news of Trump’s victory.
Tesla (TSLA) Share Price Forecast
Analysts remain cautiously optimistic, possibly hoping that Musk’s close ties with Trump will help accelerate the launch of Tesla’s robotaxi service.
Another potential positive driver could be Tesla’s entry into the Indian market.
According to TipRanks:
→ 13 out of 35 surveyed analysts recommend buying TSLA shares;
→ The average 12-month price target for TSLA is $357.
Trade on TradingView with FXOpen. Consider opening an account and access over 700 markets with tight spreads from 0.0 pips and low commissions from $1.50 per lot.
This article represents the opinion of the Companies operating under the FXOpen brand only. It is not to be construed as an offer, solicitation, or recommendation with respect to products and services provided by the Companies operating under the FXOpen brand, nor is it to be considered financial advice.

Nike (NKE) Shares Surge 5%Nike (NKE) Shares Surge 5%
The sportswear giant was among the top performers in the US stock market yesterday after Jefferies analysts raised their outlook:
→ Upgraded NKE stock from “Hold” to “Buy”
→ Increased the price target from $75 to $115
Amid fierce competition, NKE shares had been in a downtrend throughout 2023-2024, but a leadership change (which we covered in September 2024) may have acted as a catalyst for a turnaround.
Technical Analysis of Nike (NKE) Stock
Jefferies’ upgrade triggered a bullish breakout of the downtrend line (marked in red).
The $71 level has proven to be a key support, particularly in February, when NKE hit its yearly low. Bears attempted to resume the downtrend, but failed—since then, the stock has surged approximately 17%, forming a sharp reversal (marked by an arrow), which is a bullish signal.
In Wyckoff Method terminology, this move could indicate a Terminal Shakeout, marking a transition from the Accumulation phase to the Mark-Up phase.
Nike (NKE) Stock Forecast
Jefferies analysts hold the most optimistic outlook among their peers. According to TipRanks:
→ 15 out of 28 analysts recommend buying NKE shares
→ The average 12-month price target for NKE is $86
Trade on TradingView with FXOpen. Consider opening an account and access over 700 markets with tight spreads from 0.0 pips and low commissions from $1.50 per lot.
This article represents the opinion of the Companies operating under the FXOpen brand only. It is not to be construed as an offer, solicitation, or recommendation with respect to products and services provided by the Companies operating under the FXOpen brand, nor is it to be considered financial advice.

Berkshire Soars to New Heights: Q4 Results Smash Records◉ Q4 Result Highlights:
● Berkshire Hathaway reported record operating earnings of $14.5 billion, driven by higher interest rates and a strong performance in its insurance business.
● Insurance investment income soared by 48% to $4.1 billion.
● The company's cash reserves hit an all-time high of $334.2 billion, reflecting Warren Buffett's cautious yet strategic approach to investments in a volatile market.
● Net earnings for Q4 2024 stood at 19.7billion ,down from 19.7billion, down from 37.6 billion in Q4 2023, primarily due to lower gains from its investment portfolio.
● Book value per share rose by 1% sequentially and 16% year-over-year, reaching $451,507, underscoring the company's consistent value creation.
◉ Technical Observations:
● The stock is currently in a strong uptrend, consistently achieving higher highs and higher lows.
● After a period of consolidation, the price has broken out decisively and is now trading at all-time highs.
● This bullish momentum is expected to continue, potentially driving the stock price even higher in the near term.

Coinbase (COIN) Shares Drop to Three-Month LowCoinbase (COIN) Shares Drop to Three-Month Low
The Coinbase (COIN) chart shows that, for the first time in 2025, the share price has fallen below the psychological $250 level.
Bearish factors impacting COIN:
One key factor driving negative sentiment is the confirmed hack of the ByBit cryptocurrency exchange, raising concerns about deposit security in the industry. According to media reports:
→ The attack may have been carried out by North Korean hacker group Lazarus.
→ Hackers allegedly drained Ethereum tokens worth between $1 billion and $5 billion from ByBit’s wallet.
→ This is the largest crypto hack in history.
Another factor is growing concerns about the US economy, which have negatively impacted stock markets. As reported by Reuters:
→ The S&P 500 index (US SPX 500 mini on FXOpen) fell by 1.66% on Friday, marking its worst performance of the year.
→ The decline followed a drop in Walmart’s share price and weak consumer sentiment data.
→ Friday’s Purchasing Managers’ Index (PMI) figures were below previous levels. Investors are now focusing on this week’s release of the Personal Consumption Expenditures (PCE) price index—the Federal Reserve’s preferred inflation gauge.
Technical Analysis of Coinbase (COIN) Chart
COIN price movements form an upward channel (marked in blue), but several bearish signals are emerging:
→ The price has dropped into the lower half of the channel.
→ The psychological resistance level has shifted from $300 to potentially $250.
If bearish sentiment persists, COIN’s share price could fall further towards a support zone consisting of:
→ A bullish gap (marked in purple).
→ The lower boundary of the blue channel.
→ The psychological $200 level.
Coinbase (COIN) Price Forecast
Wall Street analysts remain cautiously optimistic following Coinbase’s quarterly earnings report on 13 February, which exceeded expectations.
According to TipRanks:
→ 10 out of 21 analysts recommend buying COIN.
→ The average 12-month price target for COIN is $350.
Trade on TradingView with FXOpen. Consider opening an account and access over 700 markets with tight spreads from 0.0 pips and low commissions from $1.50 per lot.
This article represents the opinion of the Companies operating under the FXOpen brand only. It is not to be construed as an offer, solicitation, or recommendation with respect to products and services provided by the Companies operating under the FXOpen brand, nor is it to be considered financial advice.

Breakout in Innodata Inc...Chart is self explanatory. Levels of breakout, possible up-moves (where stock may find resistances) and support (close below which, setup will be invalidated) are clearly defined.
Disclaimer: This is for demonstration and educational purpose only. This is not buying or selling recommendations. Please consult your financial advisor before taking any trade.

Walmart (WMT) Stock Drops Over 6%Walmart (WMT) Stock Drops Over 6%
As shown in the Walmart (WMT) stock chart, trading on 20th February closed at $97.26, whereas the previous day, the stock was trading around $103. The decline of over 6% marks the largest drop in Walmart (WMT) stock price in 15 months.
Why Did Walmart (WMT) Stock Drop?
The bearish momentum emerged after Walmart’s earnings report, which was actually quite strong, as:
→ Sales growth reached 5.2%;
→ The company exceeded analysts' expectations (earnings per share were 2% higher than forecasts);
→ Walmart announced a 13% dividend increase.
However, WMT stock fell because the retail giant released a profit forecast for 2025 that came in below market expectations. This was attributed to uncertain consumer behaviour and geopolitical conditions. Additionally, investors may have been dissatisfied with increased executive compensation.
Walmart (WMT) Stock Technical Analysis
The chart shows that after the decline, the price is consolidating near support levels formed by:
→ The lower boundary of the ascending channel;
→ Former resistance around $96.
The situation resembles November 2023, when the market also reacted negatively to an earnings report. However, WMT stock later recovered, and a similar scenario could unfold in 2025.
Analytical Walmart (WMT) Stock Price Forecasts
Analysts remain optimistic. According to Yahoo Finance:
→ The average 12-month price target for WMT is $107.25;
→ Of the 42 analysts surveyed, 38 recommend buying WMT stock.
Trade on TradingView with FXOpen. Consider opening an account and access over 700 markets with tight spreads from 0.0 pips and low commissions from $1.50 per lot.
This article represents the opinion of the Companies operating under the FXOpen brand only. It is not to be construed as an offer, solicitation, or recommendation with respect to products and services provided by the Companies operating under the FXOpen brand, nor is it to be considered financial advice.

KEI INDUSTRIES - Short Term Trade Setup with Liquidity Grab!INDUSTRIES LTD today. This one’s looking interesting, with the stock currently in a consolidation phase , stuck between a supply zone and a demand zone . The best part? We’ve had a liquidity grab near the demand zone, which means the stock is back in a sweet spot for a potential move upwards. If the price starts bouncing off that level again, we could see some nice profits.
For the entry point , you want to get in around ₹3,750-3,700 , right where the stock is testing the demand zone. The stop loss should be just around at ₹3,500 , giving you some room to manage the trade. The profit target is around ₹4,560 , near the supply zone. That gives you a good risk-to-reward ratio and the potential for a solid move if the stock continues up.
Disclaimer:- This analysis is for educational purposes only. Please trade responsibly and consult a financial advisor before making any decisions.
If you found this analysis helpful, don’t forget to like, follow, and share your thoughts in the comments below! Your support keeps me motivated to share more insights. Let’s grow and learn together—happy trading!

Advance Micro Devices Inc , Its ready to rock....Is this the level the big fish are at then if so we need to swim with them....
Supply and demand set and forget

Share Price of Analog Devices (ADI) Soars by Approximately 10%Share Price of Analog Devices (ADI) Soars by Approximately 10% in a Day
The S&P 500 Index (US SPX 500 mini on FXOpen) set a new record yesterday, following the release of minutes from the latest Federal Reserve monetary policy meeting. As it became known, committee members would like to see inflation decline further; however, in their view, potential changes in trade and immigration policies could "complicate" the disinflation process.
Analog Devices (ADI) Shares Among Top Gainers
Amid predominantly bullish sentiment in the current US stock market, Analog Devices (ADI) shares surged by approximately 10% in a single day following the release of quarterly results. The company exceeded analysts' expectations on earnings per share by 5.5%, while gross revenue came in 2.68% above forecasts.
According to MarketWatch:
→ Analog Devices has increased its dividend by 8% and expanded its share buyback programme by $10 billion.
→ CEO Vincent Roche stated that "we have moved past the cyclical downturn, and the situation has turned in our favour," giving an optimistic outlook for the second half of 2025.
Technical Analysis of Analog Devices (ADI) Shares
The ADI stock chart shows that the price is forming a long-term upward trend (illustrated by the blue channel), with the following key observations:
→ The ongoing rise suggests a major breakout of the Bull Flag pattern, indicating a resumption of long-term growth following a correction.
→ The psychological level of $200 has shifted from resistance to support—a similar development could occur at the $240 level, where the current all-time high is located.
Analog Devices (ADI) Share Price Forecast
Analysts are mostly optimistic. According to Yahoo Finance:
→ 18 out of 29 surveyed analysts recommend buying ADI shares.
→ The average 12-month price target for ADI shares stands at $257.
Trade on TradingView with FXOpen. Consider opening an account and access over 700 markets with tight spreads from 0.0 pips and low commissions from $1.50 per lot.
This article represents the opinion of the Companies operating under the FXOpen brand only. It is not to be construed as an offer, solicitation, or recommendation with respect to products and services provided by the Companies operating under the FXOpen brand, nor is it to be considered financial advice.

Alibaba Shares (BABA) Hit 12-Month High Ahead of Earnings ReportAlibaba Shares (BABA) Hit 12-Month High Ahead of Earnings Report
Chinese e-commerce giant Alibaba is set to release its quarterly earnings report on 20 February. The Wall Street Journal cites optimistic analyst estimates, projecting gross revenue of 279.03 billion yuan (approximately $38 billion), up from 260.35 billion yuan a year ago and 236.50 billion yuan in the previous quarter.
Investor sentiment has been buoyed by Alibaba co-founder Jack Ma’s presence at an event with Chinese President Xi Jinping. According to Barron’s, this signals government efforts to restore confidence in the private sector, particularly in technology. At present, such factors may be having a greater impact on the stock market than geopolitical headlines or Trump’s tariff policies.
These and other drivers—including a recent partnership between Alibaba and Apple to integrate AI features into the iPhone 16 series—have fuelled bullish momentum. As a result, Alibaba shares (BABA) have surged nearly 20% in February, reaching their highest level since February last year.
Technical Analysis of Alibaba Shares (BABA)
In our previous analysis on 29 January, we noted that BABA’s price movements were forming key levels for an Andrews' Pitchfork pattern, indicating a bullish outlook.
Currently, the price has:
→ Surpassed the October high near $118.
→ Gained bullish momentum after consolidating around the psychological $100 level.
The RSI indicator signals overbought conditions, suggesting a potential correction. However, given the strong news flow, any pullback may be shallow.
Alibaba (BABA) Stock Forecasts
According to BarChart, after years of underperformance, many investors are looking at China with renewed optimism for 2025. Hedge fund Appaloosa Management’s founder and president, David Tepper—whose net worth stands at $21.5 billion—recently acquired Alibaba shares, as per the latest 13F filings.
He may believe that the Chinese stock market is significantly undervalued, based on the “Warren Buffett Indicator,” which compares a country's total market capitalisation to its GDP. A ratio below 100 suggests undervaluation, while a higher figure indicates overvaluation. Currently, China’s market cap-to-GDP ratio stands below 70%, compared to over 200% for the US.
Tepper is not alone in his bullish stance. According to TipRanks:
→ 7 out of 8 analysts surveyed recommend buying BABA shares.
→ The average 12-month price target for BABA is $129.13.
Trade on TradingView with FXOpen. Consider opening an account and access over 700 markets with tight spreads from 0.0 pips and low commissions from $1.50 per lot.
This article represents the opinion of the Companies operating under the FXOpen brand only. It is not to be construed as an offer, solicitation, or recommendation with respect to products and services provided by the Companies operating under the FXOpen brand, nor is it to be considered financial advice.

NVIDIA & xAI’s Grok 3: A Game-Changer or Overhyped AI Play?NVIDIA’s stock ( NASDAQ:NVDA ) has been on an unstoppable rally, driven by the AI boom. Now, with Elon Musk’s xAI set to launch Grok 3 —trained on an impressive 100,000 NVIDIA H100 GPUs —the market is buzzing with speculation. Could this be the catalyst that propels NVDA to the next level, or are we approaching an AI-driven valuation bubble?
Key Developments :
Massive GPU Demand : xAI’s Grok 3 will utilize a staggering 100,000 H100 GPUs, reinforcing NVIDIA’s dominance in AI hardware and boosting its market position.
Supercomputer Expansion : Musk’s team is building one of the most powerful AI training clusters in Memphis, Tennessee. This development could significantly increase NVIDIA’s long-term revenue streams, given its key role in powering these systems.
Release Date : Grok 3 is set to launch today, February 17, 2025(4 AM GMT) , with a live demonstration, which may influence sentiment around AI-related stocks, especially NVIDIA.
Market Sentiment & Risks : While these developments seem bullish for NVIDIA, some analysts, including hedge funds like Elliott Investment Management, have raised concerns over the potential for overvaluation as the AI euphoria spreads.
Conclusion: Grok 3’s launch will be a pivotal moment, with NVIDIA at the heart of the AI revolution. Whether this sparks a fresh rally or raises concerns about an AI bubble remains to be seen.
------------------------------------------------------------------------------
Now, let's use Technical Analysis to analyze NVIDIA stock(NVDA) .
In terms of technical analysis, the loss of an Ascending Channel is not good news for any asset and is a sign of weakness in the upward trend . This has happened to the NVIDIA stock(NVDA) .
From the point of view of Classical Technical Analysis , it seems that NVIDIA stock is completing the Rising Wedge Pattern .
Educational tip : The Rising Wedge Pattern is a bearish reversal or continuation pattern characterized by converging upward-sloping trendlines. It signals weakening bullish momentum, often leading to a breakdown below support. A confirmed breakout to the downside indicates a potential price decline.
I expect the launch of Grok 3 Artificial Intelligence(AI) can increase at least +10%+15% of NVIDIA stock(NVDA) . If the upper line of the Rising Wedge Pattern breaks , we can expect a further increase [ the next target can be Yearly Resistance(1=$175.68)(in case of breaking) ].
What’s your take? Drop your thoughts about NVIDIA in the comments! 👇
Be sure to follow the updated ideas.
NVIDIA Analyze (NVDAUSD), Daily time frame.
Do not forget to put Stop loss for your positions (For every position you want to open).
Please follow your strategy; this is just my idea, and I will gladly see your ideas in this post.
Please do not forget the ✅' like '✅ button 🙏😊 & Share it with your friends; thanks, and Trade safe.

$AAL ANGLO AMERICAN: ROCK SOLID OR CRACKING UNDER PRESSURE?💥 ANGLO AMERICAN: ROCK SOLID OR CRACKING UNDER PRESSURE?
Is Anglo American ( LSE:AAL ) a hidden gem 💎 or just another miner struggling with the weight of falling revenues and shaky markets? Let’s break it down with real data and fresh insight! 👇
1/ Revenue collapse? Yep.
FY 2024 revenue plummeted 📉 12.72% from £35.12B to £30.65B.
Net income: Crashed 93.73%, from £4.51B to a measly £283M. 💸
EPS tanked 93.70%, but Q4 production of copper and iron ore beat expectations. 📊
2/ What’s Anglo’s Plan? 🤔
They're reshaping their portfolio with a $4.9B growth strategy.
Restructuring, asset sales, and potential Amplats spinoffs are on the table.
The big question: Can these moves revive profitability? 🔄
3/ Undervalued or just stuck in the mud? 💲
Price today: 2,548.00p
Analyst target: 2,629.29p—modest upside, but deeper models say 32% undervaluation based on recovery potential. 📈
What would you do? Buy the dip, or wait it out? 🤔
4/ How’s it doing vs. competitors? 🏆
Compared to BHP, Rio Tinto, and Glencore:
Anglo shows mixed performance—some production wins, but revenue and earnings are lagging.
Competitors have been quicker to capitalize on demand for metals like iron ore and copper.
5/ The Risk Factor ☠️:
Commodity price swings: When metals drop, so does Anglo. 💣
Operational risks: Labor shortages and regulatory headaches, especially in South Africa 🇿🇦 and Brazil 🇧🇷.
Environmental scrutiny: Mining faces rising costs tied to sustainability 🌱 and compliance.
6/ SWOT Analysis 💡
Strengths:
✅ Diversified portfolio (metals crucial to green tech)
✅ Global reach and strong infrastructure
Weaknesses:
⚠️ Earnings decline, revenue underperformance
⚠️ Vulnerability to commodity volatility
7/ Opportunities vs. Threats:
Opportunities:
🚀 Metals demand will grow with green energy transitions—think electric vehicles and renewables.
🚀 Strategic asset divestitures could unlock value.
Threats:
🌍 Political instability in major regions
🌍 Tightening environmental regulations (higher costs ahead)
8/ Investment Thesis:
Anglo is in a tough spot. Undervalued? Maybe. But recovery depends on commodity prices and restructuring success. 🛠️
If they nail their strategy, there’s upside potential—but risk is high in today’s market. 📉
9/ What’s next? 🔮
Keep an eye on restructuring news—asset sales could shift market sentiment.
Monitor production trends in copper and iron ore.
Look out for green tech demand driving metals growth over the long term. 🌱
10/ What do YOU think?
📈 Bullish: It’s gonna recover.
🔄 Hold: Let’s wait for more signs.
🚫 Bearish: Nope, this one’s toast.

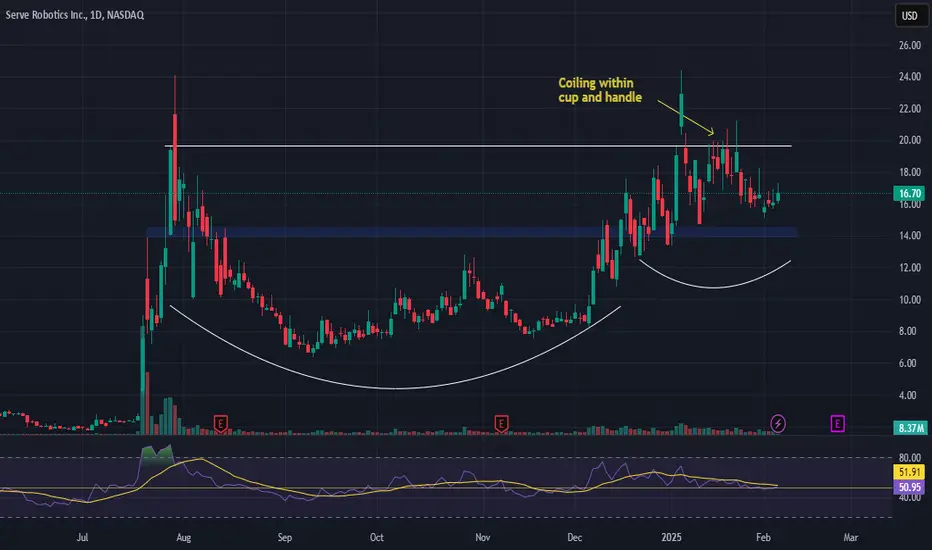
Serve Robotics (SERV) Analysis Company Overview:
Serve Robotics NASDAQ:SERV is a pioneer in autonomous last-mile delivery, leveraging AI-driven electric robots to reduce costs and emissions. With strong partnerships and financial backing, SERV is positioned to disrupt traditional delivery models.
Key Catalysts:
$450 Billion Market Potential by 2030 🌎
Serve’s $1-per-trip model could revolutionize delivery economics.
Strategic Partnerships – Uber & 7-Eleven 📦
Uber’s $11.5M investment and integration with Uber Eats enhance scale.
7-Eleven partnership strengthens Serve’s retail delivery presence.
Strong Financial Backing – Secured Through 2026 💰
$166M raised since December 2024, ensuring funding stability.
NVIDIA and Delivery Hero investments validate AI-driven robotics.
Investment Outlook:
Bullish Case: We are bullish on SERV above $14.00-$14.50, supported by disruptive potential, strategic partnerships, and financial strength.
Upside Potential: Our price target is $31.00-$32.00, reflecting market expansion, AI adoption, and industry transformation.
📢 Serve Robotics—Redefining Last-Mile Delivery. #AI #Robotics #AutonomousDelivery #SERV
UPS Share Price Plunges to a 4.5-Year LowUPS Share Price Plunges to a 4.5-Year Low
Last week, United Parcel Service (UPS)—one of the world's largest parcel delivery, supply chain management, and courier service companies—released its quarterly report.
→ Earnings per share: Actual = $2.75, Expected = $2.53
→ Total revenue: Actual = $25.4 billion, Expected = $25.3 billion
Despite EPS exceeding forecasts by over 8%, UPS shares plunged to $110, a level last seen in mid-2020 when the US economy was recovering from the pandemic.
Investor Disappointment Over Amazon Cutbacks
The stock decline was driven by UPS’s decision to further reduce its business with Amazon. The company stated that its 2025 revenue would be around $6 billion below analysts’ expectations due to halving the volume of Amazon parcels it processes—despite Amazon being its largest customer.
UPS CEO Carol Tomé explained that the company wants to move away from Amazon as profit margins in this segment are too low, negatively impacting overall profitability.
According to The Wall Street Journal (WSJ), UPS management is under pressure from dissatisfied investors, a significant portion of whom are long-serving company employees. Due to UPS's unique shareholder structure, veteran employees—who control 63% of voting rights—have suffered billions in collective losses due to the stock's decline.
Shortly after releasing the report, UPS announced a quarterly dividend increase from $1.63 to $1.64 per share, though this is unlikely to offset the stock’s 40% decline over the past three years.
Technical Analysis of UPS Stock
UPS shares remain in a downward trend (as indicated by the red channel).
Following the latest drop:
→ The price fell below $124, a key resistance level in 2018–2019.
→ The stock reached the lower boundary of the channel, which may act as a support level, preventing a further decline toward the psychological $100 mark.
Is Now the Time to Buy UPS Shares?
Analysts have lowered their UPS price targets:
→ Stephens revised its target from $140 to $127.
→ DA Davidson downgraded UPS from "Buy/Add" to "Neutral", cutting the target from $154 to $116.
→ Redburn Atlantic reduced its target from $159 to $137.
→ Loop Capital revised its target from $120 to $115.
→ Oppenheimer lowered its target from $146 to $126.
From a technical perspective, reversing the multi-month downtrend seems challenging. However, if UPS reconsiders its Amazon strategy under investor pressure, this could provide an opportunity for buyers.
Trade on TradingView with FXOpen. Consider opening an account and access over 700 markets with tight spreads from 0.0 pips and low commissions from $1.50 per lot.
This article represents the opinion of the Companies operating under the FXOpen brand only. It is not to be construed as an offer, solicitation, or recommendation with respect to products and services provided by the Companies operating under the FXOpen brand, nor is it to be considered financial advice.

Kinross Gold $KGC: Cash Flow King or Gold Risk? Kinross Gold (KGC): Cash Flow King or Gold Risk? 🏅💰
1/10
Kinross Gold NYSE:KGC surged 5.07%, hitting $10.57 per share. Revenue last quarter was $1.432 billion, driven by strong operations. 🔥 The gold sector might be glimmering again...
2/10
Earnings alert! NYSE:KGC releases its Q4 2024 results on February 12, 2025. Last quarter’s EPS beat was impressive: $0.232 vs. $0.178 expected. Will they outperform again? 📈
3/10
Free cash flow is booming: $450 million last quarter. Kinross repaid $650 million of a $1 billion loan. That’s aggressive debt reduction—investors love a clean balance sheet. 💸
4/10
Kinross trades at a P/E ratio of 17.59, relatively reasonable for its sector. Analysts see upside, especially considering the company’s free cash flow yield, outperforming peers like Barrick and Newmont. 📊
5/10
Risks remain. Gold price volatility directly impacts NYSE:KGC 's profitability. A price downturn would hurt margins despite their strong cash flow. ⚖️ Can Kinross hedge against gold’s wild price swings?
6/10
Strengths: NYSE:KGC ’s operational efficiency and strong cash flow allow it to reduce debt aggressively. Its high-quality assets in stable regions offer a defensive advantage. 🛡️
7/10
Weaknesses: Kinross relies heavily on gold prices. Operational issues at key mines like Bald Mountain or Round Mountain could disrupt production guidance. ⛏️ Will mine performance stay strong?
8/10
Opportunities: Kinross can expand production in current and new mining regions. Operational improvements could boost margins, especially with ongoing debt reduction enhancing financial flexibility. 🏆
9/10
Threats: Competition for mining rights, inflationary pressures, and geopolitical risks threaten NYSE:KGC ’s long-term stability. Can they manage rising costs while expanding operations? 🌐
10/10
Is Kinross Gold NYSE:KGC worth the risk or reward in 2025? Vote now! 🗳️
Golden buy opportunity 🏆
Hold for now 🔄
Too risky, avoid ⚠️

AngloGold Ashanti $AU: A Hidden Goldmine or High-Risk Play? AngloGold Ashanti ( NYSE:AU ): A Hidden Goldmine or High-Risk Play? 🏅🔍
1/10
AngloGold Ashanti NYSE:AU shows 6% annual revenue growth but faces a tough challenge—earnings have been declining at -35.8% per year! Industry earnings are up 10.9%, leaving AngloGold behind. 📉 Can they turn things around?
2/10
Major shakeup: NYSE:AU is acquiring Egypt’s largest gold miner, Centamin, in a $2.5 billion deal. This could reshape their future production and reserves. 🚨 Bold move or financial strain?
3/10
Asset sales are also in play! AngloGold is fielding bids for the Tropicana gold mine in Australia. A strategic move to streamline operations—or desperation for cash flow? 🏗️
4/10
Analysts have set a target price of $31.75, hinting at upside potential from the current price. Yet NYSE:AU ’s ROE of 3.4% and net margins of 2.3% lag behind peers. 📊 Is the stock undervalued or stuck in a profit rut?
5/10
Operational risks loom large. AngloGold operates across Africa and South America, exposing it to geopolitical instability, regulatory shifts, and potential disruptions. 🌍 How stable are these gold mines?
6/10
Strengths: AngloGold has diversified operations across multiple continents and a strong asset base. That reduces over-dependence on any one region. 🗺️ Diversity is their defensive edge.
7/10
Weaknesses: Declining earnings are a red flag for investors. High operational costs further squeeze profitability. 💸 Can NYSE:AU control expenses while scaling up production?
8/10
Opportunities: The Centamin acquisition could supercharge their gold production. Meanwhile, asset sales might optimize their portfolio by shedding low-margin operations. 🏆 Growth through smarter assets?
9/10
Threats: Volatile gold prices remain a double-edged sword. Plus, political risks in key regions like Africa can disrupt mining operations. ⚠️ Can AngloGold weather these external shocks?
10/10
Your turn! Is AngloGold Ashanti NYSE:AU a buy, hold, or avoid? Vote now! 🗳️
Golden buy opportunity 🏆
Hold for now 🔄
Too risky, avoid ⚠️

JD.com (JD) AnalysisCompany Overview:
JD.com NASDAQ:JD is one of China’s leading e-commerce and logistics giants, rapidly expanding into cloud computing and AI-driven solutions. With a strong focus on efficiency, retail innovation, and policy-driven tailwinds, JD.com is well-positioned for long-term growth.
Key Catalysts:
Chinese Government's “Trade-In” Policy Boost 📈
The extended consumer electronics trade-in policy is expected to accelerate sales, driving demand across JD’s platform.
Full Acquisition of Dada Nexus 🚚
JD’s 100% ownership of Dada Nexus strengthens its last-mile delivery efficiency, improving logistics and customer satisfaction.
Omnichannel Expansion: JD MALL & JD E-Space 🏬
JD is expanding its offline footprint with JD MALL and JD E-Space, enhancing its omnichannel retail strategy for deeper customer engagement.
AI & Cloud Computing Growth ☁️
JD’s investment in cloud and AI positions it as a tech-driven e-commerce leader, driving new revenue streams.
Investment Outlook:
Bullish Case: We are bullish on JD above $34.00-$35.00, supported by policy tailwinds, logistics integration, and AI-driven retail innovation.
Upside Potential: Our price target is $60.00-$62.00, reflecting enhanced logistics, e-commerce expansion, and growing cloud adoption.
📢 JD.com—Innovating E-Commerce with AI & Logistics. #JD #ECommerce #AI #CloudComputing

Jyoti CNC Trying to make a comeback. Jyoti CNC Automation Ltd. engages in the provision of manufacturing solutions for computerized machine cutting tools. It operates under the Within India and Outside India geographical segments.
Jyoti CNC Automation Ltd. CMP is 1273.05. The Positive aspects of the company are Company with Low Debt, Company able to generate Net Cash - Improving Net Cash Flow for last 2 years and Companies with rising net profit margins. The Negative aspects of the company are extremely high Valuation (P.E. = 105.5), High promoter stock pledges, Increasing Trend in Non-Core Income and Companies with growing costs YoY for long term projects.
Entry can be taken after closing above 1293Targets in the stock will be 1337, 1368 and 1406. The long-term target in the stock will be 1434, 1463 and 1513. Stop loss in the stock should be maintained at Closing below 1157 or 1079 depending on your risk taking ability.
Disclaimer: The above information is provided for educational purpose, analysis and paper trading only. Please don't treat this as a buy or sell recommendation for the stock or index. We do not guarantee any success in highly volatile market or otherwise. Stock market investment is subject to market risks which include global and regional risks. I or my clients might have positions in the stocks that we mention in our posts. We will not be responsible for any Profit or loss that may occur due to any financial decision taken based on any data provided in this message. Do consult your investment advisor before taking any financial decisions. Stop losses should be an important part of any investment in equity.

Persistent can be persisted withPersistent Systems Ltd. is a technology services company. It engages in delivering digital business acceleration, enterprise modernization, and next generation product engineering services. The firm operates through the following segments: Banking, Financial Services & Insurance, Healthcare & Life Sciences, and Technology Companies & Emerging Verticals.
Persistent Systems Ltd. CMP is 6090.90. The Positive aspects of the company are Company with Low Debt, Company with Zero Promoter Pledge, Stocks Outperforming their Industry Price Change in the Quarter and Company able to generate Net Cash - Improving Net Cash Flow for last 2 years. The Negative aspects of the company are high Valuation (P.E. = 77), Companies with growing costs YoY for long term projects and MFs decreased their shareholding last quarter.
Entry can be taken after closing above 6094 Targets in the stock will be 6241, 6392 and 6547. The long-term target in the stock will be 6704 and 6810. Stop loss in the stock should be maintained at Closing below 5850 or 5566 depending on your risk taking ability.
Disclaimer: The above information is provided for educational purpose, analysis and paper trading only. Please don't treat this as a buy or sell recommendation for the stock or index. We do not guarantee any success in highly volatile market or otherwise. Stock market investment is subject to market risks which include global and regional risks. I or my clients might have positions in the stocks that we mention in our posts. We will not be responsible for any Profit or loss that may occur due to any financial decision taken based on any data provided in this message. Do consult your investment advisor before taking any financial decisions. Stop losses should be an important part of any investment in equity.

Vistra Corporation (VST) AnalysisCompany Overview:
Vistra Corporation NYSE:VST is a prominent U.S. integrated power company, combining retail and wholesale energy services. The company is actively transitioning toward renewable energy while maintaining a balanced portfolio with its conventional energy assets. Vistra's commitment to sustainability is reflected in the recent development of solar projects, positioning it well for the future of energy.
Key Growth Drivers
Renewable Energy Expansion:
Large Solar Projects in Illinois: Vistra's recent connection of two significant solar projects underscores its push to diversify into clean energy. This not only aligns with consumer demand for green energy but also supports regulatory trends favoring sustainability.
Strategic Diversification: By enhancing its portfolio with renewables, Vistra is positioning itself as a leading player in the transition to cleaner energy sources.
Operational Adaptability with Conventional Assets:
Baldwin Power Plant Extension (1,185 MW): The extension of this key asset through 2027 allows Vistra to maintain reliable power generation in the MISO market while transitioning to renewables. The move exemplifies strategic balance, ensuring reliability while supporting green energy goals.
Operational Flexibility: Vistra's ability to adapt its mix of assets enables it to capitalize on diverse market conditions.
Leadership and Regulatory Expertise:
Rob Walters Appointment: The recent addition of Rob Walters as an independent director strengthens Vistra’s regulatory and strategic leadership. This move enhances the company’s ability to navigate the evolving energy landscape, building investor confidence in its long-term strategy.
Investment Thesis:
Vistra is well-positioned to capitalize on both renewable energy growth and conventional energy reliability. The company's expansion into solar power and commitment to sustainable energy solutions, combined with the extension of key assets like Baldwin Power Plant, reinforces its competitive edge in a transforming energy market.
Bullish Case:
Target Price Range: $210.00–$220.00
Entry Range: $140.00–$142.00
Upside Potential: Strong growth potential due to diversified energy portfolio, renewable energy investments, and strategic leadership appointments.
