NANO Nuclear Energy (NNE) AnalysisCompany Overview: NANO Nuclear Energy NASDAQ:NNE is at the forefront of the clean energy revolution, focusing on small modular reactors (SMRs) and microreactors. These innovations are vital for delivering reliable, clean energy to remote areas and are also being considered for space exploration, potentially opening up vast new revenue streams.
Key Catalysts:
Small Modular Reactors (SMRs): SMRs offer a scalable, reliable solution for generating clean energy, especially in areas where traditional infrastructure is difficult or costly to develop.
Space Exploration Potential: Microreactors are being considered for space exploration, which could lead to significant revenue opportunities in the burgeoning space economy.
Partnership with Idaho National Laboratory: This collaboration adds credibility to NNE’s technology and accelerates the path to commercialization.
Vertical Integration: NNE is vertically integrating its operations with plans for a HALEU fuel fabrication facility, ensuring control over critical components and improving efficiency.
Expansion Commitment: The recent acquisition of a 14,000-square-foot facility in Oak Ridge, TN, demonstrates the company's commitment to growth and infrastructure development.
Investment Outlook: Bullish Outlook: We are bullish on NNE above $12.00-$13.00, based on its leadership in SMRs and promising new markets like space exploration. Upside Potential: Our upside target is $25.00-$26.00, driven by strong partnerships, technological advancements, and commercialization progress.
🚀 NNE—Leading the Future of Clean Energy with Innovation. #NuclearEnergy #SMRs #CleanTech
Stockanalysis

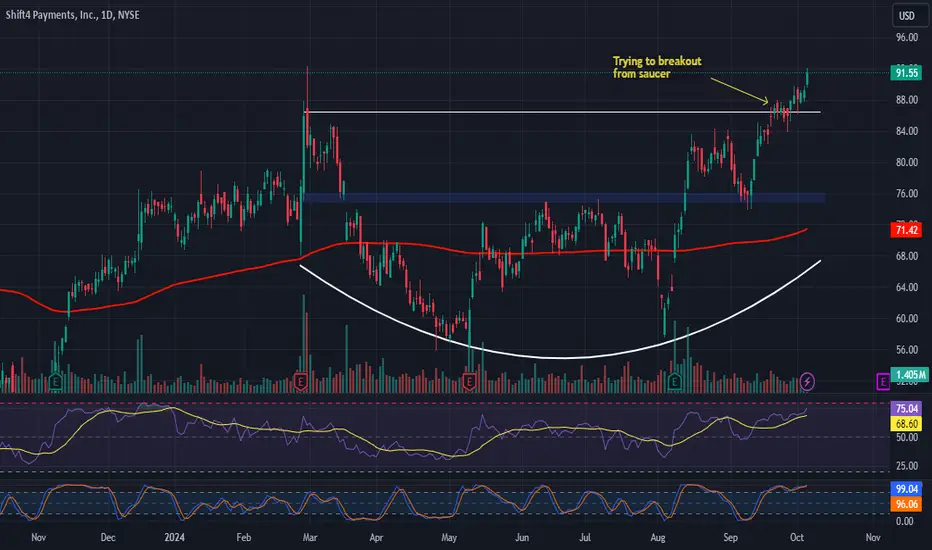
Shift4 Payments (FOUR) Analysis Company Overview: Shift4 Payments NYSE:FOUR continues to demonstrate impressive growth, specializing in payment solutions tailored for industries such as hospitality, entertainment, and sports venues. With a unique focus on vertical integration, Shift4 is capturing more market share through high-profile partnerships and technological innovation.
Key Catalysts:
Strong Payment Processing Growth: In Q2 2024, Shift4 processed a remarkable $40.1 billion in payments, up from $26.8 billion in Q2 2023. This marks a 75% CAGR since 2020, highlighting sustained growth in its core business.
High-Profile Partnerships: Recent partnerships with Nobu Hotel and the Chicago Bears stadium reflect its expanding reach and capability to serve large-scale clients in major industries.
Insider Confidence: CEO Jared Isaacman’s purchase of 86,000 shares underscores strong insider confidence in the company’s long-term growth prospects.
Investment Outlook: Bullish Outlook: We are bullish on Shift4 Payments above $75.00-$76.00, given its accelerating growth in payment processing and strategic partnerships. Upside Potential: Our upside target is $118.00-$120.00, based on continued market share gains and operational momentum.
🚀 FOUR—Revolutionizing Payments with Strong Growth. #Payments #Shift4 #Fintech
HDFC Bank in a Bearish Momentum: Key Resistance and Support ZoneHDFC Bank in a Bearish Momentum: Key Resistance and Support Zones
NSE:HDFCBANK is currently exhibiting a negative trend, facing downward pressure near key levels:
Resistance Zones: 1706 / 1716 / 1726 – These levels could act as significant barriers, with potential sell-offs if the stock fails to breach these zones.
Short-Term Support Levels: 1645 / 1595 – A break below these support zones could accelerate the downside move, signaling further weakness in the stock.
As market volatility increases, it’s crucial to observe price action around these levels to anticipate the next move.
Disclaimer: I am not a SEBI-registered Research Analyst. This analysis is solely for educational purposes. Please do your own research and consult a financial advisor before making any trading decisions.

Newmont (NEM) AnalysisCompany Overview: Newmont NYSE:NEM , as the world’s largest gold miner, is well-positioned to benefit from the ongoing gold bull market. The price of gold is projected to rise to $2,500 per ounce by the end of 2024, creating a significant tailwind for Newmont’s operations.
Key Catalysts:
Gold Production Strength: With forecasted production of 6.9 million ounces in 2024, Newmont has a major advantage, given its scale and operational capacity. The bullish gold market will enhance its profitability.
Newcrest Acquisition: The acquisition of Newcrest Mining is a game-changer, adding $500 million in synergies and boosting cash improvements by $2 billion through portfolio optimization. This deal strengthens Newmont’s competitive position and enhances long-term value creation.
Investment Outlook: Bullish Outlook: We are bullish on Newmont above $48.00-$49.00, based on strong gold market fundamentals and the strategic value of the Newcrest acquisition. Upside Potential: Our target for NEM is $78.00-$80.00, driven by rising gold prices and operational efficiencies from the acquisition.
🚀 NEM—Gold Market Leader Positioned for Growth. #Gold #Mining #Newmont

Pegasystems (PEGA) AnalysisCompany Overview: Pegasystems NASDAQ:PEGA is strategically positioned to leverage the increasing demand for AI-powered customer service solutions. By incorporating advanced technologies such as natural language processing and chatbots, PEGA is enhancing user experiences and streamlining customer interactions.
Key Catalysts:
AI-Powered Solutions: The rising interest in AI technologies provides a significant opportunity for Pegasystems to grow its client base and expand its offerings in customer service automation.
Leadership Insights: CEO Alan Trefler emphasizes the company's commitment to innovation, which is expected to attract new clients and deepen existing relationships, driving revenue growth.
Financial Goals: Pegasystems aims to achieve the "Rule of 40" by 2024, balancing revenue growth with free cash flow margin. This metric is crucial for appealing to investors looking for sustainable growth and profitability.
Investment Outlook: Bullish Outlook: We are bullish on Pegasystems above $61.00-$62.00, reflecting confidence in its strategic initiatives and market potential. Upside Potential: Our target for PEGA is set at $84.00-$86.00, driven by expected growth in AI solutions and the successful implementation of financial goals.
🚀 PEGA—Pioneering AI in Customer Service. #AI #CustomerExperience #Pegasystems

Tencent Holdings (TCEHY) Analysis Company Overview: Tencent Holdings OTC:TCEHY is poised for growth as the regulatory environment in China becomes more favorable, particularly in the gaming sector. The resumption of gaming license approvals has revitalized the market, allowing Tencent to launch new titles that resonate with consumers.
Key Catalysts:
Regulatory Recovery: The easing of regulatory scrutiny around gaming licenses has set the stage for Tencent to reinvigorate its gaming portfolio.
Success of Dungeon & Fighter Mobile: The release of Dungeon & Fighter Mobile has been a standout success, generating $270 million in iOS revenue within the first 30 days. This performance highlights strong consumer demand and effective marketing strategies.
Future Revenue Potential: Analysts forecast that Dungeon & Fighter Mobile could generate between RMB 15-18 billion in 2024, positioning it as Tencent’s most commercially successful game in five years, which bodes well for the company's overall revenue growth.
Investment Outlook: Bullish Outlook: We are bullish on Tencent above $47.00-$48.00, reflecting confidence in its ability to capitalize on the resurgent gaming market. Upside Potential: Our target for TCEHY is $70.00-$72.00, driven by the anticipated success of new game launches and a healthier regulatory landscape.
🚀 TCEHY—Unlocking Growth in Gaming and Beyond. #Gaming #Tencent #MarketRecovery

Tesla (TSLA) AnalysisCompany Overview: Tesla NASDAQ:TSLA continues to lead the electric vehicle (EV) market, and its ambitious leap into humanoid robotics with the Optimus robot could open up massive new revenue streams. CEO Elon Musk projects this venture could unlock a $200 trillion opportunity, particularly in household and manufacturing applications.
Key Catalysts:
Optimus Robot: Visionary investors like Cathie Wood of ARK Invest estimate a $12 trillion market for humanoid robotics, where Tesla aims to be at the forefront, revolutionizing industries.
Full Self-Driving (FSD): Tesla's advanced FSD technology could be licensed to other automakers, creating new revenue channels. Musk’s long-term goal of launching an autonomous ride-hailing business or robotaxi fleet offers additional upside potential, which could reshape the automotive and transportation landscape.
Expanding Market Potential: Beyond EVs, Tesla's expansion into AI-driven robotics and autonomous vehicles places it at the intersection of multiple high-growth markets.
Investment Outlook: Bullish Outlook: We are bullish on Tesla above $193.00-$195.00, signaling strong confidence in its continued leadership in both the EV and emerging robotics sectors. Upside Potential: Our target for TSLA is $360.00-$370.00, driven by the potential commercialization of humanoid robots and further advancements in autonomous driving technology.
⚡️ TSLA—Driving the Future with Innovation in EVs, AI, and Robotics. #EVs #AI #AutonomousDriving

Construction Partners (ROAD) Analysis Company Overview: Construction Partners NASDAQ:ROAD is strategically expanding its footprint in the southern U.S. through the acquisition of John G. Walton Construction Company, which enhances its market position in Mobile, Alabama. This acquisition not only adds valuable assets but also aligns with the company’s growth strategy, reinforcing its commitment to expanding its operational capabilities.
Key Catalysts:
Strategic Acquisition: The purchase of John G. Walton Construction is expected to create operational synergies and improve efficiencies, which could lead to enhanced profitability in a key market.
Market Presence: This move strengthens ROAD's presence in a vital geographic area, positioning it to capture more market share as infrastructure spending continues to grow in the region.
Institutional Confidence: The increased stakes from institutional investors like Dimensional Fund Advisors and Vanguard signal strong confidence in the company’s strategic direction and future growth potential.
Investment Outlook: Bullish Outlook: We are bullish on ROAD above $58.00-$59.00, reflecting optimism about the company’s operational enhancements and market expansion. Upside Potential: The target for ROAD is set at $85.00-$86.00, driven by anticipated growth from recent strategic initiatives and strong market dynamics.
🔨 ROAD—Building a Stronger Future Through Strategic Growth. #Construction #MarketExpansion #StrategicAcquisition

Telephone and Data Systems (TDS) Analysis Company Overview: Telephone and Data Systems NYSE:TDS is actively expanding its fiber and broadband infrastructure, positioning itself for future growth in a high-demand sector. The company’s recent investments are paying off, with steady growth in its service addresses and strong financial performance.
Key Catalysts:
Fiber Expansion: TDS added 28,000 marketable fiber addresses in Q1 2024, increasing its fiber footprint significantly. The company has grown its service addresses by 12% year-over-year, reaching 1.7 million addresses, a key driver of its future revenue growth.
CEO Confidence: CEO Leroy Carlson has expressed optimism regarding TDS’s growth prospects, particularly emphasizing the company's strategic investments in broadband infrastructure.
Financial Performance: In Q2, TDS demonstrated strong financial health, with ARPU (Average Revenue Per User) growth, better cost management, and higher free cash flow, all of which enhance its earnings potential in the coming quarters.
Investment Outlook: Bullish Outlook: We are bullish on TDS above the $19.00-$20.00 range. Upside Potential: The upside target for TDS is set at $30.00-$31.00, driven by its expanding fiber infrastructure, solid financial performance, and the strategic broadband investments that position the company for long-term growth.
📡 TDS—Leading the Fiber and Broadband Revolution. #FiberExpansion #BroadbandGrowth #TDSInvestments 💡

Verizon (VZ) AnalysisCompany Overview: Verizon Communications Inc. NYSE:VZ is the largest mobile carrier in the U.S., maintaining a dominant position in the wireless market. The company has a core focus on wireless services, which continues to drive its financial performance and future growth potential.
Key Catalysts:
Strong Wireless Revenue Growth: Verizon's wireless revenue grew by 3.5% year-over-year, reaching $19.8 billion in the latest quarter. This growth was driven by a solid consumer base and effective pricing strategies, demonstrating resilience and a stable demand for Verizon's wireless services.
Consumer Segment Performance: Consumer revenue also saw a year-over-year increase of 1.5% to $24.9 billion, highlighting the company’s strong customer retention and ability to capitalize on pricing flexibility.
5G Expansion: Verizon is investing heavily in 5G technology, with ambitious plans to expand into smart cities and wireless robotics, positioning the company for long-term growth in next-gen connectivity solutions.
Q2 Financial Results: Verizon reported total revenue of $32.8 billion for the second quarter, showcasing its financial stability and growth trajectory in an evolving telecommunications landscape.
Investment Outlook: Bullish Outlook: We are bullish on VZ above the $37.00-$38.00 range. Upside Potential: The upside target for Verizon is set at $56.00-$58.00, driven by wireless revenue growth, consumer segment strength, and expansion into 5G technologies.
📶 Verizon—Connecting the Future with 5G. #VerizonWireless #5GRevolution #TechGrowth 📱

US2000 Selloff | Small Caps Looking FrailLot's going on in this picture, my apologies for all the noise.
Consistent with the overall market and recently published indexes, I am looking for more downside in US Domestic small-cap stocks.
If you thought or if you were influenced that this inflation bubble economy would persist forever, I advise you consider a different source of information. "Do your own research" does NOT mean, go find something that agrees with your preferences.
Rather, #DYOR as the kids say, is an opportunity for individuals and teams alike to look deep within themselves and ask if they have what it takes to achieve: honesty, humility, and truth.

Dole (DOLE) AnalysisCompany Overview:
NYSE:DOLE PLC is a global leader in the fresh produce industry, with a strong portfolio of fruits and vegetables. As consumer demand for healthier food options continues to grow, Dole is well-positioned to capitalize on this trend. The company’s vast global network and operational scale give it a competitive edge in meeting this rising demand for fresh, healthy produce.
Key Catalysts:
Health-Conscious Consumer Trends: The increasing consumer shift toward healthier eating habits supports Dole’s premium valuation. As more consumers prioritize fresh produce, Dole stands to benefit from expanded market share and revenue growth.
Strong Start in 2024: Executive Chairman Carl McCann expressed optimism about Dole’s performance, aiming to maintain its adjusted EBITDA levels comparable to 2023. This guidance reflects the company’s strong operational execution and market positioning.
EMEA Segment Growth: The EMEA Diversified Fresh Produce segment has been a major driver of growth, posting a 44% year-over-year increase in Q4 segment adjusted EBITDA, driven by strong sales and improved margins. This robust performance is expected to continue supporting the company’s overall profitability.
Investment Outlook: Bullish Outlook: We are bullish on DOLE if it holds above the $14.00-$15.00 range. Upside Potential: The upside target for DOLE is set at $23.00-$24.00, driven by consumer trends toward healthier eating, strong EMEA segment performance, and operational execution.
🍍 Dole—cultivating a healthy future! #DoleFresh #HealthyLiving 🌱📈

IMAX (IMAX) Analysis Company Overview: IMAX is well-positioned to benefit from the ongoing recovery in the entertainment industry. As a leader in premium large-format cinema experiences, IMAX leverages its asset-light business model to generate strong returns through system installations and global expansion. The company’s focus on providing immersive, high-quality viewing experiences has proven successful, with blockbusters like Top Gun: Maverick drawing moviegoers back to theaters in droves.
Key Catalysts:
System Installations and Backlog Growth: IMAX has seen a significant rise in system installations, contributing to an expanding backlog. This growth reflects the increasing demand for premium viewing experiences, as theaters capitalize on the higher ticket prices that IMAX screens can command.
Asset-Light Business Model: IMAX’s asset-light approach reduces capital expenditure while maximizing returns, making it a more scalable and efficient business. This model allows the company to focus on expanding its footprint and enhancing its technology, driving long-term growth.
Shift Towards Blockbusters: As the movie industry increasingly focuses on big-budget films, IMAX is set to benefit from its niche in premium cinema experiences. The success of films like Top Gun: Maverick underscores the demand for immersive theater experiences, positioning IMAX as a key player in this evolving market.
Investment Outlook: Bullish Outlook: We are bullish on NYSE:IMAX if it holds above the $19.00-$20.00 range. Upside Potential: The upside target for IMAX is set at $30.00-$31.00, driven by the growth in system installations, a strong backlog, and the resurgence of blockbuster films.
🎥 IMAX—immersive experiences leading the future of cinema! #IMAX #CinemaRevival 🚀🎬

Planet Fitness (PLNT) AnalysisCompany Overview: Planet Fitness operates a unique franchise-based model, which reduces capital expenditure and enhances free cash flow. The company owns just 256 of its 2,575 locations, leveraging its franchisees to drive expansion and growth. With its affordable $10 monthly fee, Planet Fitness has successfully attracted a broad demographic of casual gym-goers, keeping membership churn low and ensuring steady revenue streams.
Key Catalysts:
Franchise Model Efficiency: The franchise-based model allows Planet Fitness to expand rapidly while keeping capital expenditures low, resulting in strong free cash flow. This model also minimizes risk and enables the company to focus on brand development and member experience.
Strong Membership Base: Planet Fitness currently serves 18.7 million members, capitalizing on its low-cost membership structure to maintain a steady flow of new members while minimizing attrition. This large and stable customer base is a key driver of its long-term growth.
Sales Momentum: Recent financial performance has been strong, with same-store sales up 8% and total revenue increasing by 14% to $278 million. This indicates continued growth momentum, suggesting that Planet Fitness is successfully navigating the competitive gym industry.
Investment Outlook: Bullish Outlook: We are bullish on NYSE:PLNT if it holds above the $72.00-$73.00 range. Upside Potential: The upside target for Planet Fitness is set at $98.00-$100.00, supported by its efficient franchise model, strong membership growth, and positive sales trends.
🏋️ Planet Fitness—building strength in numbers and cash flow! #PLNT #FitnessGrowth 🚀💰

Sea Limited (SE) AnalysisCompany Overview: Sea Limited, a global consumer internet company, operates across three core businesses: e-commerce (Shopee), digital entertainment (Garena), and financial services (SeaMoney). The company has returned to growth investments to capitalize on its diverse business segments.
Key Catalysts:
E-commerce Momentum: Shopee's gross merchandise volume (GMV) forecast has been revised upward to reflect mid-20% growth, indicating strong momentum in its e-commerce segment. This renewed growth suggests that Sea's strategic investments are yielding positive results, particularly in expanding its reach across Southeast Asia and Latin America.
Gaming Recovery: Garena's flagship game, Free Fire, has seen a 19% year-over-year rebound in daily active users. This recovery signals a resurgence in the gaming division, which has long been a key revenue driver for Sea. Additionally, a potential relaunch of Free Fire in India could provide a significant boost, given the large gaming audience in the country.
Revenue Growth Outlook: Sea Limited is forecasting double-digit revenue growth for 2024, driven by Shopee's expansion, Garena's gaming resurgence, and the ongoing scaling of SeaMoney.
Investment Outlook: Bullish Outlook: We are bullish on NYSE:SE if it holds above the $67.00-$68.00 range. Upside Potential: The upside target for Sea Limited is set at $130.00-$135.00, driven by continued e-commerce growth, gaming recovery, and potential entry into new markets.
🌊 Sea Limited—e-commerce growth and gaming rebound fuel bullish outlook! #SE #Ecommerce #Gaming 🚀📈

Teva Pharmaceuticals (TEVA) Analysis Company Overview: Teva Pharmaceuticals, a global leader in generics and specialty medicines, is poised for growth as it expands its biosimilar portfolio and resolves major legal challenges.
Key Catalysts:
Biosimilar Launch: NYSE:TEVA plans to launch AVT04, a biosimilar to Johnson & Johnson's blockbuster drug Stelara, by February 2025. Stelara, which generates $10 billion in annual sales, presents a significant market opportunity for Teva as a lower-cost alternative. This biosimilar could drive substantial revenue growth for the company.
Opioid Settlement: The resolution of the $4.3 billion opioid settlement reduces legal uncertainty and allows Teva to focus on business expansion. This development provides a clearer path forward for the company’s financial health.
Operational Improvements: With improved supply chains and enhanced gross margins, Teva is positioned to strengthen profitability. This operational efficiency will be crucial in boosting the company's bottom line as it rolls out new products.
Investment Outlook: Bullish Outlook: We are bullish on TEVA if it holds above the $15.50-$16.00 range. Upside Potential: The upside target for Teva Pharmaceuticals is set at $23.00-$24.00, driven by the upcoming biosimilar launch, legal clarity, and improved operational performance.
💊 Teva Pharmaceuticals—biosimilar potential and legal resolution set to unlock growth! #TEVA #Pharma 🚀📈

Revolve Group (RVLV) AnalysisCompany Overview: Revolve Group, a leading online fashion retailer catering to younger customers, continues to stand out by leveraging AI for personalized shopping experiences and maintaining premium pricing strategies. The company’s ability to integrate technology into its operations provides a competitive advantage in the e-commerce fashion space.
Key Highlights:
Q2 Performance: Co-CEO Mike Karanikolas emphasized Revolve’s strong Q2 performance, driven by improved marketing and logistics. Notably, the company also achieved a reduction in return rates, marking the first decrease in over three years—a significant accomplishment for an online retailer.
Customer Growth: Revolve's active customers increased by 9% year-over-year, with total orders rising by 3%. This demonstrates strong customer engagement and brand loyalty, vital metrics for sustained growth.
Competitive Edge: Revolve’s ability to balance personalized offerings with premium pricing, supported by AI, enhances its appeal to fashion-conscious consumers and bolsters its market positioning.
Investment Outlook: Bullish Outlook: We are bullish on NYSE:RVLV if it holds above the $20.00-$21.00 range. Upside Potential: The upside target for Revolve Group is set at $33.00-$34.00, driven by strong customer engagement, effective cost management, and the company's innovative use of AI.
👗 Revolve Group—leading fashion e-commerce with AI innovation and strong customer growth! #RVLV #FashionTech 🚀📈

Sanofi (SNY): A Strong Investment CaseCompany Overview:
Sanofi NASDAQ:SNY is a major pharmaceutical company based in Paris, with a market capitalization of $134 billion.
Investment Highlights:
Dividend Yield: 3.8%, more than double the S&P 500 average.
Drug Portfolio: Diverse and includes successful drug developments.
Pipeline: Promising future drug pipeline with potential for growth.
Berkshire Hathaway Investment: Long-standing investment from Berkshire Hathaway underscores the company’s attractiveness and stability.
Outlook:
We are bullish on SNY due to its growth potential and solid dividend payout. The combination of a strong drug portfolio, promising pipeline, and robust dividend makes Sanofi a compelling investment choice.
#Sanofi #SNY #Pharmaceuticals #Investment #DividendYield #MarketCap #GrowthPotential #BerkshireHathaway #StockAnalysis #Bullish

Meta Platforms (META) AnalysisCompany Overview:
Meta Platforms, a leading player in the tech sector, continues to push boundaries with its advancements in artificial intelligence and virtual reality. Recent developments highlight the company’s commitment to growth and innovation, making it a compelling investment opportunity.
Key Highlights:
AI Advancements: NASDAQ:META recently launched its Llama 3.1 AI model, which is outperforming GPT-4o. This cutting-edge AI technology is designed to enhance applications across Meta’s platforms, including Facebook and Instagram. The model’s efficiency improvements are expected to drive higher engagement in Reels and attract more advertisers.
Enhanced User Engagement: The advancements in AI are set to boost user engagement on Meta’s platforms, particularly through more interactive and personalized content. This positions Meta to capitalize on advertising revenue and maintain its leadership in social media.
Dividend Introduction: Meta has introduced a quarterly dividend, appealing to dividend investors and reflecting the company’s financial stability and confidence in its ongoing growth.
Growth Prospects: The company’s focus on AI and VR, combined with its strong financial performance, supports robust growth prospects and market leadership.
Investment Outlook:
Bullish Outlook: We are bullish on META above the $450.00-$455.00 range.
Upside Potential: With an upside target of $690.00-$700.00, Meta Platforms presents a strong investment opportunity driven by its innovative AI advancements, increased user engagement, and attractive dividend yield.
🏅 Meta Platforms—leading the future with AI and innovation! #META #TechGrowth 🚀📈

Snowflake (SNOW): Potential Bullish Flip on the Horizon?In our last analysis on Snowflake, we were focused around the MOAT level, which was lost after the analysis. However, we respected the HVN edge low quite well, and since then, we haven't seen any significant new lows.
If Snowflake can hold its current level and avoid retesting lower zones, we could potentially see a flip in the market structure toward a bullish trend. If this scenario plays out, we’ll be actively looking for long setups for SNOW.
We'll keep you informed on whether this bullish scenario materializes or if lower prices prevail.

$DIS | Allocation | Market Exec |Technical Confluences:
- Price action has bounced off the Demand Zone and a Short-Term Trendline
- Price action seems to be strongly supported at these levels for now
- Few Interest Zones above the current price action and will need to see a proper break above that to go above the 100% Fibo Extension
Fundamental Confluences:
- Disney has a strong moat in the entertainment industry, driven by its vast portfolio of iconic brands, intellectual property (IP), and global reach.
- Earnings are recovering with growth potential in the their streaming services via Disney+ and further expansion of Disneyland parks in China
- FCF has not been good recently due to debt repayment, park expansions and streaming content investments which will target further revenue growth
- Development in it's streaming content and reinstatement of dividend announcements should be monitored
-----
Have allocated this into my portfolio previously and will be looking to hold this for the Long-Term at least to the 150% Fibo extension range.
-----

El Dorado Gold (EGO) AnalysisCompany Overview:
El Dorado Gold, a significant player in the gold mining sector, has shown strong performance in Q1 2023. The company's operations span various regions, with a strategic focus on optimizing production and controlling costs, which has led to impressive financial results and a rising stock price.
Key Highlights:
Production Surge: EGO reported a 21% increase in gold production during Q1 2023, a significant boost that reflects the company's operational efficiency and resource management.
Cost Management: The company successfully lowered its all-in sustaining costs (AISC) to $1,184 per ounce, enhancing profitability and providing a stronger buffer against potential market volatility in gold prices.
Strategic Deal: El Dorado Gold struck a deal with TRU Precious Metals, acquiring an 80% stake in the Golden Rose gold-copper project in Newfoundland, Canada. This acquisition positions EGO to further increase production and diversify its asset base, potentially driving long-term growth.
Stock Performance: The company's strong operational performance and strategic acquisitions have positively impacted its stock price, signaling investor confidence and optimism about its future prospects.
Investment Outlook:
Bullish Outlook: We are bullish on NYSE:EGO above the $14.50-$15.00 range.
Upside Potential: With an upside target of $21.00-$22.00, El Dorado Gold presents a solid investment opportunity, underpinned by strong production growth, effective cost management, and strategic expansion.
🏅 El Dorado Gold—striking gold and delivering value! #EGO #GoldMining 💰✨

Super Micro Computer (SMCI): Awaiting the Final Leg DownWe are considering a bullish scenario for SMCI, but it's not time to act just yet. We continue to believe that we are still in Wave (2) and that one more leg down is needed before we can see a surge higher, potentially breaching the all-time high at $1,229. Although the stock has already retraced more than 60% since reaching this ATH, we think there's still room for a bit more downside.
We believe we are in Wave C of the ABC corrective movement, and typically, this Wave C contains a five-wave structure (in this case, moving downward). This five-wave structure hasn't fully played out yet, as you can clearly see. Even though a lot of longs have been opened at $512, which is the 61.8% Fibonacci retracement level, we believe this is just Wave ((iii)). We're not looking to short this stock but are instead waiting to see if our analysis holds true so we can go long once we have more clarity on the ending of Wave ((iv)). This will help us better determine the end of the overarching Wave (2).
