How bad will it get? Let's talk about it!🌟 My Market Probabilities: 🌟
1⃣ 15% chance of a V-Shape recovery with a bottom at $410–$425
2⃣ 45% chance of a COVID-like Flash Crash resolving at
$385–$400
3⃣ 33% chance of a 2022-level bear market down to
$330–$350
4⃣ 5% chance of a 2008-level crash hitting $250–$260
5⃣ 2% chance of a crazy Dot.com-level crash dropping to $90–$110
💡 No matter which scenario unfolds, it’s a blessing in disguise! These dips create incredible opportunities to invest in great companies or indexes like the AMEX:SPY or NASDAQ:QQQ paving the way for massive, life-changing wealth over the years and decades to come.
🚀 Think long-term as an investor, friends, and stay focused on the bigger picture!
Stockcrash

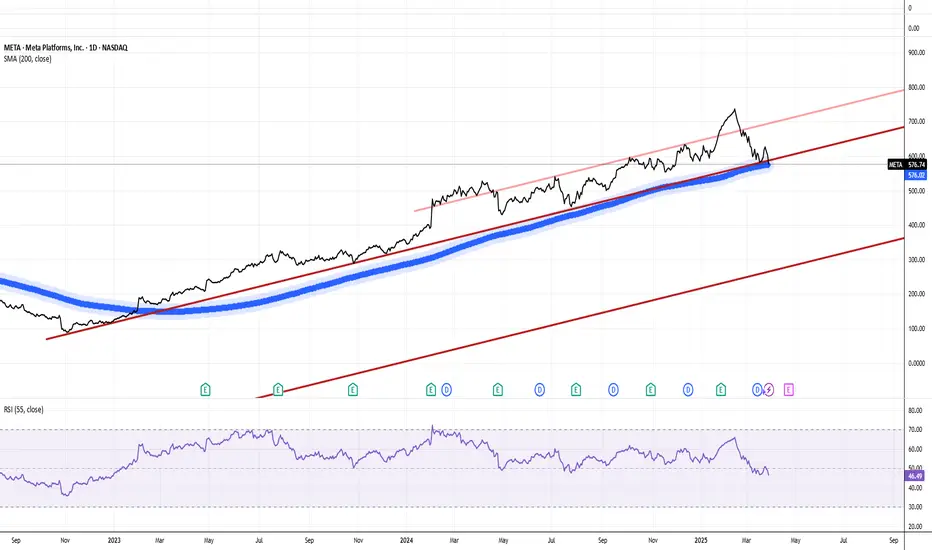
Meta Stock Goes 'Untoward', Fall Off The Cliff 200-Day SMAMeta's Descent into Bearish Territory. Understanding the 2025 Stock Crash
Meta Platforms has recently slipped into bearish territory, with its stock experiencing a significant downturn in early 2025. As of March 31, 2025, Meta shares trade at $576.74, reflecting more than 20.0% decline over the past month and erasing all year-to-date gains. This analysis examines the key factors driving Meta's bearish turn and what it means for investors.
Disappointing Financial Outlook and Investment Costs
Meta's stock decline comes despite previously strong performance, with the company's shares shedding 22% from their February 18, 2025 peak. Although Meta reported robust Q4 2024 profits, its outlook for Q1 2025 has significantly disappointed investors. The company's forward-looking EPS for Q1 2025 is projected at $5.25, raising sustainability concerns despite the previous quarter's EPS of $8.02 beating estimates.
A major contributor to investor anxiety is Meta's massive capital expenditure plans. The company has projected spending $60-$65 billion in 2025 on AI infrastructure alone, raising concerns about cash flow strain if revenue growth falters. These high fixed costs associated with AI investments, including data centers and engineering talent, create particular vulnerability during economic downturns.
Metaverse Losses Continue to Drain Resources
The company's Reality Labs division, responsible for virtual and augmented reality initiatives, continues to be a significant financial drag. This division lost $13.7 billion in 2022 alone with no clear path to profitability. Despite CEO Mark Zuckerberg's continued commitment to the metaverse vision, investor sentiment has soured on these costly experiments as they continue to consume capital without generating meaningful returns.
Broader Market Pressures and Industry Positioning
Meta's decline isn't occurring in isolation. It represents the last of the "Magnificent Seven" tech stocks to turn negative for the year, with the Bloomberg Magnificent 7 Total Return Index down 16% in 2025. The Nasdaq Composite has faced significant correction, declining 7.3% year-to-date and over 12% from its peak.
This market-wide pressure stems from persistent inflation concerns, Federal Reserve interest rate policies, and growing recession fears, creating a particularly challenging environment for growth-oriented technology stocks like Meta.
Influential Market Moves and Analyst Adjustments
Notable market participants have signaled caution regarding Meta's prospects. Cathie Wood's ARK Invest sold over $7 million in Meta stock (12,000 shares) on March 18, 2025—its first Meta sell-off in nearly a year. This high-profile divestment has further fueled bearish sentiment among investors.
Similarly, analysts have begun adjusting their outlook. KeyBanc Capital Markets recently downgraded its price target on Meta from $750 to $710, citing "greater macro uncertainty" and competitive pressures. This downgrade reflects growing concerns about Meta's ability to maintain growth momentum in the current economic climate.
External Challenges Mounting
Meta faces increasing competitive threats from platforms like TikTok and Snapchat, which continue to draw user attention and advertising dollars. Additionally, regulatory headwinds loom large, with an upcoming FTC trial on April 14, 2025, potentially forcing Meta to divest Instagram and WhatsApp—a prospect that has further spooked investors.
In conclusion, Meta stock now stands at a critical juncture, with investors carefully watching whether this represents a temporary correction or the beginning of a more prolonged bearish phase.
--
Best wishes,
Your Beloved @PandorraResearch Team 😎
6 INEVITABLE Stock Market DownturnsIn the world of stock trading, and crypto trading, volatility is as much a part of the landscape.
Whether you’re a day trader or a long-term investor you’re bound to undergo different degrees of stock market downturns, drops and crashes.
And each level of downturn has its own set of characteristics, challenges, and strategies for recovery.
Let’s dive into the nuances of market downturns, so you can navigate these stormy waters with confidence and savvy.
DOWNTURN #1: Down -2%: A Ripple of Volatility
Think of a -2% drop in the stock market as your morning coffee spilling over a bit—it’s unpleasant but hardly the end of the world.
This level of decline is typically seen as a blip of volatility, a common occurrence in the stock markets that often corrects itself in the short term.
DOWNTURN #2: Down -5%: The Pullback Perspective
When the market drops by 5%, it’s is often referred to as a pullback and, while it might cause a bit of concern.
However, if you look at the bigger time frame, you’ll see it might not signify a long-term trend.
DOWNTURN #3: Down -10%: Entering Correction Territory
A 10% drop is a clear signal that the market is in a correction phase.
This is where the uptrend will come to a temporary halt and the market will drop and correct itself.
You’ll see moving averages will cross down and the medium term trend will be showing downside.
You’ll also most likely look for shorts (sells) and take advantage of the correction.
DOWNTURN #4: Down -20%: The Bear Market Looms
Now we’re in the territory of the bear market.
This is generally characterized by a 20% or more drop.
It might be time to look into more defensive stocks or sectors, such as utilities or consumer staples, which tend to be less affected by economic downturns.
DOWNTURN #5: Down -50%: The Market Crash Crisis
A 50% plunge is the equivalent of a financial earthquake, causing widespread panic and uncertainty.
It’s quite rare, but when it happens, it’s all hands on deck.
We saw this in the financial crisis.
We saw this during the tech bubble.
We saw this with the oil crisis.
Silver Linings:
Even in the darkest times, opportunities can be found.
And whenever we’ve had a crash with world markets, they have turned up, made a come-back and moved to all time highs.
DOWNTURN #6: Prolonged downside: The Depression
This one I don’t have a number for you.
Unlike recessions, which are typically shorter and less severe, depressions are rare and can last for several years, causing long-term damage to a country’s economic health.
The most famous example is the Great Depression of the 1930s, which started with the stock market crash in 1929 and lasted for about a decade in most countries.
During this period, unemployment rates soared, reaching as high as 25% in the United States, while industrial production, prices, and incomes plummeted.
Conclusion:
Steady as She Goes
As I like to say.
It’s important to know that the downtrends, downturns and downside will come.
We need to be clued up and prepare for these situations.
That way we’ll take advantage as traders of what to do.
With the right approach, you can not only survive these downturns but emerge stronger and thrive profitably on the other side.

$NVDA - Majorly Bearish Macro StructureMy previous NVDA previous came in massively early. I think the stock made a 100% increase in value since the time of my original post, shown below. Despite this fact and the recent split, the overall macro formation of the chart has not changed. Although, I was earlier than I would have liked to have been, I fully believe the general sentiment and drastic nature of my prediction to be spot on.
NVDA has legs to climb up to $150-$200 possibly, but the tumble will be tremendous, over time. With 5 waves up, my fellow Elliotticians, we all know what follows.
Do I think NVDA is a crappy company? No.
Do I seriously think $2 will come? Yes

Apple -> Massive Breakdown And Now?Hello Traders and Investors ,
my name is Philip and today I will provide a free and educational multi-timeframe technical analysis of Apple 💪
Starting on the monthly timeframe you can see that after Apple broke out of the clear triangle formation in confluence with the bullish moving averages, Apple created a strong rally of 30% towards the upside, breaking major resistance.
As I mentioned over and over again the weekly timeframe looked quite overextended so I do expect even more short term bearish pressure before a reversal will be quite likely.
With Apple's gap down of -5% on Friday my last analysis, linked below, perfectly played out but there is no reason why Apple stock should reverse immediately so be careful and don't jump into longs too early.
Keep in mind: Don't get caught up in short term moves and always look at the long term picture; building wealth is a marathon and not a quick sprint📈
Thank you for watching and I will see you tomorrow!
My previous analysis of this asset:

A Year To Forget For Stock InvestorsAs we near the end of the year, it is clear that the stock market has experienced significant turmoil in 2022.
A total of 1,492 stocks have seen their value drop by 50% or more this year. This is a staggering number, and it indicates that many investors have been hit hard by the market's downturn.
Even more concerning is the fact that 665 stocks have fallen by 75% or more. This means that these stocks have lost a significant portion of their value, and investors who own them may be facing significant losses.
The situation is particularly dire for the 217 stocks that are down 90% or more. This is an incredibly large drop, and it indicates that these stocks are in serious trouble. It is likely that many investors who own these stocks will be forced to take significant losses, and it is possible that some of these companies may not be able to recover.
Overall, the stock market has been volatile this year, and many investors have been hit hard by the downturn. While it is never easy to see your investments lose value, it is important to remember that the stock market is cyclical, and there will be opportunities to recover in the future. In the meantime, it is important to stay focused and to make thoughtful decisions about your investments.
So what will 2023 have in store for us?

Not In The Clear Just Yet... 🚨👀Taking a look at possibly the 3 most important charts for any trader; VIX, SPX, and USD 🔮
With a massive rebound in equities, crypto, risk assets, we're seeing much chatter that "the bottom is in".
Although we've made some nice trades in this week's pump, we don't think we're in the clear just yet.🥶
You don't have to look too far either.
Looking at the VIX 1W chart. We can see we are approaching a sure-fire support level with a rebound all but guaranteed if you're just looking at the chart.
Line this up with the SPX 1W chart, and you'll see we're approaching significant resistance at the same time.
Combine these two with a bullish trending US dollar, and you have the perfect recipe for another leg down.📉
Now we can certainly push up further. We would almost expect it.
However, to say the "bottom is in" would be naive.
As always, we'll continue to look for intraday setups, but mid to long term we remain bearish.
Stay safe and happy trading!
-TucciNomics
Chief Overlord, AlgoBuddy

Potential Scenario for TSLAIf TSLA can't hold this support, we can see a further drop to 540 Levels.

1929 Crash Fractal in the DJIA ?In one of my previous posts I was trying to see if we would get a 1987 plunge in the markets. This did not happen, but we did get a fairly standard decline and market correction.
The question now is, will the mini bear down move be over and off to new highs? Or do we have something much more sinister in store for us as far as the DJIA.
Google gets some blowout earnings and the mood seems to be improving on the recent snap back rally.
But now we are faced with a key question as far as the DJIA goes. The DJIA will soon hit the bear down trend line.
Not only that but the decline in the DJIA in terms of form, looks similar to the form of the beginning of the 1929 style CRASH. The time symmetry is lacking, but here is what is similar:
A. The 1929 final rally was a fib .618 retracement that got STOPPED right under the bear down trend line, then after that was the 45% plunge
B. The number on the current DJIA pricing for a .618 retracement is 35,500. WATCH that number very closely in the DJIA to see how it reacts to it and does it get STOPPED there.
During the fierce rallies in the market it always seems like the bear scenarios die quickly. And that may actually be the case. In fact the market could bust up through the downtrendline sometime next week and blast higher. So the key will be to watch the price action very carefully for STALLING.
If I see enough stalling then I may go heavily short at what may be a critical FINAL high in the market.
The backdrop is still murky. We have rates rising. The TLT bond etf looks like it will soon CRASH down which means rates crash UP. The size of the bond market is orders of magnitude larger than the stock market. And if I recall correctly what really tanked the USA in 1929 was that the bond market collapsed and that took the stock market down with it.
The MARCH 14th,15th this year is a very important date for a couple reasons.
First it is the next fed meeting and the one where rates are supposed to go up. It is also a key cycle date from a man named Armstrong. So both from a rate inflection point date (fed meeting) and a cycle point, it is a forward looking event and we have to wonder if it could be a magnet date to go down into.
Obviously it will not be a date for the market to go down into if we see the market break north above the down trend line.
Note also the position of RSI and MACD.
RSI is near 50 zone. In 1929 the market got STOPPED at the 50 zone before the 45% plunge.
We are at 50 now, so it would seem that level should hold the market if it is to remain bearish.
The MACD in the current DJIA is about to cross upside bullish. That same situation occurred in 1929 but AT PRECISELY OF WITHIN A FEW DAYS OF THE FINAL PEAKING IN PRICE BEFORE A 45% CRASH.
So my point is we could right now be very close to a peaking point in the DJIA. INTRADAY of course you can see big up and down. But it is the CLOSING Price that matters the most over the next 5 days.
Will this scenario fail like most of the crash scenarios do? or will it be different this time ???
One final note... the drums of war seem to be beating louder.... that is a potential black swan that could rapidly change market sentiment, possibly severely.

Effects of Stimulus on Stock MarketHere is a quick chart that illustrates the effects of stimulus on the stock market. The influence that QE had on the market is painfully obvious. Will it be equally painful on the way down?

$PYPL PayPal under heavy fire, where is the bottom??Paypal got destroyed over the last couple of months, after it made it's double top on July 26th.
It has lost 35% of its value since then.
Paypal gapped below the support at around 222ish$ today and that triggered even more selling, since that support held for almost a year now.
The next area, where i see heavy support is at around 184-190$
I feel like that support must really hold, if we for example would gap below that support too and keep selling off,
there is a gap that would be closed at 130$.
Overall, the $PYPL chart really got some technical damage done to it, and it will need some hard work of the bulls to repair that damage.
We ripped a big down gap today, so i expect somewhat of a recovery rallye, also to work off that oversold RSI, but i would not be surprised, if we see another leg down in the $PYPL chart afterwards, since there's alot of fear in this stock now, and holders might use a recovery rallye to rebalance $PYPL in their portfolios.
Definetly not the stock, that would blindly go long on now, just because it got sold off, there's potentially a lot more selling to come in $PYPL

Shiller Cape Ratio Might Be Saying We Are About To Crash Soon...These things mean revert big time and goes to undervalue before it goes up again. I believe the markets are about to crash might time and this time it can be much violent and faster.

[SPX] June Crash Map... Wheeeeeeeeee!This is what the data is saying, I'm just the messenger :).
Watch out for the dark red areas, will slip extra fast!

[TVIX] The Future Has Arrived.. SPX Falls Some, TVIX EXPLODES!I've been calling this for three weeks now and been holding most my TVIX since May 18th among other inverse plays.
Just made some revisions to my OG idea and cleaned up the lines a bit to try to dial in the up spike here.
Here's all your entry and exit price targets from May 26th:
All that holds the same today.
TVIX still much better risk/reward than VIX.
We already blew past most my entry targets straight to the 'Okay Value' range of $205-$280.
I will not be buying above $205 personally because 'Okay Value' doesn't fit my investment strategy. However for others it may.
Investing above $280 becomes increasingly more risky and should be approached with caution.
I reupped all my shorts yesterday ~15%, just in the nick of time! Will likely reup another 20% if it dips back under $200 but depends on a lot. I'm very comfortable with my 25-30% portfolio short position (PRIOR to the explosion today).
I'm holding till at least $400 as indicated in my OG idea.
Gonna take a quick victory lap and tag all my best TVIX Long ideas and SPX Short over the past few weeks :).
Probably best to let this one ripen a bit before you harvest! B)

ADT [TA] | The Big ShortBig short after earnings??
One more move down?
Short position entry: $5.34
Easy Loot TP: $4.88
Stretched TP: $4.26
Personal Options Play:
- ADT Buy Put Strike $5 | Exp. 8/21
- 3 contracts @ $60 each (if ADT pumps before the dump, these will be cheaper)
Do not trade this, you will lose money
DotcomJack
Join Easy Loot
Premium Signals
Free Signals
Active Community

[TVIX] In the Kill Zone... Steady... Steady... POP!I expanded the kill zone a bit here guys, nailing the swing up was always a bit overly optimistic :).
2nd bar today kissed the top horizontal support channel and held above the bottom diagonal support channel. Still right on track.
Fundamentals vs the Fed, lets see who wins.
The indicators are betting on fundamentals coming out on top.

[SPX x DIX/GEX 2Y] Looks Like a Giant Cresting Wave!Got a tip that led me here: squeezemetrics.com
Then had some fun playing with lines: ibb.co
I don't put too much weight in any given strategy, preferring to average them all against fundamentals but holy shit was I surprised when after diving in from scratch to map the empty chart, it actually turned into a terrifying, accelerating and rising wave that's looking like it's f*cking cresting and about to crash first week of June.
So wild!
I hope all the Bulls are having fun picking up the seashells from the receding ocean...

[SPX] Let the Drop Begin, 2100 x August... POC Weighing HeavyI can't lay off this damn SPX man.
Here's my drop map for June/July.
I'll think we'll touch 2100 before July end if not blow through it a bit, def by August end.
There's not enough momentum to keep this afloat much longer.

[SPX] Indicators Screaming SELL... Ignore at Your Own Peril!MACD looking to flip.
ADX looking to flip.
DPO very high.
RSI as VPT screaming sell.
RSI and RVI screaming sell.
SMAs weighing heavy on market and indicating a sell.
POC under price and signaling sell.
Really hard to make any kind of bull case from technicals here.
This is my last rundown on SPX before the creash probably (will start tomorrow and continue through mid-June).
I'll be busy riding the TVIX for the next two weeks :).

[TVIX] Indicators and Support Pointing toward BreakoutCheckout that upward support trend from May 12th low. That is particularly interesting given the nature of the TVIX to constantly fall lower.
Lookout for ADX crossing the DPO, better the divergence the stronger the trend.
Also lookout for RVI crossing and holding just above RSI, could be a leading indicator here of upward movement. Those indicators are really both primed signaling a pretty strong buy right now.
MACD still terrifying, it's clear something has to break. I'm betting that the news dropping 1st week of June with ensure that break is downward.
I'll be looking to expand my position Thursday and probably get my last bets in Friday before close. Maybe hold till weekend but unlikely we'll need to.
Prepare for the harvest!

[TVIX] Start of Massive Breakout... Profit from the CrashNothing to prove. Just callin it.
VPT as RSI rarely bounces back and forth above and below the dashed lines so many times so quickly. Something is definitely brewin!

[SPX 1W Trend Analysis] Oh Boy... This Looks Much Worse Was inspired by @cryptocarlsontrading who made a very compelling 1W short case here:
www.tradingview.com
Wanted to build on that with my own 1W breakdown.
As a swing trader sometimes I get caught too much in my 4h world and it can be very instructive to zoom out and see the bigger picture.
After doing this exercise, I'm even more convinced of the coming June crash.
Just look at those parallel trend channels compared to the support. We're definitely retesting 1W green support in June with some risk of breaking and holding under that for a few days (although given the consistency here I think there is more chance for a bounce off of it).
Points:
1. That MACD is horrifying. Most likely the histogram and MACD line won't even go high enough to retest channel resistance before shooting back down.
2. The price barely crossed the half way point of the current trend channel, expect it to fall back and stick at channel support a bit, won't retest channel resistance. Volume Profile will support it pretty well.
3. Very slippery Volume Profile slope once it holds below current channel, expect it to slide all the way down to bottom support of new channel (4th yellow line)
4. Once it breaks that expect it to test the green support before rebounding for good and growth can continue at a more normalized, properly priced trajectory.
5. RSI: New up channel is steeper than previous up channel, likely will stick to blue down channel here.
6. OBV: Seems like a decent sell signal trigger here once it breaks below trendline.
7. VPT as RSI: Very strong sell signal.
8. POC is below price, it is right at the price on the 4h, this is bearish as well.

[SPX] SMA Trend Analysis - Beautiful 10 & 200 & POC ConvergenceAlrighty, long term I'm looking to build some kind of SMA trend and volume analysis model that could provide useful signals based on the angle of the trend lines and the POC and this is the start.
Like if you wish to support my work!
10 & 50 moving in parallel about ~7 degrees below the 200.
100 moving ~15 degrees below the 200.
POC is converging beautifully right with the 10 and 200 strongly signaling something is reaching a breaking point either up or down.
All fundamentals and technicals pointing to down. All hopes and dreams and FOMO pointing to up.
The market cannot be equal in value today as in January 2019. That is fundamental insanity.
So this will almost certainly be a breaking point downward.
Anyway, I digress!
Let's note here that the...
200 is trending 12 degrees below the POC
100 - 23 below
50 - 16 below
10 - 16 below
Lets call the average of these four Market Gravity POC. That gives out a Downward Gravity of 16.75.
Here's my first shot at reading the tea leaves:
I would say the 100 moving at such a steep degree against the 200 and twice the degree of the 10 and 50 is an extremely bearish short term signal. And the tandem trend of the 10 and 50 as bearish as well.
The fact that the Market Gravity POC runs below the 10, 50 and 200 is also a very bearish signal.
I would say the case is made AT LEAST for the market retesting March lows if not a medium to high degree of downside potential beyond that.
Where you at?
