SPY (Stocks) Should See a Nice Bounce This WeekTraders,
As mentioned in several of my previous posts and last video, SPY has now reached its downside target. This level at 410 provides strong support and correlates with our level of support on the RSI. I expect this week to be an up week for the S&P 500 and the stock market in general.
Best,
Stew
Stockmarketanalysis

Boeing Company: The Underpressured PathBoeing results topped analyst expectations Wednesday thanks to a pickup in commercial aircraft deliveries as the manufacturer increases production, but losses in its defense and space businesses drove the manufacturer into the red for the quarter.
The company generated $2.6 billion of free cash flow in the second quarter, ahead of analyst forecasts, and reiterated its full-year guidance of between $3 billion and $5 billion of free cash flow.
Boeing shares surged 12.70% just in a week, and closed on Friday at $238.69, the stock’s highest closing price since November 2021.
Here’s how the company performed during the period ended June 30, compared with Refinitiv consensus estimates:
👉 Adjusted loss per share: 82 cents vs. 88 cents.
👉 Revenue: $19.75 billion vs. $18.45 billion
👉 Boeing and main rival Airbus have both struggled to increase aircraft production in the wake of the Covid pandemic as some airlines face longer waits for new jets, just as travel demand rebounds.
The company delivered 136 planes in the second quarter, up from 121 aircraft during the same period last year.
Meanwhile just a take a look what historically happened with Boeing stocks, almost every time after 10+ percent weekly advance. In simple words - that's been a flat, or even more than 10 percent decline.
Technical picture indicates that Bearish trend still is in power in NYSE:BA stocks, and 5yrs SMA is still a huge resistance.

Nasdaq Bank Index: Putting A Bad Hair Day Into PerspectiveElon Musk still sees danger ahead for the US economy if the Fed does not contain the regional banking crisis.
Financial blog Zero Hedge previously tweeted about the critical role of small and medium-sized banks in the US financial system — a hot topic following the sharp collapse this month of Silicon Valley Bank, a technology startup lender and the first bank to be taken over by regulators since the 2008 financial crisis.
Small and medium banks account for 50% of commercial and industrial lending and 60% of residential real estate lending, among other loans, notes Zero Hedge with accompanying charts.
“If the Fed does not contain the collapse of regional banks, there will be another Great Depression,” it wrote, referring to the economic crisis that lasted from 1929 to 1939.
"This is a serious risk," Musk replied to Zero Hedge.
According to the US Department of Labor, in 1933, at the height of the Great Depression, approximately 25% of the 12.8 million people in the US labor force were unemployed.
This wasn't the first time Musk had intervened on his social media about the collapse of the SVB. Last week, he compared the bank failure to the Wall Street crash of the 1920s that preceded the Great Depression.
"There are a lot of similarities this year with 1929," Tesla CEO said in response to a post from Ark Invest' Cathy Wood.
Nasdaq Bank Index BSE:BANK includes securities of companies listed on the NASDAQ that are classified under the industry classification benchmark as banks.
These include banks that provide a wide range of financial services, including retail banking, loans and money transfers.
On February 5, 1971, the underlying NASDAQ Bank Index was 100 points.

Can start a trendThere are good chances from current level multiply can start a new trend to the upside, if geopolitical scenarios are settled this stock can rally very quickly specially after disclosing there positive financial results this stock didn't perform due to the same reason but with todays closing we are getting some sort of indication that buyers are again getting activated.
Although this can be a short recovery, i am expecting it to go a bit higher from current level and then come down from a small correction to start a fresh trend to the upside.
Hit like & follow guys ;)

BULLISH ENGULFING IN HCLTECHBullish engulfing with volumes in DailyTF
Formed at Breakout Retest Zone.
Trade Execution and Target on Chart
Idea Invalid below 1230

Tesla Just Had Its Worst 4Mo Red Combo. Nightmare, or a Chance?!Tesla's stock just had its worst week of 2023, plunging 16% on Elon Musk's earnings-call nightmare.
Tesla NASDAQ:TSLA shares plunged 16% over the five-day stretch ending October 20, as disappointing third-quarter earnings and a disastrous call led by CEO Elon Musk sparked a sell-off.
The nightmarish week wiped nearly $130 million off the EV maker's total market capitalization. while Musk's own personal fortune declined by around $30 billion, according to the Bloomberg Billionaires Index .
The stock is still up appr. 80% year-to-date, but has given up some of its gains over the past few months with the early-2023 hype around AI fading and investors starting to fret about the impact of higher interest rates.
Last Wednesday, on Oct 18, 2023 Tesla reported quarterly earnings that fell well short of Wall Street's expectations. The company posted adjusted earnings-per-share of $0.66, missing the consensus estimate of $0.74, and also underperformed analysts' revenue forecasts.
Musk then said in a post-earnings call that Tesla had likely "dug own grave with the Cybertruck" due to enormous production challenges, and warned of several economic headwinds that could drag on demand.
Tesla just had its worst 4-months Red Combo since June 2023, while Tesla stocks price fading after that within four months in a row, from July till October (in this time).
Sure we can call this performance like a "mini-disaster", but still it's too early to say that world's richest man became a "little baby" who is "fully in tears".
Meanwhile strong and powerful technical analysis says that the carmaker's hellish string isn't a bad one, while buyout things right here to come.
Tesla stocks were doing well in June 2023, where bearish hugs and weekly SMA (52) were broken, so I have to say, there is almost no hellish right here, just a technical confirmation of reversal that has happened several months ago in 2023.
Tech graph below is a long-term view, with further updates on monthly/ quarterly basis.

RIOT - long positionHello my fellow traders. Price of RIOT seems to break out the resistance in pre market. I am waiting for a retest of red line to get in LONG position. I am looking for retrace and bounce from support. On smaller time frame I will watch for a wick below and long after bullish close.

Head & Shoulder breakdown in JSWSTEELJSW STEEL LTD
Key highlights: 💡⚡
✅On 1Hour Time Frame Stock Showing Breakdown of Head & Shoulder Pattern .
✅ Strong bearish Candlestick Form on this timeframe.
✅It can give movement up to the Breakdown target of 751-.
✅Can Go short in this stock by placing a stop loss above 781+.

Citizens Financial Group. Possible Upside on Q3'23 Earnings CallBond pressure...
Pushing' down on me,
Pressing' down on you,
No man ask for...
Technical graph says that possible upside with NYSE:CFG stocks could be possible, with projected/ targeted line at 52W SMA.
With 6.20% dividends yield, double-digit operating yield and P/B just at 0.6, NYSE:CFG securities can be considered as quite undervalued.
The protection level can be considered as multi months (6-, 12-months) low.

LALU.N0000Wait for a pullback around 16 to 18
Disclaimer: The information and analysis provided in this publication are for educational purposes only and should not be construed as financial advice or recommendations to buy, sell, or hold any securities. The author and TradingView are not responsible for any investment decisions made based on the content presented herein. Always consult a financial professional before making any investment decisions.

Ascending Triangle pattern breakout in GODREJCPGODREJ CONSUMER PRODUCTS LTD
Key highlights: 💡⚡
✅On 1Hour Time Frame Stock Showing Breakout of Ascending triangle Pattern.
✅Strong Bullish Candlestick Form on this timeframe.
✅It can give movement up to the Breakout target of 1012+.
✅Can Go Long in this stock by placing a stop loss below 979-.

The historic +40% pattern on AppleHello Traders and Investors,
My name is Philip and I am a German swing-trader with over 4 years of trading experience.
I only trade the higher timeframes, preferably the monthly chart, because this allows me to capitalize on the major market swings.
I view trading as a long term game over the next 20 years which will help me to build massive wealth - it is not a get rich quick scheme.
-------------------------------------------------------------------
Today I want to share with you my outlook on Apple:
Apple is in a massive uptrend and if you look at Apple's chart over the past 20 years, there is no doubt that this was a crazy chart history. We also always had breaks and retests of the previous highs which were followed by crazy pumps and I do expect the same thing to happen again.
-------------------------------------------------------------------
Most of the people always follow the quick money. But the quick money is never the big money.
They think that making 5% a month consistently is reasonable, which is one of the reasons why so many traders fail.
The only think which you can control is your risk, everything else is unknown.
Keep your long term vision!
ASIAN GRANITO INDIA | DOWN TREND BREAKOUT PATTERNDOWN TREND BREAKOUT STRATEGY
Entry Price - 80₹
SL - 30₹
Targets - 130,200,300,390+
In this channel, I share my expertise in trading strategies, technical analysis, and market trends to help you make informed decisions in your trading ventures.
Stay tuned for daily updates, in-depth market analyses, and real-time trading scenarios to witness firsthand how we transform from Zero to Hero in the trading world. My Only aim is to empower you with the knowledge and skills necessary to navigate the complexities of the financial markets successfully.
Disclaimer - All information on this page is for educational purposes only,
we are not SEBI Registered, Please consult a SEBI registered financial advisor for your financial matters before investing And taking any decision. We are not responsible for any profit/loss you made.
Request your support and engagement by liking and commenting & follow to provide encouragement
HAPPY TRADING 👍

GVK POWER & INFRA | BEST PENNY STOCK TO NOWEntry Price - 9₹
SL - 4.5₹
Targets - 20,27,40,53,90+
In this channel, I share my expertise in trading strategies, technical analysis, and market trends to help you make informed decisions in your trading ventures.
Stay tuned for daily updates, in-depth market analyses, and real-time trading scenarios to witness firsthand how we transform from Zero to Hero in the trading world. My Only aim is to empower you with the knowledge and skills necessary to navigate the complexities of the financial markets successfully.
Disclaimer - All information on this page is for educational purposes only,
we are not SEBI Registered, Please consult a SEBI registered financial advisor for your financial matters before investing And taking any decision. We are not responsible for any profit/loss you made.
Request your support and engagement by liking and commenting & follow to provide encouragement
HAPPY TRADING 👍

DXY I Still have the DXY in the expanded Flat with a top in at $107 which happens to be the fib retracement 50% level of the 5 down wave A.
I expect the momentum indicators to begin to slowly roll over. RSI, Stochastic RSI , OBV , MACD should all confirm the last leg of the down trend wave C which I expect to finish around $94.
At $94 the DXY should complete a very HTF wave 4 and then kick off what is shaping up to be one ugly recession. W5 targets for DXY run over $130 and I don't think much will survive this risk off trade set up.
This is likely what many analysts are referring to as the "Blow off Top" to which I find myself reluctantly agreeing with since all my charts keep leading me down this rabbit hole. ;)

Tesla (TSLA) -> 300% Is The GoalMy name is Philip, I am a German swing-trader with 4+ years of trading experience and I only trade stocks , crypto , options and indices 🖥️
I only focus on the higher timeframes because this allows me to massively capitalize on the major market swings and cycles without getting caught up in the short term noise.
This is how you build real long term wealth!
In today's anaylsis I want to take a look at the bigger picture on Tesla.
With the Covid19 Crash in March of 2020 Tesla stock perfectly entered a solid rising channel and and pumped more than 1000% towards the upside before retracing 70%.
Following this bullish trajectory I do expect another short term pullback to retest the $200 level before we could see a pump at least back to the previous all time high at $400.
- - - - - - - - - - - - - - - - - - - -
I know that this is a quite simple trading approach but over the past 4 years I've realized that simplicity and consistency are much more important than any trading strategy.
Keep the long term vision🫡

Tesla -> Will Hisory Repeat ItselfMy name is Philip, I am a German swing-trader with 4+ years of trading experience and I only focus on price action and market structure 🖥️
I am trading the higher timeframes because this allows me to massively capitalize on the major market swings and cycles without getting caught up in the short term noise.
This is how you build real long term wealth!
In today's anaylsis I want to take a look at the bigger picture on Tesla.
All the way back in 2020 Tesla stock broke out of a monthly triangle formation and pumped more than 1.500% towards the upside. You can see that at the moment Tesla stock is once again creating a monthly triangle formation and there might be another breakout coming soon.
- - - - - - - - - - - - - - - - - - - -
When the market moves where, and how, and if - these are all unknown.
The only thing which you can control is your risk.
- Philip Basic Trading -
Keep the long term vision🫡

WTI Crude Oil All Time Chart. Does History Repeat Itself..?!I'm writing this article, because of the striking resemblance with Today's oil and the one that has been a lot of times before..
I believe that history repeats itself, and there are lessons to be learned. And since this boom and bust cycle are not new, it might also provide some understanding on where we are heading.
I hope you enjoy.
The time of dinosaurs
In the 1850s the whale fisheries had failed to keep pace with the mounting need for illuminating oil, forcing the price of whale oil higher and making illumination costly for ordinary Americans. Only the affluent could afford to light their parlors every evening.
There were many other lighting options such as lard oil among others but no cheap illuminant that burned in a bright, clean, safe manner.
George Bissell, considered as the father of the American oil industry, had the intuition that oil that was plentiful in western Pennsylvania could be a first rate illuminant. The slimy liquid was so ubiquitous that it tainted well water and plagued local contractors drilling for salt.
In 1855, Professor Benjamin Silliman from Yale produced a report that vindicated Bissell's hunch that oil could be distilled to produce a fine illuminant (like kerosene), plus a host of other useful products. As a result, Bissel and his company, Seneca Oil Company (formerly the Pennsylvania Rock Oil Company) needed to dispatch someone to Pennsylvania to look for large pools of oil.
First oil drilled in America
That man was Colonel Edwin Drake, known as the first to successfully drill for oil. Drake arrived in Titusville, Oil Creek Valley. Oil was known to exist here, but there was no practical way to extract it. Its main use at that time had been as a medicine for both animals and humans. Natives used it for war paint and for soothing skin liniment. It took a couple years but Drake struck oil in 1859.
This was the beginning of a pandemonium. Bands of fortune seekers and speculators streamed into Titusville and other oil-related businesses quickly exploded on the scene.
I guess we can call this the Klondike of oil, as a beginning of Global Industrialization Era.
Mr. Rockefeller was known as the co-founder of the Standard Oil Company and was the world's richest person. Crude oil jumped multi X times in 1860s from approximately 50cents per barrel in early 1860s to over 3 dollars in late 1860s.
Additionally, I would like to note that crude oil fluctuated between $10 and 10¢ a barrel in 1860! Adjusted for inflation, Mr. Rockefeller fortune upon his death in 1937 stood at $336 billion according to Fortune (in 2008 U.S. dollars).
Similar how crypto enthusiasts built their wealth in 2010s, right? 😉
Pump and Dump
By the late 1860s, there was a slump in the oil industry, keeping it depressed for the next five years. Low kerosene prices, a boon to consumers, were catastrophic for refiners, who saw the profit margin between crude and refined oil prices shrink to a vanishing point.
Worse, the oil market wasn't correcting itself according to the self-regulating mechanism described by neoclassical economists. Producers and refiners didn't shut down operations in the expected numbers.
John D. Rockefeller said "So many wells were flowing that the price of oil kept falling, yet they went right on drilling." Rockefeller tirelessly mocked those "academic enthusiasts" and "sentimentalists" who expected business to conform to their tidy competitive models.
One Hundred Years of Resistance for $4
According to the standard model of competition, as oil prices fell below production costs, refiners and producers should have shutdown.
But the oil market didn't correct itself in this manner because refiners and producers carried heavy bank debt and other fixed costs and by operating at a loss they could still service some debt. Each refiner, pursuing his own self-interest, generated collective misery.
Does it sound like today's crypto news, right? 😉
The U.S. drilling activity didn't slow down after hot 1860s as much as expected and a lot of producers are still pumping oil to avoid defaulting on their loans..
There was World War I in 1914-18, and total number of military and civilian casualties was around 40 million - around 20 million deaths and 21 million wounded. 😓
There was World War II in 1939-45, and total number of military and civilian casualties estimated around 50 - 56 million.. 😓
Crude oil prices jumped again, and again. But still remained below $4 until 1970s, as there were no all time peaks in crude oil after super hot 1860s.
Money-printing Era Breaks the Rules
The gold standard was the basis for the international monetary system from the 1870s to the early 1920s, and from the late 1920s to 1932 as well as from 1944 until 1971 when the United States unilaterally terminated convertibility of the US dollar to gold, effectively ending the Bretton Woods system, that has been resulted with huge inflation all over the world within further decades..
Technical pictures at the main WTI crude oil chart illustrates, oil price are on the sustainable path since then, with huge bullish accelerations within local and global conflicts, like Arab-Israeli War in 1973, 9/11 attacks in 2001 and Russia-Ukraine conflict in 2022.
Nowadays
Knee-jerk surge’ happens again, and again, so oil experts repeatedly predict market impact of new 2023 Israel-Hamas conflict.
Crude oil price sees a spike on early Monday trading Oct 9, 2023 so the overall impact of the attack on Israel by Palestinian militants Hamas has yet to consider...
In a conclusion.. Does history repeat itself..
Certainly "Yes". As lessons of history still remain unlearned.

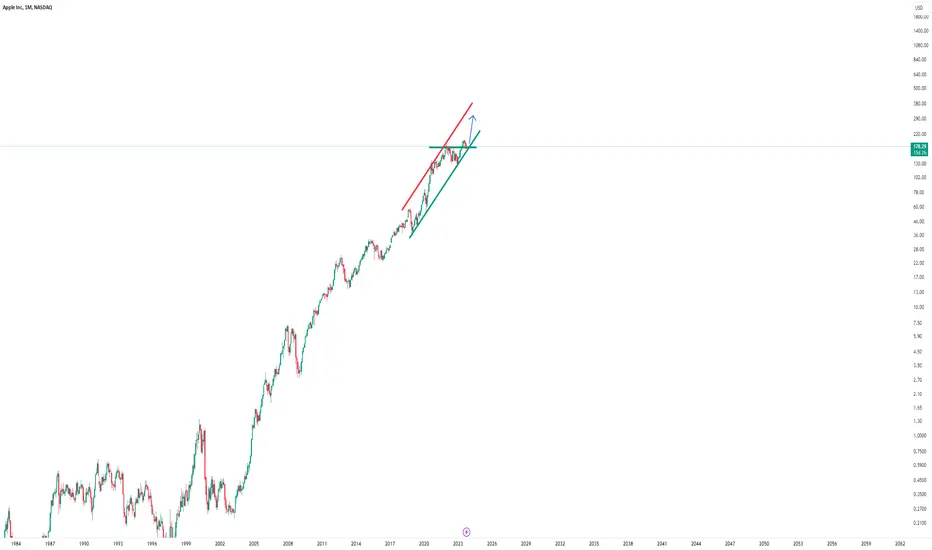
Apple -> Break And RetestMy name is Philip, I am a German swing-trader with 4+ years of trading experience and I only focus on price action and market structure 🖥️
I am trading the higher timeframes because this allows me to massively capitalize on the major market swings and cycles without getting caught up in the short term noise.
This is how you build real long term wealth!
In today's anaylsis I want to take a look at the bigger picture on Apple.
Looking at Apple stock you can see that Apple just perfectly broke above the previous all time high which was at the $175 level and is now retesting this previous structure so I simply do expect another push higher from here and the creation of a new all time high soon.
- - - - - - - - - - - - - - - - - - - -
I know that this is a quite simple trading approach but over the past 4 years I've realized that simplicity and consistency are much more important than any trading strategy.
Keep the long term vision🫡

Rising Wedge Reversal in AUROPHARMAAUROBINDO PHARMA LTD
Key highlights: 💡⚡
📊On 1Day Time Frame Stock Showing Reversal of Rising Wedge Pattern .
📊 It can give movement upto the Reversal target of Above 935+.
📊There have chances of Breakout of Resistance level too.
📊 After Breakout of Resistance level this stock can gives strong upside rally upto above 1070+.
📊 Can Go Long in this stock by placing stop loss below 840- or last swing Low.

What's a Tea! Fed Policy Expectations Plunge Gold to Key SupportGold declined marginally by 3% in September hitting its major support of 52 weeks SMA, in the face of higher long term Treasury yields TVC:TNX and a stronger Dollar index TVC:DXY .
Sentiment remained weak for most of the month as ETFs continued to lose AUM while COMEX managed money net long futures positions fell to a five month low previously in August 2023.
👉 Since July, long-dated yields have risen faster than short-dated yields, meaning the yield curve is exhibiting a "bear steepening", something often seen during a reflationary or early business cycle period.
👉 Following this thesis, lets compare 13-Weeks Treasury Bills Yield CBOE:IRX.P that jumped in 3 months from 5.150 to 5.330 only, and 10-Years Treasury Notes Yield TVC:US10Y with gains from 3.820 to 4.630 at the same time.
👉 While gold tends to underperform risk assets during these periods, it is not common to see bear steepening this late in the business cycle and recent moves in yields may be masking other factors at play, such as higher risk premiums
👉 Soft US economic data suggests also that a slowdown is still likely, which, alongside a potential change in the shape of the yield curve, could signal an environment where gold has historically performed well.
Yields take center stage
👉 August and September were challenging for gold. After dipping below US$1,900/oz, it staged a late recovery – around the Fed’s Jackson Hole annual symposium, than turned more down after Fed's September Meeting to finish September down approximately by 3 per cent.
👉 The US Treasury yield curve is arguably the most important financial indicator around, and its trajectory and shape are constantly under scrutiny. Most of the time (90%) it slopes upward as investors need to be compensated for lending their money for longer. But at these times, it inverts. As it has since July 2022, suggesting bond market participants are waiting Fed's monetary policy tightening continuation.
Lets Compare
Gold Spot in U.S. Dollars (RHS) vs. 6-Months Fed's Policy Expectations based on Jun'24 30-Days Federal Funds Futures CBOT:ZQM2024 (LHS)
Gold Spot in U.S. Dollars (RHS) vs. 12-Months Fed's Policy Expectations based on Dec'24 30-Days Federal Funds Futures CBOT:ZQZ2024 (LHS)
What’s next
👉 In summary, the move in the 10-year yield can likely be attributed to three main factors. A shift up in the ‘higher interest rates for longer’ narrative, supply and demand forces and a rise in the risk premium.
👉 The latter factor might start to provide support to gold prices, if it continues to increase from its key support of 52W SMA.
👉 If we simply look at bear steepening, gold tends to underperform – with low single digit average returns. Historically, the most likely successor to a bear steepening is a bull flattening (approx. a third of the time). This is characterized by a fall in the long end of the curve relative to the short end, effectively an unwinding of the rising premia we’ve witnessed.
👉 This partly took place at the latter end of September with gold likely benefitting from such yield declines. Also, soft data continue to suggest that a slowdown is still firmly on the cards. This could result in either a bull steepening or a rare "bear-". Both phases have on average been gold friendly, yielding an annualized return of 15% – the highest of all the phases.
Gold Market Breath
👉 What is Market Breath overall?
👉 Market Breath is a Percentage of Index Components Trading Above their N-Period Moving Average.
👉 Traders can use this index to see what percentage of index components are trading above their N-period moving average, for example, above the 200-day moving average.
👉 A rise above 50% in the indicator indicates increased market strength, while like the index of new highs and lows, traders and investors often look for extreme values to find extreme overbought and oversold conditions in the broader market.
👉 Gold Market Breath Indicator INDEX:YATH (number of S&P/TSX Global Gold Index TSX:TTGD above 200-Day SMA) is at 2.43, that is one of the lowest multi year readings .
In conclusion, there are some reasonable considerations for further Gold spot purchases following the thesis that 52W SMA is a strong support for Gold in 2023, and further Fed's Policy expectations for upcoming 2024 are fully in the hands already.

LDEV.N0000Having a resistance on 200 Daily MA and support around 50 Daily MA.
Closely monitor two buy zones.
Disclaimer: The information and analysis provided in this publication are for educational purposes only and should not be construed as financial advice or recommendations to buy, sell, or hold any securities. The author and TradingView are not responsible for any investment decisions made based on the content presented herein. Always consult a financial professional before making any investment decisions.

GRAN.N0000There is a gap in above chart. There is a possibility that gap will be filled in near future.
Disclaimer: The information and analysis provided in this publication are for educational purposes only and should not be construed as financial advice or recommendations to buy, sell, or hold any securities. The author and TradingView are not responsible for any investment decisions made based on the content presented herein. Always consult a financial professional before making any investment decisions.
