Nasdaq - This starts the next +50% rally!Nasdaq - TVC:NDQ - might break out soon:
(click chart above to see the in depth analysis👆🏻)
Despite the quite harsh correction of about -25% which we saw in the beginning of 2025, the Nasdaq is clearly heading for new all time highs. It sounds almost incredible but if the Nasdaq breaks above the current confluence of resistance, a breakout rally of +50% will follow thereafter.
Levels to watch: $21.500, $33.000
Keep your long term vision!
Philip (BasicTrading)
Stockmarketanalysis

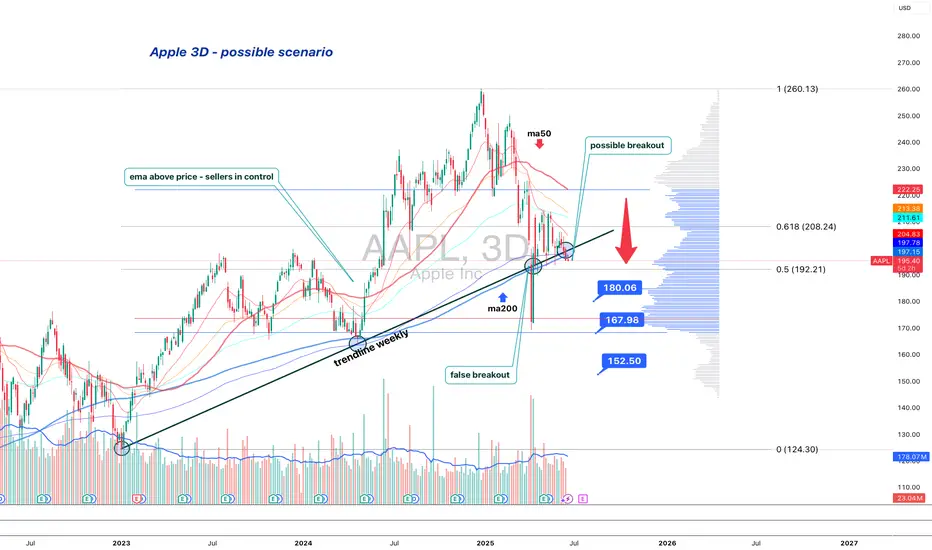
Apple is standing at the edgeApple (AAPL) is losing its long-term structure — second retest of the broken trendline suggests a bearish setup
On the 3D chart, Apple shows signs of structural breakdown. The weekly trendline from 2023 was broken and retested — twice. The price failed to regain it and now trades below, with candles showing weakness: low body closes, upper wicks, and no upside follow-through.
MA200 is now above price, and all EMAs are turning down. Volume Profile shows a heavy resistance block near $197. If the price remains below, sellers are in control.
Key levels:
— $192.20 = 0.5 Fibo support.
— Breakdown ➝ targets: $180 → $167 → $152.
Fundamentals:
Apple's recent reports show decelerating growth, weak China demand, and compressed margins. While AI buzz supports sentiment, institutional flow suggests distribution. BigTech may be topping out, and Apple is positioned for pullback.
Strategy:
Short below $196 with confirmation. Stop: $198. Targets: $180 / $167 / $152.
Failure to reclaim $192–197 = broken trend confirmed.
This is not a growth setup. This is where trends end — and profit-taking begins.
Meta Platforms - The rally is clearly not over!Meta Platforms - NASDAQ:META - can rally another +30%:
(click chart above to see the in depth analysis👆🏻)
Some people might say that it seem counterintuitive to predict another +30% rally on Meta Platforms while the stock has been rallying already about +750% over the past couple of months. But price action and market structure both tell us, that this will soon turn into reality.
Levels to watch: $850
Keep your long term vision!
Philip (BasicTrading)

Amd - This starts the next +200% rally!Amd - NASDAQ:AMD - is preparing a major rally:
(click chart above to see the in depth analysis👆🏻)
It has - once again - not been unexpected at all that we now see a major reversal rally on Amd. After the harsh drop of about -65%, Amd retested a significant confluence of support and already created bullish confirmation. It is quite likely that this now starts the next bullrun.
Levels to watch: $100, $300
Keep your long term vision!
Philip (BasicTrading)

Nvidia - The breakout will eventually follow!Nvidia - NASDAQ:NVDA - will break out soon:
(click chart above to see the in depth analysis👆🏻)
Over the course of the past couple of days, we saw a quite strong rally of +50% on Nvidia. Considering the market cap of this company, such a move is quite impressive. Following this overall very strong bullish momentum, an all time high breakout is quite likely to happen soon.
Levels to watch: $150
Keep your long term vision!
Philip (BasicTrading)

Rocket (RKLB) From Launch Innovator to Space Systems PowerhouseCompany Evolution:
Rocket Lab NASDAQ:RKLB is transforming into a vertically integrated space and defense systems company, leveraging its launch heritage to build long-term, diversified revenue streams.
Key Catalysts:
Rapid Launch Cadence 🛰️
3 Electron launches in 24 days demonstrate operational agility and scalability.
Meets rising demand for high-frequency satellite constellation deployments.
Strategic GEOST Acquisition 🛡️
$275M deal expands into electro-optical and infrared payloads, key for defense/ISR.
Boosts margin profile, backlog durability, and government contract appeal.
Validated Execution & Recurring Revenue 💼
100% mission success rate and multi-launch contract with Japan's iQPS reinforce credibility.
Positions RKLB for long-term cash flow stability and multiyear contract wins.
Investment Outlook:
📈 Bullish above $23.00–$24.00, backed by high reliability and strategic expansion.
🎯 Price Target: $42.00–$43.00, reflecting an expanding TAM, defense sector momentum, and vertically integrated execution.
🌠 RKLB is no longer just reaching orbit—it's building the infrastructure of space. #RKLB #SpaceStocks #DefenseGrowth

Microsoft - This might be the ultimate breakout!Microsoft - NASDAQ:MSFT - will break the all time high:
(click chart above to see the in depth analysis👆🏻)
If you wonder why Microsoft has been rallying +15% this month, market structure will give you an answer. In fact, the recent bullish break and retest was totally expected, and if we take into account the recent quite strong bullish behaviour, an all time high breakout will follow soon.
Levels to watch: $450
Keep your long term vision!
Philip (BasicTrading)

Nasdaq will reach 25'000 still no body see it?Current level: 21,876
Previous ATH: 22,222.61
Next stop? Well… if you ask the pivot levels they're whispering "23347.20, baby."
What we’re looking at is not just a strong recovery it’s a market that refuses to take a breather. With weekly candles forming higher lows and pivot zones behaving like polite suggestions rather than resistance, it’s hard not to think the index is gearing up for a proper breakout.
Sure, skeptics will say we’re overextended. Bears will point to the volume spikes and say “exhaustion.” But momentum? She's dancing in stilettos on top of R3 like it's a catwalk.
Now, here's the fun part:
If this rhythm keeps up and if inflation, rates, and the Fed behave like decent background characters then 25,000 by the end of the year isn’t just possible. It's that slightly overconfident friend at the party who's already halfway into a celebratory toast.
So… who dares to trust the trend?
Because let’s be honest: being early is painful, being late is expensive but being in the trend? That’s just good business.
📈 Trade safe, manage risk, and don’t fight the trend. Unless you're into that kind of thrill.
#tradehills #Pscarfo

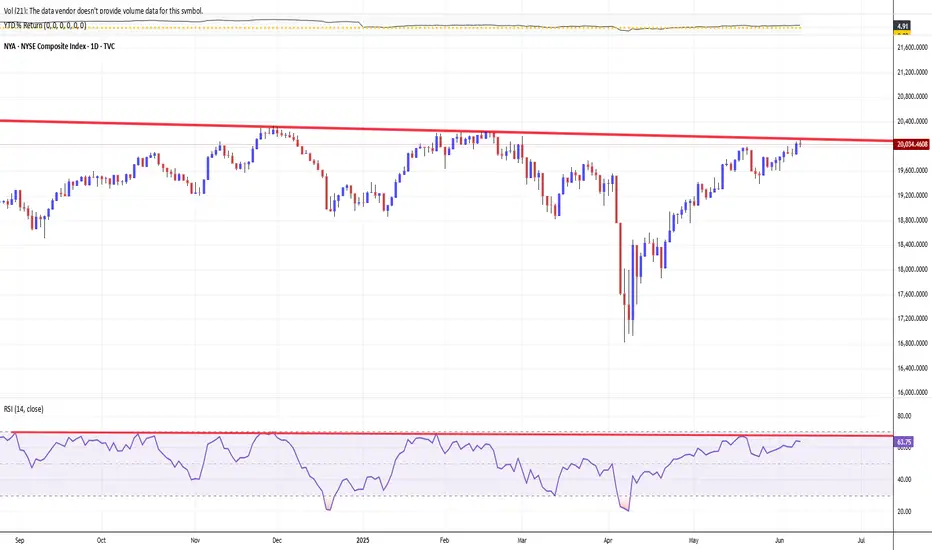
NYSE COMPOSITE INDEX. BACK TO 20 000 MARK — KEY RESISTANCE LINEThe NYSE Composite TVC:NYA is a stock market index, that covering all common stock listed on the New York Stock Exchange, including American depositary receipts, real estate investment trusts, tracking stocks, and foreign listings.
Over 2,000 stocks are covered in the index, of which over 1,600 are from United States corporations and over 360 are foreign listings.
However foreign companies are very prevalent among the largest companies in the index: of the 100 companies in the index having the largest market capitalization (and thus the largest impact on the index), more than half (55) are non-U.S. issues.
Thanks to many non-U.S. components, NYSE Composite index shows nearly 5 per cent return in 2025 so far, outperforms major U.S. stock indices like Dow Jones Industrial (+0.24%), S&P500 (+1.91%), as well as Nasdaq-100 (+3.21%).
Trade negotiations and tariff expectations have been central drivers of the NYSE Composite Index's recent recovery, shaping both market sentiment and underlying corporate fundamentals.
Trade Negotiations. Market Sensitivity and Relief Rallies
Financial markets, including the NYSE Composite, have reacted sharply to developments in trade negotiations. Historically, when trade talks break down or new tariffs are announced, U.S. stocks tend to sell off due to concerns over higher costs, supply chain disruptions, and reduced global demand. Conversely, when negotiations resume or tariffs are delayed, markets often rebound. For example, during the 2018–2019 U.S.–China trade war, U.S. stocks experienced heightened volatility, but rallied strongly after the announcement of the Phase I trade deal, as uncertainty eased and the threat of further escalation diminished. This pattern has repeated in 2025: the NYSE Composite has staged recoveries following signs of progress in trade talks or delays in tariff implementation, as investors anticipate less disruption to global commerce and corporate earnings.
Tariff Expectations. Impact on Earnings, Valuations, and Sentiment
Tariffs directly affect corporate earnings by raising input costs for companies that rely on imported goods. According to Goldman Sachs Research, every five-percentage-point increase in the U.S. tariff rate is estimated to reduce S&P 500 earnings per share by roughly 1-2%. If companies absorb these costs, profit margins are squeezed; if they pass them on to consumers, sales may decline. The NYSE Composite, which tracks a broad swath of U.S. and international companies, is similarly exposed.
Expectations around tariffs also influence equity valuations.
Elevated policy uncertainty—driven by unpredictable tariff announcements—raises the risk premium investors demand, often compressing price-to-earnings multiples and weighing on stock prices. When clarity emerges, such as the announcement of a tariff pause or the prospect of a negotiated settlement, uncertainty recedes, and valuations can recover, fueling index gains.
The Role of Policy Announcements and Market Psychology.
Trade policy announcements have acted as economic shocks, affecting global trade relationships and growth forecasts. For instance, after the U.S. announced new tariffs in early 2025, recession odds rose and GDP growth forecasts were slashed, prompting a broad market sell-off. However, the subsequent announcement of a 90-day tariff pause and renewed negotiations led to a stabilization and partial recovery in equities, as investors reassessed the likelihood of a severe downturn.
Market psychology amplifies these moves.
As trade rhetoric intensifies, investor sentiment can become excessively pessimistic, sometimes overshooting the actual economic impact of tariffs. This creates conditions for relief rallies when negotiations show progress or when the tariff outlook becomes less severe than feared.
Technical challenge
NYSE Composite index has experiencied record values on Friday, November 29, 2024, following so-called Trump-a-Rally.
The best Closing high was 20,272.04 ponts at those day and the best Intraday high was 20,332.50 points, also at the same day.
However unability to finish the year 2024 firmly above 20 000 round number, sharply pushed stock market bulls into fart and double-digit decline earlier in 2025.
The main chart indicates on major resistance again, near 20 000 point while technical indicator RSI (14) still goes sluggish.
Conclusion
The NYSE Composite Index's recovery has been closely tied to the ebb and flow of trade negotiations and tariff expectations. Positive developments in negotiations and reduced tariff threats have alleviated uncertainty, supported earnings expectations, and improved investor sentiment, all of which have contributed to the index's rebound.
--
Best wishes,
@PandorraResearch Team 😎
Tesla - There's more after the +60% rally!Tesla - NASDAQ:TSLA - will blow even further:
(click chart above to see the in depth analysis👆🏻)
It is almost incredible to see such a large cap stock rally more than +60% in less than two months. But Tesla is clearly the exception and therefore we should expect the unexpected. What's quite likely is at least another rally of about 25% from here and a retest of the previous all time high.
Levels to watch: $250, $400
Keep your long term vision!
Philip (BasicTrading)


Intel - This might be the bottom!Intel - NASDAQ:INTC - might create a bottom:
(click chart above to see the in depth analysis👆🏻)
For almost an entire year, Intel has been consolidating at a major horizontal support. Considering the previous significant bloodbath, Intel might soon find its bottom, which is inevitably followed by a major bullish reversal. After all, market structure is slowly shifting bullish.
Levels to watch: $20.0, $25.0
Keep your long term vision!
Philip (BasicTrading)

TESLA GOES READY FOR ITS NEW LEG DOWN. HERE'S WHAT WE KNOW ABOUTTesla stock declined after Elon Musk’s departure from the Trump administration due to a combination of reputational, operational, and market factors:
Political Backlash and Brand Damage. Musk’s close association with the Trump administration and his leadership of the Department of Government Efficiency (DOGE) generated widespread protests and alienated many of Tesla’s traditional, progressive customer base. This political controversy led to a decline in consumer interest and unsettled investors who were concerned about the brand’s long-term appeal.
Sales and Profit Declines. Tesla faced falling sales and profits, with deliveries dropping in key markets like China and Europe, partly due to intensifying competition and partly due to the backlash against Musk’s political activities. The company reported a 13% year-over-year decline in deliveries, and operating profits fell as well.
Investor Concerns Over Leadership Focus. Investors grew worried that Musk’s political involvement was distracting him from Tesla’s core business at a critical time. There was a perception that the company was losing its competitive edge and that Musk’s attention was divided, which amplified concerns about Tesla’s future growth.
Market Correction After “Trump Bump”. Tesla’s stock had surged after Trump’s election, buoyed by expectations of favorable policies. However, as Musk’s political involvement became a liability and operational challenges mounted, the post-election gains evaporated, and the stock corrected sharply downward.
In summary, Musk’s controversial political role, combined with operational headwinds and shifting investor sentiment, triggered a significant decline in Tesla’s stock after his exit from the Trump administration.
--
Best wishes
@PandorraResearch Team

Alibaba - This was just the obvious bottom!Alibaba - NYSE:BABA - will head much higher:
(click chart above to see the in depth analysis👆🏻)
Ever since Alibaba actually retested the previous all time low in 2022, we have been able to see the textbook creation of a rounding bottom formation. Even the recent break and retest was perfectly playing out and if Alibaba confirmes the potental breakout, a rally of +50% will most likely follow.
Levels to watch: $140, $220
Keep your long term vision!
Philip (BasicTrading)

Nvidia - The bullish consolidation flag!Nvidia - NASDAQ:NVDA - is still quite bullish:
(click chart above to see the in depth analysis👆🏻)
After Nvidia retested a major horizontal support just last month, we witnessed an extremely strong bullish reversal candle which resulted in a strong +50% rally. Considering the bullish flag consolidation, a breakout is much more likely, but not in the immediate future.
Levels to watch: $150
Keep your long term vision!
Philip (BasicTrading)

CHILE Stock Market Technical and Fundamental PerspectivesChile’s stock market is primarily represented by several key indices, each with distinct characteristics and coverage:
IGPA (Índice General de Precios de Acciones) BCS:SPCLXIGPA
The IGPA is the broadest and most representative index, covering the majority of stocks traded on the Santiago Stock Exchange. It is a capitalization-weighted index, revised annually, and includes companies across all major sectors of the Chilean economy. As of May 2025, the IGPA reached a historic high of over 42,000 points, reflecting robust market performance.
IPSA (Índice de Precios Selectivo de Acciones) BCS:SP_IPSA
The IPSA is a more focused index, comprising the 40 most heavily traded stocks on the Santiago Stock Exchange. It is revised quarterly and serves as the benchmark for large-cap Chilean equities.
S&P/CLX INTER Index 10 BCS:SPCLXIN10
This index tracks the 10 main Chilean stocks that also have American Depositary Receipts (ADRs) listed abroad, providing a bridge between local and international investors.
STOXX® Chile Total Market Index
This index aims to cover approximately 95% of Chile’s free-float market capitalization, with top components including major companies such as Falabella, Banco de Chile, LATAM Airlines Group, Cencosud, Banco Santander Chile, Empresas Copec, and Sociedad Química y Minera de Chile (SQM).
Key Components
The leading companies in Chile’s indices span various sectors:
Financials: Banco de Chile, Banco Santander Chile, Banco de Crédito e Inversiones
Retail: Falabella, Cencosud
Utilities/Energy: Enel Américas, Empresas Copec
Mining/Chemicals: Sociedad Química y Minera de Chile (SQM)
Forestry/Paper: Empresas CMPC
Airlines: LATAM Airlines Group
Long-Term Technical Perspective and Recent Trends
The Chilean stock market, as reflected by the IGPA and IPSA, has experienced a strong rally in 2025, with the major indices gaining over 25% year-to-date
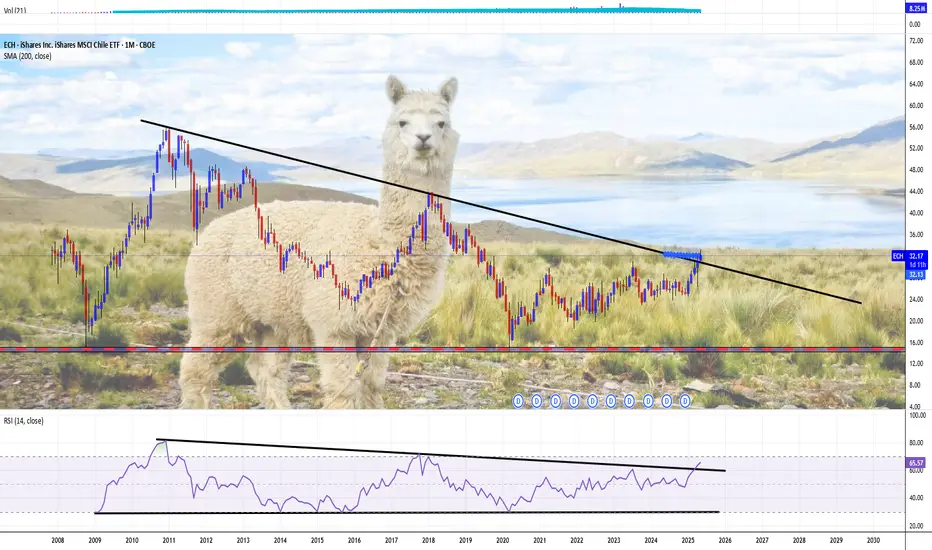
The MSCI Chile index currently presents a mixed technical picture. While long-term moving averages (200-day) signal a "buy," shorter-term indicators (5-100 day) are on "sell," and several oscillators (RSI, Stochastic, MACD) indicate oversold conditions or continued selling pressure.
This suggests that, despite the recent rally, some short-term consolidation or correction could occur, but the long-term trend remains constructive.
Fundamental breakdown
The Santiago Stock Exchange’s market capitalization stands at approximately $187 billion, with a price-to-earnings (P/E) ratio of 12.08, which is below both the emerging markets average (14.3) and the global average (22.12).
This relatively low valuation, even after a significant rally, suggests Chilean equities remain attractive on a fundamental basis.
The Chilean economy is projected to grow by 2.3% in 2025. Inflation has moderated to 4.5%, and the central bank’s benchmark interest rate is stable at 5%.
The banking sector is particularly robust, with Banco de Chile reporting a 14.2% year-over-year increase in net income for Q1 2025.
The mining sector, especially lithium, is poised for growth following major investments and Chile’s strategic push to regain global leadership in lithium production.
The combination of strong fundamentals, sectoral diversity, and attractive valuations positions Chile’s stock market for steady long-term growth, though short-term volatility is possible as global and local conditions evolve.
Conclusion
Chile’s stock market demonstrates strong long-term potential, underpinned by solid economic fundamentals, sectoral strengths, and attractive valuations, though investors should remain mindful of cyclical corrections and global market influences.
Thу main technical chart for CBOE:ECH - iShares MSCI Chile ETF (total return) points on massive 200-months SMA breakthrough, attempts to break long term 'descending top/ flat bottom' technical figure.
--
Best wishes,
@PandorraResearch Team 😎
Apple - Please look at this chart!Apple - NASDAQ:AAPL - is just wonderful:
(click chart above to see the in depth analysis👆🏻)
Last month, Apple created a quite strong bullish rejection wick of about +25%. It was actually no surprise at all, because market structure was perfectly pushing price higher. Following the bullish break and retest pattern, new all time highs will most likely follow.
Levels to watch: $200, $300
Keep your long term vision!
Philip (BasicTrading)

Get ready for a 20-25% price drop
The bearish scenario for the BIST 100 index remains valid. It seems that the next downward wave will begin after the formation of the contracting triangle.
Good luck
NEoWave Chart

Credo Technology Group (CRDO) – Powering the AI Data Center BoomCompany Snapshot:
Credo Technology NASDAQ:CRDO is a rising star in AI infrastructure, delivering high-speed, low-power connectivity solutions that are mission-critical to modern data centers.
Key Catalysts:
AI Infrastructure Tailwinds 🧠🏢
Direct exposure to Active Electrical Cables (AEC) and PCIe retimers
Positioned for rapid demand acceleration from AI, cloud, and hyperscale data centers
AEC chip market expected to grow 15x from $68M (2023) to $1B+ by 2028
Sticky Software + Hardware Model 🧩
PILOT software platform offers real-time diagnostics and performance tuning
Enables a recurring revenue model and strengthens customer retention
Scalable, Energy-Efficient Portfolio ⚡🌐
High-bandwidth, low-power design aligns with sustainability goals of large data centers
Integrated solutions are already seeing early adoption momentum
Investment Outlook:
✅ Bullish Above: $51.00–$52.00
🚀 Upside Target: $90.00–$92.00
📈 Growth Drivers: AI infrastructure demand, software expansion, chip market scale
💡 Credo isn’t just riding the AI wave—it’s building the rails for it. #CRDO #AIInfrastructure #Semiconductors

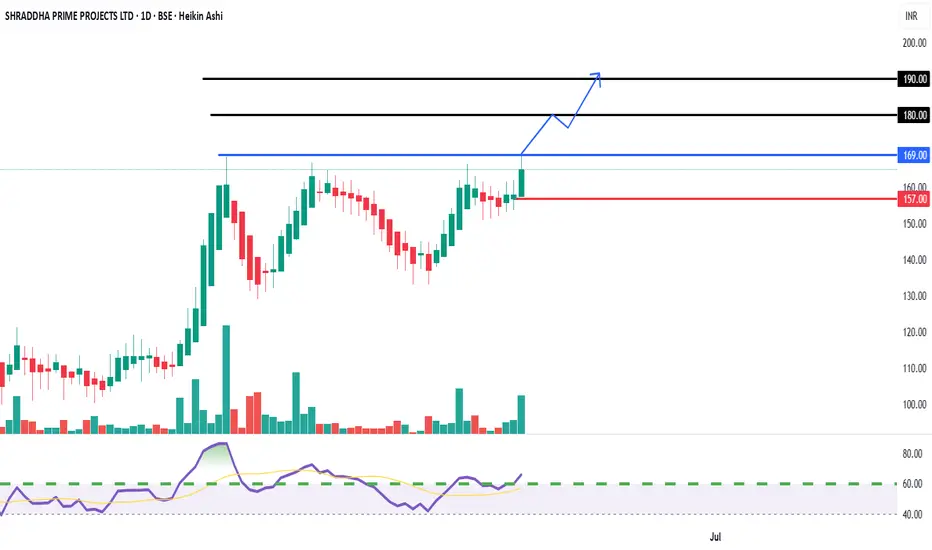
On the Cusp of a Breakout - Short-Term Buy OpportunityEntry Price:
Aggressive Entry: Around CMP (₹165.00) with a strict stop loss, anticipating the breakout.
Conservative Entry: On a confirmed breakout and close above ₹170 on a daily basis.
Target Price 1 (T1): ₹180
Target Price 2 (T2): ₹190
Stop Loss (SL): ₹157 (Closing basis below immediate support)
DISCLAIMER
This report is prepared for informational purposes only and is not intended as a solicitation or an offer to buy or sell any securities. The information contained herein is based on technical analysis and publicly available data, which are believed to be reliable, but no guarantee is made as to their accuracy or completeness. Investing in equities involves risks, and investors should conduct their own due diligence and consult with a financial advisor before making any investment decisions. Past performance is not indicative of future results.
PARQ.N00001. Current Trend and Price Action
Uptrend: The stock is in a strong bullish trend, with consistent higher highs and higher lows evident in the weekly chart.
Key Resistance Levels:
The stock is approaching a critical resistance zone between 36.7 (0.618 Fibonacci level) and 38.0 (0.65 Fib level). These levels could act as barriers unless strong buying momentum continues.
Support Levels:
Immediate support is at 32.5 (0.5 Fibonacci level). If the stock pulls back, this level should act as a strong support zone.
Additional support lies at 27.2 (0.382 Fib level) if further corrections occur.
2. Fibonacci Analysis
The 0.618 (Golden Pocket) zone at 36.7 is a critical level to watch. If the stock breaks above this zone, it may head toward the 0.786 Fib level (~43.4).
All-Time High Target: The 1.0 Fibonacci level at 52.0 represents the potential all-time high target if the uptrend continues.
3. Indicators
RSI (Relative Strength Index):
The RSI is currently at 76.89, indicating that the stock is in the overbought region. This suggests a potential for a short-term pullback or consolidation before continuing the upward momentum.
Volume and Momentum:
The recent candles show strong bullish momentum, supported by rising volume. However, caution is needed as the price approaches the resistance levels.
4. Observations
Bullish Case: If PARQ breaks above 38.0, the next target would likely be 43.4, followed by 52.0 as the long-term target.
Bearish Case: Failure to break the 36.7 - 38.0 resistance zone could result in a pullback toward 32.5 or even 27.2.

CHAMBLEFERT IDEAChamblfert looks like at a good demand zone. Expecting good one time bounce from this area and one green candle after long rail of back to back red candles.

Tesla - Don't get confused right here!Tesla - NASDAQ:TSLA - is about to create the bullish reversal:
(click chart above to see the in depth analysis👆🏻)
2025 has been a rough year for Tesla so far. With a drop of about -50%, Tesla is clearly breaking the average retail trader. But the underlying trend is still quite bullish and if position strategy, risk execution and mindset control are all mastered, Tesla is a quite rewarding stock.
Levels to watch: $275, $400
Keep your long term vision!
Philip (BasicTrading)
