SPY 30th Sep,2023 WEEKLYThis is my weekly analysis for SPY.I have clearly explained what price is willing to do and trust me there is no rush to push trades on yourself. Just wait for the right opportunity.
If you have any doubts feel free to shoot me a text.
NOTE: STAY AWAY IF YOU ARE NOT SURE ABOUT THE MARKET
Stockmarketanalysis

Price action analysis on the Major Indexes...its not pretty!!I will go through the daily charts for major Indexes as they come under pressure.
Review the price action and major levels of the DOW, Nasdaq, DAX, FTSE and ASX200.
** If you like the content then take a look at the profile to get more daily ideas and learning material **
** Comments and likes are greatly appreciated **

Is TSL Stock Worthy Beyond 2025? Let's Uncover That
Now, I know what you might be thinking. TSLA has been quite the rollercoaster ride, with its stock price soaring to astronomical heights and then experiencing some sharp declines. But let's not forget the incredible achievements and disruptive innovations that Tesla has brought to the table. From electric vehicles to renewable energy solutions, this company has been at the forefront of revolutionizing multiple industries.
Looking ahead, it's crucial to consider some key factors that could shape Tesla's future performance. The electric vehicle market is projected to witness substantial growth, driven by increasing environmental concerns and government regulations. Tesla, being a pioneer in this domain, is well-positioned to capitalize on this trend and maintain its market dominance.
Moreover, Tesla's ambitious plans to expand its production capacity, particularly in emerging markets like China, bode well for its long-term prospects. As the company continues to scale up, economies of scale could potentially lead to improved margins and profitability. Additionally, Tesla's investments in autonomous driving technology could open up new revenue streams and solidify its position as a leader in the automotive industry.
Now, let's talk about the call-to-action. As traders, it's essential to keep a close eye on the performance of our investments. I encourage you to consider holding onto TSL if it consistently outperforms the SPY ETF (S&P 500 Index). While past performance is not indicative of future results, this metric can serve as a valuable indicator of TSLA's strength relative to the broader market.
By closely monitoring TSLA's performance against the SPY ETF, we can make informed decisions about the stock's long-term potential. Remember, investing is all about calculated risks and staying ahead of the curve. If TSLA consistently outshines the broader market, it may be worth considering as a long-term holding in your portfolio.
In conclusion, the question of whether TSLA is a stock worthy of holding beyond 2025 is a topic that sparks curiosity and debate. While the future is uncertain, Tesla's innovative spirit, market position, and growth opportunities make it an intriguing candidate for long-term investors.
So, let's keep a watchful eye on TSLA's performance and evaluate its potential against the SPY ETF. If it continues to outperform, it might just be the time to consider holding onto Tesla and ride the waves of its future success.

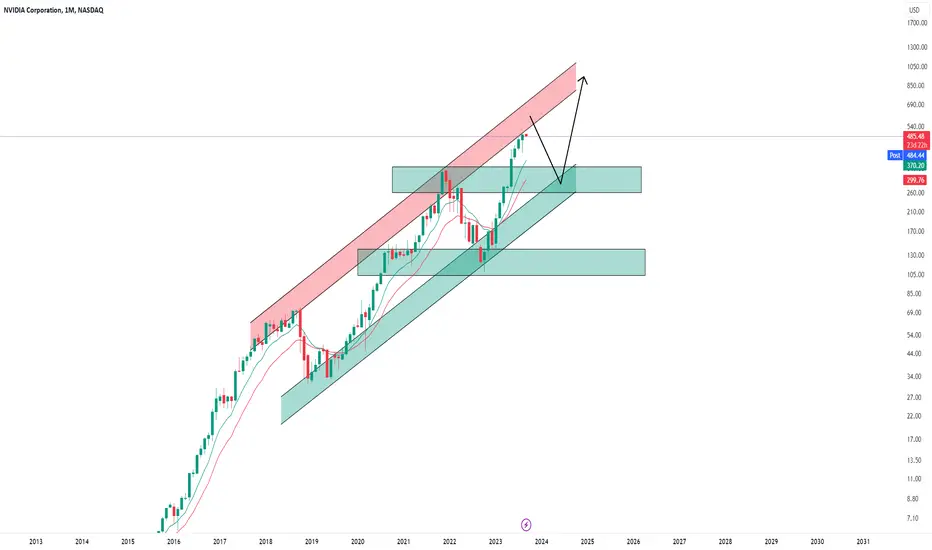
Nvidia (NVDA) -> Path Ahead Is ClearMy name is Philip, I am a German swing-trader with 4+ years of trading experience and I only trade stocks , crypto , options and indices 🖥️
I only focus on the higher timeframes because this allows me to massively capitalize on the major market swings and cycles without getting caught up in the short term noise.
This is how you build real long term wealth!
In today's anaylsis I want to take a look at the bigger picture on Nvidia.
After Nvidia - just a couple of months ago - perfectly retested the bottom support trendline of the rising channel at the $120 level Nvidia stock pumped more than 300% towards the upside.
We do have next resistance coming in at the $600 level and although Nvidia looks quite overextended, I do expect more bullish continuation to retest the upper channel trendline.
- - - - - - - - - - - - - - - - - - - -
I know that this is a quite simple trading approach but over the past 4 years I've realized that simplicity and consistency are much more important than any trading strategy.
Keep the long term vision🫡
DOCU PRICE ACTION 26th SEP,2023Here is the price action for DOCU as demanded by a lot of people. Make sure not to long here.

SPY LIVE 26Tth SEP,2023This is a break down of SPY so that we understand what market is trying to do.
NOTE:LEAVE THE MARKET ALONE

Navigating the S&P500 for different market scenarios ES, SPY, Multi-time frame analysis.
Welcome back to another market breakdown.
Today, I've got an exciting video for you as I dive into the current state of the S&P 500 and explore various strategies based on different market scenarios. Whether you're an experienced investor or just getting started, this video will help you better understand how to navigate the dynamic world of the stock market.
Trade safely,
Trader Leo

Booking (BKNG) -> Pay Very Close AttentionMy name is Philip, I am a German swing-trader with 4+ years of trading experience and I only trade stocks , crypto , options and indices 🖥️
I only focus on the higher timeframes because this allows me to massively capitalize on the major market swings and cycles without getting caught up in the short term noise.
This is how you build real long term wealth!
In today's anaylsis I want to take a look at the bigger picture on Booking Holdings.
Almost 10 years ago Booking Holdings stock entered a quite decent rising channel and is currently retesting the upper resistance from which I do expect a minor bearish rejection.
I would then look for longs at the $2400 structure zone or the $1900 rising channel support since the overall trend is still quite bullish and I do expect a bullish reversal there.
- - - - - - - - - - - - - - - - - - - -
I know that this is a quite simple trading approach but over the past 4 years I've realized that simplicity and consistency are much more important than any trading strategy.
Keep the long term vision🫡

KIOCL - Reached its Previous High with in 1&Half MonthThis NMDC strategy I'm already posted but its hidden due to some TradingView House Rules Violation Please Note this
Reached all My targets & also broken previous high (22 months Back high) 💥💹💰💸
Company Name - KIOCL
Price - 223.85
% Chg - -0.33
MCap(Cr) - 13,604.51
P/B - 6.80
ROE(%) - -4.87
1 Yr Perform(%) - 14.03
Net Profit(Rs.) - -97
Net Sales(Rs.) - 1,543
Debt to Equity - 0.21
In this channel, I share my expertise in trading strategies, technical analysis, and market trends to help you make informed decisions in your trading ventures.
Stay tuned for daily updates, in-depth market analyses, and real-time trading scenarios to witness firsthand how we transform from Zero to Hero in the trading world. My Only aim is to empower you with the knowledge and skills necessary to navigate the complexities of the financial markets successfully.
Disclaimer - All information on this page is for educational purposes only,
we are not SEBI Registered, Please consult a SEBI registered financial advisor for your financial matters before investing And taking any decision. We are not responsible for any profit/loss you made.
Request your support and engagement by liking and commenting & follow to provide encouragement
HAPPY TRADING 👍

SPY (Stocks) looks to continue uptrendTraders,
For the last year you have heard me preach this blow-off top. So far, we've nailed it. Today, the FED decided to continue the pause. No surprises here and it turned out to be a non-event in the market. The FED knows that they are "this close" to breaking everything. Macro-economically, we are on the brink of disaster both nationally and globally. Many people know this both logically and instinctively. Still the market will go against all odds and price stocks irrationally. This is happening. And my blow-off top is playing out perfectly!
The dollar has had 9 straight weeks of green candles. Time to take a rest.
The VIX hit a two year low this last week and remains suppressed.
Dollar down + VIX down = Markets UP!
Additionally, you can see from a technical perspective indicators that continue to support my blow-off top thesis:
Notice Elliot Wave. We are on the final wave now.
Notice that trendline (wave 5). We are still above that.
Notice Ichimoku cloud is green and beneath us.
Notice the 50 candle moving avg below us giving us support.
Notice the green area of support below us.
I am not telling any one of you that you are wrong if you believe we will eventually go down. I agree with you. But before that? BLOW-OFF TOP!
Best in all your trades,
Stew

SPY LIVE SEP19TH,2023Spy live analysis. This analysis in continuation to yesterdays analysis and for past 2 weeks. Just understand what price trying to do.
NOTE:DO NOT SHORT THE MARKET

Here's What Has to Happen Next Week to Show Us DirectionTraders,
Are we going up? Or are we going down? Sigh. This market is exhausting, I know. And once again we are on the brink of decision time for the U.S. market. The dollar is knocking on the door of overhead resistance, if it breaks then we can expect downward movement both in the U.S. stock market and in crypto. But if resistance holds firm, expect weakness in the U.S. dollar to show again. This will be priced into the market positively and you can expect more upward movement both in stocks and crypto.
In this video, I will briefly show you the main technical areas we need to continue monitoring next week.
Best,
Stew

Ascending Triangle pattern breakout in TCSTATA CONSULTANCY SERVICES LTD
Key highlights: 💡⚡
✅On 1Week Time Frame Stock Showing Breakout of Ascending triangle Pattern.
✅Strong Bullish Candlestick Form on this timeframe.
✅It can give movement up to the Breakout target of 4145+.
✅Can Go Long in this stock by placing a stop loss below 3350-.

Broadcom (AVGO) -> Stronger Than NvidiaMy name is Philip, I am a German swing-trader with 4+ years of trading experience and I only trade stocks , crypto , options and indices 🖥️
I only focus on the higher timeframes because this allows me to massively capitalize on the major market swings and cycles without getting caught up in the short term noise.
This is how you build real long term wealth!
In today's anaylsis I want to take a look at the bigger picture on Broadcom.
Over the past 12 months Broadcom stock rallied more than 120% towards the upside, following the major hype in the whole semiconductor and AI sector.
After this recent pump it is quite expected that we will see a short term correction and if Broadcom retests the previous all time high at $630, this will be a perfectly bullish setup.
- - - - - - - - - - - - - - - - - - - -
I know that this is a quite simple trading approach but over the past 4 years I've realized that simplicity and consistency are much more important than any trading strategy.
Keep the long term vision🫡

Intel (INTC) -> Don't Forget This StockMy name is Philip, I am a German swing-trader with 4+ years of trading experience and I only trade stocks , crypto , options and indices 🖥️
I only focus on the higher timeframes because this allows me to massively capitalize on the major market swings and cycles without getting caught up in the short term noise.
This is how you build real long term wealth!
In today's anaylsis I want to take a look at the bigger picture on Intel.
Looking back at January of 2023 - after a massive dump during 2022 - Intel stock perfectly retested and started to reject a major monthly structure level at the $27 level.
With the next clear resistance level being at $46 I am now expecting more upside on Intel stock before we could then see a short term rejection away from the $46 resistance area.
- - - - - - - - - - - - - - - - - - - -
I know that this is a quite simple trading approach but over the past 4 years I've realized that simplicity and consistency are much more important than any trading strategy.
Keep the long term vision🫡

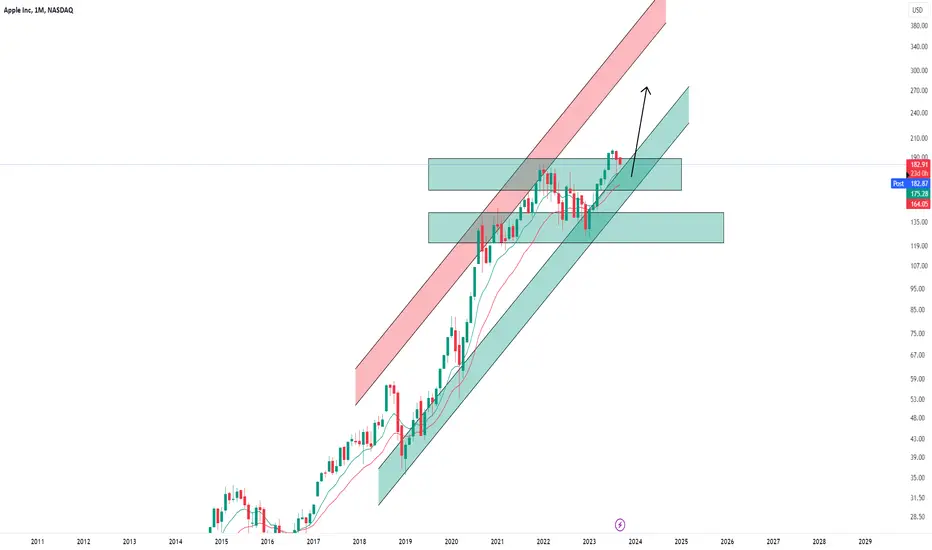
Apple (AAPL) -> The Company Of The FutureMy name is Philip, I am a German swing-trader with 4+ years of trading experience and I only trade stocks , crypto , options and indices 🖥️
I only focus on the higher timeframes because this allows me to massively capitalize on the major market swings and cycles without getting caught up in the short term noise.
This is how you build real long term wealth!
In today's anaylsis I want to take a look at the bigger picture on Apple.
Since the beginning of 2019 Apple stock has been trading in a solid rising channel and just recently rejected the support area at the $130 level.
Apple also perfectly broke above its previous all time high and is coming back for a retest after which I do expect another bullish rally to retest the channel resistance.
- - - - - - - - - - - - - - - - - - - -
I know that this is a quite simple trading approach but over the past 4 years I've realized that simplicity and consistency are much more important than any trading strategy.
Keep the long term vision🫡
Adani PortAdani Port CMP 825
Stock showing strength
Above 830 closing will show 860
Above 860 900 is also possible.
Can add for bullish view.

High Probability Swing Idea
=> Swing Idea: NSE: YATHARTH
=> Breakout Retest Trade.
=> Dry Volumes on Selling.
=> Coming to Demand Zone and Retest Zone.
=> High Probability Trade with Double Confluence of Price and Volume Action.
=> Change in Polarity could be Seen.
=> For Educational Purpose Only.
=> Trade at Your Own Risk.

DOW JONES - Streamlining My Long-Term View For Clarity..."As mentioned previously, I decided to take a hiatus from chart analysis to focus on personal growth. I'm committed to delivering high-quality insights and refuse to share subpar ideas just for the sake of it. Continuous improvement is my mantra, and stagnation isn't an option for me.
During this break, I've reevaluated my bearish stance to gain a fresh perspective. This shift in outlook has enabled me to grasp the potential bullish future of cryptocurrencies. Understanding the 'why' behind these possibilities has been crucial, and my chart-free period has been instrumental in achieving this clarity.

Tesla -> Wait For The 3rd Timeframe!Hello Traders and Investors ,
my name is Philip and today I will provide a free and educational multi-timeframe technical analysis of Tesla 💪
After Tesla stock broke out of the parallel channel all the way back in 2019 there was a super solid rally of more than 1500% towards the upside on this stock.
You can also see that Tesla just retested and started to reject previous weekly structure and in confluence with bullish moving averages we could see more continuation towards the upside.
Finally I am waiting for a daily shift back to a bullish market which will happen if Tesla breaks the current daily resistance level and then all 3 timeframes are pointing towards a move higher.
Keep in mind: Don't get caught up in short term moves and always look at the long term picture; building wealth is a marathon and not a quick sprint📈
Thank you for watching and I will see you tomorrow!
My previous analysis of this asset:

Time for Market RallyWith price bounding on the lower parallel of the Green pitchfork and with a new, fresh, Median Line (White) pointing up and intersecting with the Green Median Line, & Wave Strength is at lower extreme, I think the DOW is going to rally after its most recent beat down. The timing could be slightly off, but I think we will see a market rally over the next few days - weeks.
Late-Night Sunday post, sorry for the run on sentence lol.

Apple -> Now Getting Long!Hello Traders and Investors ,
my name is Philip and today I will provide a free and educational multi-timeframe technical analysis of Apple 💪
Starting on the monthly timeframe you can see that after Apple broke out of the clear triangle formation in confluence with the bullish moving averages, Apple created a strong rally of 30% towards the upside, breaking major resistance.
On the weekly timeframe you can see that Apple is already approching previous resistance which could be acting as support and considering that this level is the previous all time high I certianly do expect at least a short term bullish rejection.
However on the daily timeframe everything is still looking quite bearish - therefore I am waiting for a break and retest of the $183 daily structure level before the daily timeframe is also ready for more bullish upside.
Keep in mind: Don't get caught up in short term moves and always look at the long term picture; building wealth is a marathon and not a quick sprint📈
Thank you for watching and I will see you tomorrow!
My previous analysis of this asset:

Nvidia -> Earnings ObliterationHello Traders and Investors ,
my name is Philip and today I will provide a free and educational multi-timeframe technical analysis of Nvidia 💪
A couple of months ago Nvidia perfectly retested the lower support trendline of the major monthly rising channel and the next resistance towards the upside is roughly at the $800 level.
On the weekly timeframe you can see that Nvidia is not slowing down at all and with today's massive +10% after hour earnings gap Nvidia just created new all-time-highs.
Since the weekly and the monthly timeframe are both back to bullish now, I am simply waiting for a retest of the previous resistance at the $470 level which is then acting as strong support.
Keep in mind: Don't get caught up in short term moves and always look at the long term picture; building wealth is a marathon and not a quick sprint📈
Thank you for watching and I will see you tomorrow!
My previous analysis of this asset:
