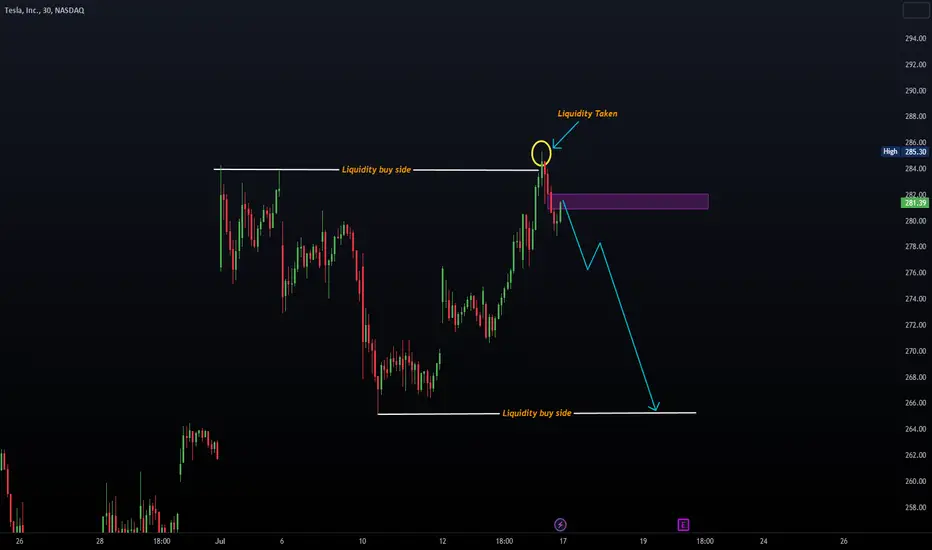
TSLA ANALYSIS After taken liquidity of the buy side and change of character we will see a increase of the price to fill this Gap
- Trading is probability control your risk management
Good Luck !
Stockmarketanalysis

Futures on BTC and S&P500: The ratio you should considerThe main chart is the ratio between Futures on BTC and S&P500
👉 Bitcoin CME Futures contracts are equal to 5 bitcoin, as defined by the CME CF Bitcoin Reference Rate (BRR)
👉 E-mini S&P500 Futures contracts are equal to 50 x S&P500 Index
Special remarks
😀 The Support Area and Resistance Areas are as highlighted on the chart.
😊 Since Bitcoin CME Futures were launched in Dec, 2017, S&P500 outperforms BTC to nowadays.
😁 Bitcoin has NO BALANCE SHEET, EARNGINS AND NEVER PAY DIVIDENDS

Wheat predictions: How winding up grain deal blows up the price The world is "not optimistic" that the grain-export corridor that has allowed it to ship more than 30 million tons of crops amid the Russia - Ukraine tensions will be extended beyond July, the country’s infrastructure minister said Wednesday.
The efficiency of the Black Sea corridor is faltering and crop volumes are declining. Even if prolonged, it won’t be as helpful in offloading the nearing 2023 harvests in its current state.
"We are doing our best in order to maintain this initiative", - Mr. Kubrakov (who signed the deal) said.
The deal — which was brokered by the United Nations and Turkey — has helped lower world food prices and maintain a sector that is vital for Ukraine’s economy.
It is next up for renewal on July 17, nearby July, 2023 CBOT:ZWN2023 Wheat Futures contract expiration.
Russian President Vladimir Putin already signaled that his nation may quit the pact, though the UN has urged all parties to press on.
There are no prerequisites for extending the grain deal, Mr. Peskov, press secretary of the Russian President said on June 21.
The deal has recently been plagued by a persistent slowdown in ship inspections, and Russia’s refusal to approve vessels headed to one of the three ports it covers.
Some 1.3 million tons of crops were shipped via the corridor in May, less than a third of the peak in October, UN figures show.
The technical picture indicates, Wheat Futures contracts are heading up for the 5th consecutive weeks in a row, second time since Q1 2022, last time due to widely known tensions between Russia and Ukraine.
With almost 30 percent gain from 2023 low near 575 cents per bushel, the price breaking up 1/2-year simple moving average, with further upside opportunities, up to 800 cents per bushel.

Pidilite - Cup & Handle Formation
PIDILITE IND LTD (JULY23 - CMP RS 2662.80)
Cup Pattern
#Phase1 - saw a sharp down move from Dec22 to Jan23
#Phase2 - Formed a slow base between Jan23 to Apr23
#Phase3 - From May23 - Jun23 it steadily moved up
When you add up the 3 phases - the Cup Pattern is visible in the Price Action.
Handle Pattern
#Phase4 - Between Jun23 and Jul23 the Price of Pidilite underwent the next small phase of correction
Phase#5 the Stock price saw a gradual upmove.
When you look at the full move of #Phase4 and #Phase5 - it resembles the Handle of the Cup
The Cup & Handle is a bullish continuation pattern which means that it is usually indicative of a future increase in price once the pattern is complete. Willing Buyers take exposure after the formation of the Handle is complete and push the Price upwards.
If the Pattern is successful, the Price can be expected to rally towards the life time highs of Rs 2918.95 implying a potential 9.6% up-move from the CMP of Rs 2662.80 as on July 21, 2023. The Price appreciation could play out over the next 3-4 months.


Dow Jones Possible Reversal & Recession in 2023looking for a strong rebound above 27.000
bullish target : 36.000+
possible deep recession in 2023.
trade with care.

TKYO.N0000Wait for pullback to 50-52
Disclaimer: The information and analysis provided in this publication are for educational purposes only and should not be construed as financial advice or recommendations to buy, sell, or hold any securities. The author and TradingView are not responsible for any investment decisions made based on the content presented herein. Always consult a financial professional before making any investment decisions.

KCAB.N0000Strong resistance at 355.
Disclaimer: The information and analysis provided in this publication are for educational purposes only and should not be construed as financial advice or recommendations to buy, sell, or hold any securities. The author and TradingView are not responsible for any investment decisions made based on the content presented herein. Always consult a financial professional before making any investment decisions.

🚀📈 Massive Profits: 20% Gains on $UPWK and 78% Surge on $SUNW📈🔥 Get ready to witness the power of falling wedge patterns as we share our latest triumphs! Our TradingView predictions were spot-on last month as we called out the breakout of the falling wedge pattern on NASDAQ:UPWK , resulting in a remarkable 20% gain. But that's not all! We also accurately identified and shared insights on the explosive NASDAQ:SUNW falling wedge breakout, which skyrocketed by an impressive 78%! Don't miss out on our exceptional TradingView ideas and analysis. Join us now to stay ahead of the game and unlock profitable opportunities in the market!
In this description, we highlight the success of the falling wedge patterns on NASDAQ:UPWK and NASDAQ:SUNW that were accurately called out on TradingView. We create a sense of excitement and urgency, encouraging viewers to check out our TradingView ideas for valuable insights and opportunities in the market.
#TradingViewAnalysis #TradingViewIdeas #FallingWedgePattern #StockMarket #ProfitableTrades #TechnicalAnalysis #StockTrading #TradingOpportunities #MarketInsights #TradingSuccess

Tesla -> The Strongest Stock Of AllHello Traders and Investors ,
my name is Philip and today I will provide a free and educational multi-timeframe technical analysis of Tesla💪
After Tesla stock retested the last strong support zone for bulls, the 0.786 fibonacci level at the $100 level, the recent pump over the past couple of months of more than 100% was no surprise at all.
On the weekly timeframe you can see that Tesla stock is still in an overall strong bullish market, there is resistance coming in at the $320 level but until then there is no reason why Tesla stock should start a correction.
Looking at the daily timeframe you can see that Tesla stock is once again creating a new swing high and there was no bearish rejection at the previous resistance at all - therefore I simply do expect another rally of 15% towards the upside to retest the weekly resistance at the $320 zone.
Keep in mind: Don't get caught up in short term moves and always look at the long term picture; building wealth is a marathon and not a quick sprint 📈
Thank you for watching and I will see you tomorrow!
My previous analysis of this asset:

APPLE to Continue HigherElliott Wave Count suggests we will be facing further downside as this looks like a three wave corrective move and the count suggests we have more left. The 200$ area could bring some resistance
Feel free to ask questions, trade safe!

HOPL.N0000Entry Point: 38 - 46
Profit Target: 60+
Stop-Loss: 35
Disclaimer: The information and analysis provided in this publication are for educational purposes only and should not be construed as financial advice or recommendations to buy, sell, or hold any securities. The author and TradingView are not responsible for any investment decisions made based on the content presented herein. Always consult a financial professional before making any investment decisions.

TESLA TRADEAtfer taken liquidity of buyside we will see a distrubution to wards sell side liquidity . FVG '' Fare Value Gap '' can be considered as an entry point .
PAYPAL HOLDINGS: A SRIRACHA SHORTAGEThis publication is a simple example of the Well-known Sriracha chart pattern.
Technical pictures in PayPal Holdings NASDAQ:PYPL indicates a strong support of major trendline.
PayPal is to Double the price 70->140 by this way .

AMD -> New Major Bullish CycleHello Traders and Investors ,
my name is Philip and today I will provide a free and educational multi-timeframe technical analysis of AMD 💪
As you can see on the monthly timeframe AMD stock perfectly retested the 0.618 fibonacci retracement level of the previous bullish cycle and already started a quite nice rejection.
On the weekly timeframe you can see that AMD retested the 50% fibonacci level and also filled the gap which was created a couple of weeks ago so everything is pointing towards more bullish growth.
Finally I am waiting for an entry signal on the daily timeframe - specifically AMD breaking above the current resistance at the $115 area and then I also do expect another daily push higher.
Keep in mind: Don't get caught up in short term moves and always look at the long term picture; building wealth is a marathon and not a quick sprint 📈
Thank you for watching and I will see you tomorrow!
My previous analysis of this asset:

LIOC - Bullish divergence in daily chartEntry Point: 120 to 130
Profit Target: 180-200
Stop-Loss: 110
Disclaimer: The information and analysis provided in this publication are for educational purposes only and should not be construed as financial advice or recommendations to buy, sell, or hold any securities. The author and TradingView are not responsible for any investment decisions made based on the content presented herein. Always consult a financial professional before making any investment decisions.

If we confirm this breakout then....Traders,
A confirmation of this breakout on the daily will lead me to believe we are going to 461 at least and maybe further up to 469? See my latest post on the dollar's trajectory for more (in related links).
Stew

Nvidia -> Slowing Down And Now?Hello Traders and Investors ,
my name is Philip and today I will provide a free and educational multi-timeframe technical analysis of Nvidia 💪
Looking at the monthly timeframe you can see that after Nvidia retested previous support and the 0.786 fibonacci retracement at the $110 level, there was a solid rally towards the upside.
Also on the weekly timeframe you can see that we had a juicy inverted head and shoulders reversal pattern and I pointed out all the reasons why I do expect the upcoming pump of roughly 120% towards the upside.
Looking at the daily timeframe now you can see that Nvidia is a little bit overextended is also slowing down with momentum so there might be the possibility that we will see a short term correction after Nvidia actually breaks the current uptrend line.
Keep in mind: Don't get caught up in short term moves and always look at the long term picture; building wealth is a marathon and not a quick sprint 📈
Thank you for watching and I will see you tomorrow!
My previous analysis of this asset:

ES Futures Primary AnalysisI'll keep this brief.
The area on the chart where purple 5 resides best counts as a 3-wave structure. Therefore, in my primary analysis, I am counting this as an irregular b wave that made a slightly higher high and now we should be heading into the 4370 area for our black c wave of 4. I have a purple alternative 5 on the chart because there is a chance of wave 5 truncation...but that is only confirmed with a breach of 4260. If my primary analysis is correct, our black wave 5 should conclude in the area of 4519-4530.
Therefore we await more price action.
Best to all,
Chris

Tesla -> EV Market On FireHello Traders and Investors ,
my name is Philip and today I will provide a free and educational multi-timeframe technical analysis of Tesla 💪
After Tesla stock retested the last strong support zone for bulls, the 0.786 fibonacci level at the $100 level, the recent pump over the past couple of weeks was no surprise at all.
On the weekly timeframe you can see that Tesla stock is currently retesting previous weekly structure and since Tesla is a little bit overextended we could see a short term drop from here.
However by looking at the daily timeframe you can also see that Tesla stock is not slowing down at all so not all three timeframes are pointing towards more growth yet so I am waiting for a daily and weekly break above the current resistance level and then I do expect more bullish upside.
Keep in mind: Don't get caught up in short term moves and always look at the long term picture; building wealth is a marathon and not a quick sprint 📈
Thank you for watching and I will see you tomorrow!
My previous analysis of this asset:

KOTA.N0000Entry Point: 5.8 - 6.2
Profit Target: 9.2 - 10
Stop-Loss: 5.5
Disclaimer: The information and analysis provided in this publication are for educational purposes only and should not be construed as financial advice or recommendations to buy, sell, or hold any securities. The author and TradingView are not responsible for any investment decisions made based on the content presented herein. Always consult a financial professional before making any investment decisions.

Apple -> New All-Time-HighHello Traders and Investors ,
my name is Philip and today I will provide a free and educational multi-timeframe technical analysis of Apple 💪
Starting on the monthly timeframe you can see that after Apple broke out of the clear triangle formation in confluence with the bullish moving averages, Apple created a strong rally of 30% towards the upside, breaking major resistance.
The weekly timeframe is also showing that Apple is not slowing down at all, there are barely any red candles which means that buyers are 100% in control of the overall bullish market.
And after Apple gapped higher on Friday, the daily timeframe is certainly ready for a short term technical pullback to fill the gap, but then there is definitely a higher chance that the next move on Apple stock will be again towards the upside.
Keep in mind: Don't get caught up in short term moves and always look at the long term picture; building wealth is a marathon and not a quick sprint 📈
Thank you for watching and I will see you tomorrow!
My previous analysis of this asset:

😀APPLE SAYS, 'HELLO, INDIA', as First India Stores Are LaunchedHello once again TradingViewers, and Welcome Aboard 💖
"The stars are aligned"
✨That is what tech pundits and insiders like to say on Apple’s first retail stores in India which will open in Mumbai and Delhi earlier in April, 2023, a move that would get the Cupertino-based company closer to the market with one of the youngest populations in the world.
✨As India’s economy is expected to have solid growth, with its 1.4 billion population, combined with the market’s increasing appetite for high-end smartphones, Apple is seeking to thrive in a market that offers many untapped opportunities for brands like it.
Apple has launched its first stores in India in Mumbai and Delhi.
✨ The Mumbai store will cover well over 22,000 square feet inside the Jio World Drive Mall, an upscale mall owned by India’s richest man Mukesh Ambani.
✨The retail outlet is a beautiful one, featuring a triangular handcrafted timber ceiling that extends beyond the glass façade to the underside of the exterior canopy.
✨ According to Apple, each tile is made from 408 pieces of timber, forming 31 modules per tile with a total of 1,000 tiles that make up the ceiling.
✨ In fact, there are over 450,000 individual timber elements, all of which were assembled in Delhi.
The Store
✨The flagship store, just like Apple’s other retail stores in key locations including Dubai and London, will be a cross between a retail store and an education centre, which Apple calls a "Town Square".
✨Just as with its other flagship locations, Apple’s stores in India will include the new Genius Grove, which is essentially a redesigned Genius Bar, as well as a new in-store experience called "Today at Apple".
✨Apple will also begin offering educational workshops and events, including sessions for photography, music, gaming, and app development.
✨Apple is known for maintaining a tight grip on the sales and distribution of its products. The company operates over 500 directly run stores globally. Until now, consumers in India had to buy iPhones, iPads, and Macs through resellers, online, or when on a trip abroad.
Things to consider
✨ Gaining a foothold in India gives brands like Apple access to a broader customer base.
✨ 65 per cent of Indians are under 35 years old.
✨ Technically, Apple stocks stay firmly above 5-years SMA, as well as above major Bullish multi-year trend
✨ Apple stocks are 30 per cent YTD, and seems are ready for further price action, as key breakout of Head and Shoulders Chart Pattern is happening right now.
