EFX DCA - Inverted H&S Company: Equifax Inc.
Ticker: EFX
Exchange: NYSE
Sector: Industrials
Introduction:
Hello, and welcome to this technical analysis! Today, we're exploring the daily chart of Equifax Inc. on the NYSE. We observe an intriguing pattern within a pattern: a shorter-term head and shoulders continuation pattern nested within a longer-term inverted head and shoulders formation.
Inverted Head and Shoulders Pattern:
An inverted head and shoulders pattern is typically recognized as a bullish reversal pattern, often signaling a transition from a downtrend to an uptrend.
Analysis:
Equifax's price action has been forming an inverted head and shoulders over the past 411 days. The horizontal neckline, which currently acts as resistance, is around $223.50. Despite the lack of symmetry between the shoulders, the right shoulder being higher than the left is often considered a positive sign.
Interestingly, the right shoulder itself contains a shorter-term head and shoulders continuation pattern that has been forming for about 188 days. It's worth noting that the price remains above the 200 EMA.
Aggressive traders could have already positioned themselves with the break of the right shoulder at the head and shoulders, but for the conservative ones, we are patiently waiting for a break above the horizontal neckline.
The price target for the inverted head and shoulders pattern is $300.84, which represents an approximate increase of 34.58%. Meanwhile, the shorter-term pattern suggests a price target of $257, or around a 22.77% increase.
Conclusion:
The daily chart of Equifax Inc. presents an intriguing situation where a short-term head and shoulders pattern forms within a longer-term inverted head and shoulders. A confirmed breakout above the neckline could signal a bullish reversal and offer a promising long position entry.
As always, it's crucial to perform your own due diligence and employ suitable risk management strategies before making any investment decisions.
Thank you for tuning into this analysis. Please remember to like, share, and follow for more market insights. Happy trading!
Best regards,
Karim Subhieh
Stockmarketanalysis

Apple -> Leading The RallyHello Traders,
welcome to this free and educational multi-timeframe technical analysis .
On the weekly timeframe you can see that Apple stock is approaching a quite obvious previous weekly resistance zone at the $180 level which is now turned resistance again.
You can also see that over market structure is still massively bullish, I am also definitely expecting new all-time-highs on Apple so I am now just waiting for a short term rejection and then I do expect more continuation towards the upside.
On the daily timeframe you can see that Apple stock is still creating bullish market structure with the recent break and retest of the $175 level, so there is still no sign of Apple slowing down, so I will just wait for a short term correction before I then do expect more continuation towards the upside.
Thank you for watching and I will see you tomorrow!
You can also check out my previous analysis of this asset:

Are we in verge of another crypto and stock bullrunAs always I am not an expert, just a researcher and enthusiastic person in macro-economy trends.
As the chart is representing, the fall in DXY means a gain in crypto and the stock market's valuation, but be aware not all the devaluation of the Dollar against other currency means there will be a bull run (such as in 2008)
My minimum expectation is a relief rally for major markets, for the more hopium senario, we can expect a higher high in all markets but bear in mind the stock market has been in a bull run for nearly a 14 years and we are nearly topped in most of the markets.

Google: Reversal Incoming?Here we are looking at GOOGL on the Daily TF...
Currently, there is a lot of factors aligning on the GOOGL chart, which is the type of confluence I look for when evaluating trade opportunities. The first factor that I'm looking at is the horizontal resistance line as shown on the chart. This resistance stretches from it another local high made months prior. This should act as strong resistance. The second factor I'm looking at is that there is a time count of 7 consecutive green daily candles, which is something I look to pair with a strong resistance zone (as previously mentioned). The third and final factor that aligns on this chart is a potential topping tail being put it. This hasn't confirmed yet, but there is a strong chance that it will.
I will continue to monitor this chart, and provide timely updates as I see fit!
Cheers

Nifty50 Day start analysis: 2023.05.18Nifty50 has completed Wave b and is not into beginning of Wave c.
The possibilities of end of wave c marked on the chart.
SL set shall be top of wave b.

Micron Technology (MU) DCA - Rectangle Pattern Company: Micron Technology
Ticker: MU
Exchange: NASDAQ
Sector: Technology
Introduction:
Hello, and thank you for joining me for this technical analysis. Today, we will take a close look at Micron Technology (MU), specifically focusing on a Rectangle pattern that has formed on the daily chart.
Rectangle Pattern:
The Rectangle pattern is a period of consolidation, often following a significant price move, where the price bounces between horizontal support and resistance levels. This pattern can act as either a continuation or a reversal pattern, depending on the breakout direction.
Analysis:
Over the past 355 days, MU's price has been oscillating between an upper boundary at $64.37 and a lower boundary at $48.61, forming a clear Rectangle pattern. We can identify six touch points at the upper boundary and two at the lower boundary, indicating that the price is consolidating within this range.
Currently, the price appears to be attempting a breakout above the upper boundary, which could present a long entry opportunity if successful. Furthermore, the price is positioned above the 200 EMA, suggesting a bullish market environment.
If the breakout is confirmed, the price target would be $80, representing a potential gain of approximately 24%.
Conclusion:
In conclusion, Micron Technology's daily chart shows a well-defined Rectangle pattern, signaling a period of consolidation. A breakout above the upper boundary could present a lucrative trading opportunity. As always, it's crucial to manage risk effectively and ensure your trading decisions align with your overall investment strategy.
Please note that this analysis does not constitute financial advice. Always conduct your own research before making investment decisions.
If you found this analysis helpful, please like, share, and follow for more updates. Happy trading!
Best regards,
Karim Subhieh

#HINDUNILVR.. Looking good 18.05.23#HINDUNILVR.. ✅▶️
Intraday as well as swing trade
All levels given in charts ...
IF good potential seen then we work in options also
if activate then possible a huge movement Keep eye on this ...
We take trade only when it activates...
Possible to give good target
TRADING FACTS

Key Levels and US Market Review for the Asian session open 12/05Markets came under pressure again on concern of an economic slowdown. Europe was hit lower with the DAX and FTSE100 looking weak. US data out weighed on the US open to pressure key indexes lower although tech and the Nasdaq remain relatively strong. US data out was mixed with unemployment claims higher and PPI showing strength. The uncertainty sent USD higher and commodities lower with Copper taking a hit.
Expecting a mixed open for Asia with the ASX200 to open slightly weaker while the Nikkei and Hang Seng set to open up.
If inflation is truly remaining 'sticky', coming economic data will be the major focus and I expect this will translate to choppy markets or further pressure from sellers looking to lock in some gains.
Some KEY ACTIONABLE LEVELS into the Asian market session. Review of the European and US sessions and what that will mean to the price action in the near term along with key levels to watch.
Markets covered :-
DOW
Nasdaq
DAX
FTSE
ASX200
Hang Seng
USD Index
Gold
Oil
Copper

Apple -> Short Term TopHello Traders,
welcome to this free and educational multi-timeframe technical analysis .
On the weekly timeframe you can see that Apple stock is currently approaching a quite massive previous weekly resistance area at the $175 level which is now turned strong resistance once again.
You can also see that over the past couple of weeks, Apple stock had a rally of about 35% towards the upside without any noticable correction, so I am now just waiting for a short term rejection away from the resistance area and then I do expect more continuation towards the upside.
On the daily timeframe you can see that Apple stock is still creating bullish market structure and moving averages are also massively bullish, so I am now just waiting for some consolidation and bearish pressure before I then do expect a short term dump away from the resistance area.
Thank you for watching and I will see you tomorrow!
You can also check out my previous analysis of this asset:

Toyota Motor Corporation DCA - Rectangle Reversal Company: Toyota Motor Corporation
Ticker: 7203
Exchange: TSE
Sector: Automotive
Introduction:
Hello and thank you for taking the time to read my post. Today, we analyze the daily chart of Toyota Motor Corporation, focusing on a potential Rectangle reversal pattern. This pattern may indicate a change in the trend and offers trading opportunities for both short-term gains and long-term positions.
Rectangle Reversal Pattern:
The Rectangle pattern is a consolidation pattern that forms when the price is bounded by parallel support and resistance levels. It can act as a continuation or reversal pattern, depending on the preceding trend and the breakout direction. A breakout above the resistance level signals a potential trend reversal.
Analysis:
On the daily chart, Toyota Motor Corp has been in a clear downward trend, as indicated by the blue diagonal resistance line. However, the Rectangle pattern, which has four touch points at the top and five at the bottom, could potentially serve as a reversal pattern.
Currently, the price is attempting to break above the 200 EMA. If a breakout occurs with a candle close above this level, the price target is ¥14550, representing a gain of approximately 7.5%. This setup could also present a good opportunity to build a longer-term position, depending on the trend opportunity and whether the Rectangle pattern truly acts as a reversal signal.
Conclusion:
The Toyota Motor Corp daily chart analysis highlights a Rectangle reversal pattern, signaling a potential trend reversal. Traders should closely monitor the 200 EMA for any signs of a breakout. As always, it's essential to consider risk management and proper position sizing when trading based on chart patterns.
Please note that this analysis is not financial advice. Always do your own due diligence when investing or trading.
If you found this analysis helpful, please like, share, and follow for more updates. Happy trading!
Best regards,
Karim Subhieh

#APOLLOHOSP LOOKING AT GIVEN LEVEL#APOLLOHOSP... ✅▶️
Intraday as well as swing trade
All levels given in charts ...
IF good potential seen then we work in options also
if activate then possible a huge movement Keep eye on this ...
We take trade only when it activates...
Possible to give good target
TRADING FACTS

Key Levels and US Market Review for the Asian session open 3/05Major Indexes in Europe and the US came under pressure as traders went risk off. New banking concerns for the US weighed on the action along with worse than expected economic data. Traders will be focused now on the FOMC rate statement to see what the Fed has to say about inflation. Expectations are that the Fed will raise rates 0.25% and potentially signal one more rise....as long as inflation data comes down further. US key employment data out Friday will also be a focus for the remainder of the week.
Expecting a weaker open for Asian markets after the selloff into the overnight session. Expecting the ASX200 to open down 35/40 points while the Hang Seng to open down 180 points.
With a resilient US economy, sticky inflation is the big issue and also a slowing economy. Traders will be eager to hear what the US Fed has to say in the FOMC statement.
Some KEY ACTIONABLE LEVELS into the Asian market session. Review of the European and US sessions and what that will mean to the price action in the near term along with key levels to watch.
Markets covered :-
DOW
Nasdaq
DAX
FTSE
ASX200
Hang Seng
USD Index
Gold
Oil
Copper

#INDIACEM Looking good at given level#INDIACEM... ✅▶️
Intraday as well as swing trade
All levels given in charts ...
IF good potential seen then we work in options also
if activate then possible a huge movement Keep eye on this ...
We take trade only when it activates...
Possible to give good target
TRADING FACTS

AAPL - Time for a Correction??NASDAQ:AAPL Has rallied 35% this year and is coming into Earnings this week.
Most of the other Tech giants have reported and have had rallies, Is AAPL going to continue this or are we due for another correction to get long.
If its really bullish like the last move a move back to 160 would be all we get. If it breaks through these levels then 150-155 is the next level.
There are smaller patterns completing around 170-171 so these are the levels to watch.
US Interest rates this week which will give a bit of volatility and the VIX is at very low levels not seen since 2021.
These are the conditions setting up this week.
Enjoy the week.

SPX500 Long term buy + Retracement MoveSPX and indices are in bullish run but currently hit slight O/S status where I see a drop & then turn around for the rebound.

NIFTY PREDICTION TODAY - 27/04/23
Nifty will behave very wildly today without any strong price movement
Initially going upwards then will reverse and go downwards and finally will go upwards again
Chances are very high for it to go sideways & it will be extremely difficult to make profits from intraday today

Nifty Prediction for Tomorrow - 2 MayLets discuss tomorrow Nifty Prediction or Scenarios:
on 2 May 2023 Spot Nifty Closed at 18065 (+ 0.84%)
Pivot Level : 18013.10
Support Level : 17937.05 / 17809.10
Resistance Level : 18141.04 / 18217.10
Scenario 1 :- If Nifty open near 18120, we can enter in call option or buy futures for the target of 18180 with Strict Stop Loss of 18095.
Scenario 2 :- If Nifty open near 18180, buy a put option or sell futures for target of 17985 with very small Stop Loss 18205.

Head and Shoulders Topping Formation on the Russell2000The recent failure of First Republic Bank highlights the problems facing the US banking system. These problems include the continued increase of delinquency rates on Credit cards, Commercial Real Estate & Automobiles, as well as a decrease of commercial bank deposits and M2 money supply (-4.2% YoY). These problems, among others, are causing banking institutions to rein in their lending to build reserves and take on debt from the FED & FHLBs to meet deposit withdrawals. This reduces the profitability of banks and restricts credit into the economy, which reduces economic activity as a whole. The economy had already begun slowing heavily before the credit crunch began in March 2023, but the current business cycle downturn, combined with 3 large regional bank failures and rising continuing jobless claims, portend a severe & lengthy economic contraction. The Conference Board Leading Economic Indicators registered a -7.2% YoY Contraction recently. Since 1968, Any Conference Board LEI contraction of more than -2% YoY has never yielded a false positive in regards to a coming recession.
Over 40% of Russell2000 companies are unprofitable and over 24% of S&P500 companies are zombie companies. Markets are still very overvalued within the context of a 5% Fed funds rate, contracting earnings, a credit crunch, and ongoing quantitative tightening by the FED. The markets have been seeing less buying volumes as well as carving out a head and shoulders top on the Russell2000. Other problems facing the banks include the popping auto & commercial real estate debt bubbles, as well as increasing large corporate bankruptcies (The most since 2010 thus far this year). The IPO market is the weakest it has been since 2009 (by total proceeds), which is also hurting Investment banking profits. I see the potential for 5%-10% possible upside and 35%-50% downside for the Russell2000 & S&P500 over the next 9 -18 months.
Thank you for reading,
Alexander C. Lambert

#CNQ (CDN NATURAL RES), NEO MARKETHi
#CNQ (CDN NATURAL RES), Canada NEO MARKET
is in upward waves so if you get in a position with following details just exit position if updating trendline broke
Entry:81.29
SL:79.43
TP=1:10 and more but wait for trendline break and dont forget update trendline

MFC(MANULIFE FIN) Share , Canada NEOMFC(MANULIFE FIN) Share , Canada NEO Market is in good supply zone
but its better to wait for confirmation candle
Entry:26.90
SL:27.54
TP:19.64
RR: 1:11
If you like Support me by Comment and Sharing

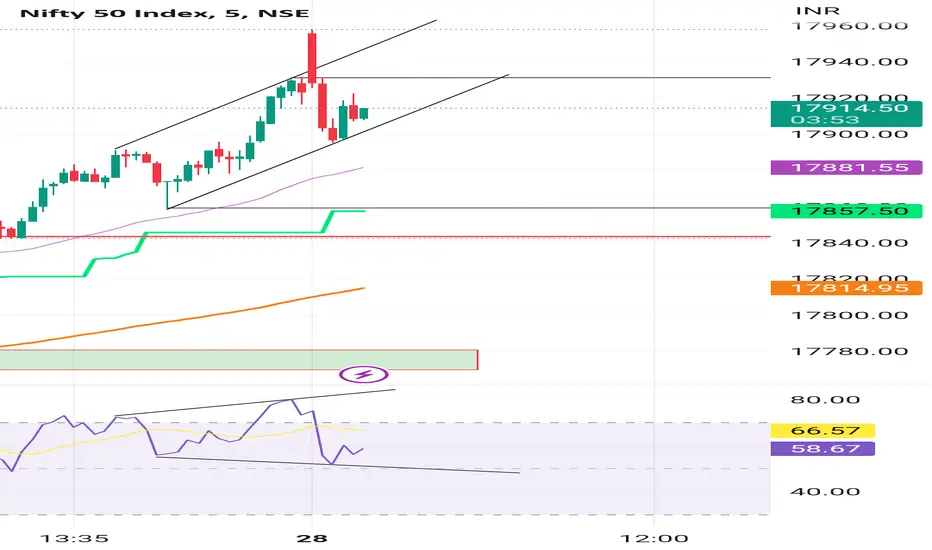
Nifty Prediction for Todayon 27th April 2023 Spot Nifty Closed at 17915.05 (+ 0.57%)
Pivot Level : 17881.45
Support Level : 17831.30 / 17747.55
Resistance Level : 17965.30 / 18015.35
Scenario 1 :- If Nifty open flat and sustain 17863, we can enter in call option or buy futures for the target of 17950 with Strict Stop Loss of 17843.
Scenario 2 :- If Nifty closes any candle below 17860, buy a put option or sell futures for target of 17885 with very small Stop Loss 17863.
Google -> Finally The BottomHello Traders,
welcome to this free and educational multi-timeframe technical analysis .
On the weekly timeframe you can see that Google stock just recently perfectly broke above and is now retesting a major previous weekly structure area which is now turned support at the HKEX:104 level.
You can also see that weekly market structure is now bullish, moving averages are also bullish and the recent price action on Alphabet stock just looks like a solid bottom formation so I simply do expect more continuation towards the upside from the current levels.
On the daily timeframe you can see that market structure is about to shift bearish so I am now just waiting for a clear bullish impulse and break above the daily HKEX:107 resistance before I then do expect more continuation towards the upside.
Thank you for watching and I will see you tomorrow!
You can also check out my previous analysis of this asset:

#SCM(STEADRIGHT CRITICAL MINERALS INC.) Long#SCM(STEADRIGHT CRITICAL MINERALS INC.) is in demand zone
Entry:0.100
SL:0.080
TP1:0.285 (187%)
TP2:0.405(300%)
Have Fun and support by share and comment
