SBI: Inverse H&S BreakoutThe Inverse Head and Shoulders pattern is a bullish reversal chart pattern that signals a potential trend reversal from bearish to bullish. It consists of three key components:
Structure of the Pattern:
Left Shoulder: A price decline followed by a temporary rally.
Head: A deeper decline forming the lowest point, followed by another rally.
Right Shoulder: A decline similar in size to the left shoulder but not as deep as the head, followed by a move higher.
Neckline: A resistance level that connects the highs of the two rallies after the left shoulder and head.
The Inverse Head and Shoulders pattern in SBI, with a neckline at ₹783, indicates a potential bullish reversal. The stock has formed a well-defined left shoulder, head, and right shoulder, suggesting that selling pressure is weakening. The target price for this breakout is ₹900 calculated by measuring the distance from the head’s low to the neckline and projecting it upwards. If the stock sustains above the neckline, it could gain further momentum. However, traders should consider placing a stop-loss at 730 to manage risk in case of a failed breakout.
Stockmarketanalysis

Alibaba - Don't Forget Chinese Stocks Now!Alibaba ( NYSE:BABA ) still remains super interesting:
Click chart above to see the detailed analysis👆🏻
After we saw the very expected parabolic rally on Alibaba about four months ago, Alibaba is now perfectly retesting major previous structure. Yes, we could see a short term pullback in the near future but this just offers a perfect break and retest after the rounding bottom pattern.
Levels to watch: $110, $140
Keep your long term vision,
Philip (BasicTrading)

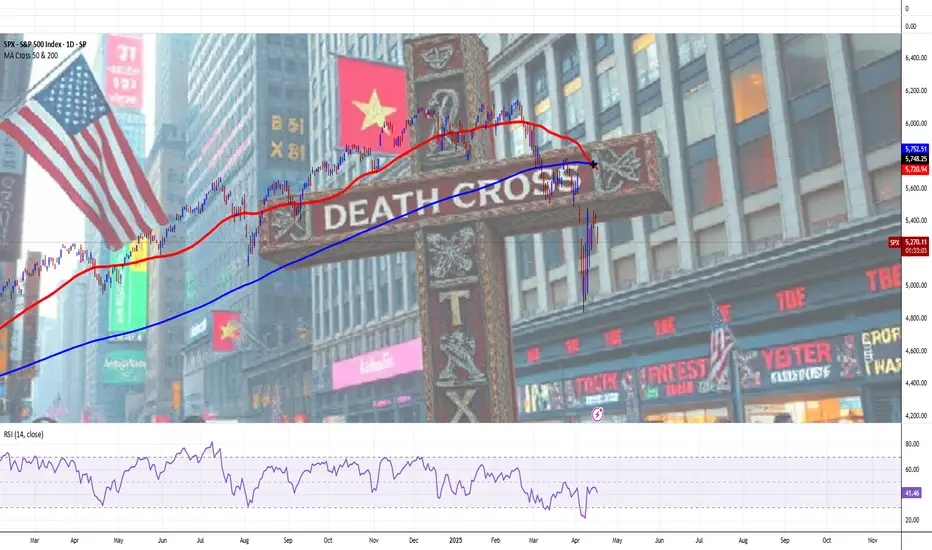
S&P 500 Index Goes 'Death Crossed' Again, Due To Unruly EconomyThe "Death Cross" is a technical chart pattern signaling potential bearish momentum in the US stock market, occurring when a short-term moving average (typically the 50-day) crosses below a long-term moving average (usually the 200-day).
Despite its foreboding name, historical data shows its implications are often less dire than perceived, serving as a coincident indicator of market weakness rather than a definitive predictor of collapse.
Historical Examples and Market Impact
The death cross gained notoriety for preceding major market downturns:
2000 Dot-Com Bubble: The Nasdaq Composite’s death cross in June 2000 coincided with the burst of the tech bubble, leading to a prolonged bear market.
2008 Financial Crisis: The S&P 500’s death cross in December 2007 foreshadowed the 2008 crash, with the index losing over 50% of its value by early 2009.
2020 COVID-19 Crash: The S&P 500, Dow Jones, and Nasdaq 100 all formed death crosses in March 2020 amid pandemic-driven panic, though markets rebounded sharply within months.
2022 Ukraine's War Crisis: The S&P 500, Dow Jones, and Nasdaq 100 all formed death crosses in March 2022 due to proinflationary surge on Ukraine's war and Arab-Israel conflict, leading to a prolonged bear market within next twelve months, up to March quarter in the year 2023.
These examples highlight the pattern’s association with extreme volatility, but its predictive power is inconsistent. For instance, the 2022 death cross in the S&P 500—its first in two years—occurred amid Fed rate hikes and geopolitical tensions, yet the market stabilized within weeks rather than entering a prolonged downturn.
Perspectives on Reliability and Use Cases
While the death cross reflects deteriorating short-term momentum, its utility depends on context:
Lagging Nature: As a lagging indicator, it confirms existing trends rather than forecasting new ones. The 50-day average crossing below the 200-day often occurs after prices have already declined.
False Signals: Post-2020 data shows the S&P 500 gained an average of 6.3% one year after a death cross, with Nasdaq Composite returns doubling typical averages six months post-cross.
Combined Analysis: Traders pair it with metrics like trading volume or MACD (Moving Average Convergence Divergence) to validate signals. Higher selling volume during a death cross strengthens its bearish case.
Strategic Implications for Investors
For market participants, the death cross serves as a cautionary tool rather than a standalone sell signal:
Short-Term Traders: May use it to hedge long positions or initiate short bets, particularly if corroborated by weakening fundamentals.
Long-Term Investors: Often treat it as a reminder to reassess portfolio diversification, especially during elevated valuations or macroeconomic uncertainty.
Contrarian Opportunities: Historical rebounds post-death cross—such as the 7.2% Nasdaq gain three months after the signal—suggest potential buying opportunities for risk-tolerant investors.
Fundamental Challenge
Stocks Extend Drop as Powell Sees Economy ‘Moving Away’ From Fed Goals
Powell sees economy ‘moving away’ from job, price goals due to Trump's tariff chainsaw.
Fed well positioned to wait for policy clarity. Strong jobs market depends on price stability, he adds.
Stocks extend declines, bonds rally as Fed chair speaks.
Conclusion
The "Death Cross" remains a contentious yet widely monitored pattern. Its dramatic name and association with past crises amplify its psychological impact, but empirical evidence underscores its role as one of many tools in technical analysis. Investors who contextualize it with broader market data—such as earnings trends, interest rates, and macroeconomic indicators—are better positioned to navigate its signals.
While it may foreshadow turbulence, its historical track record emphasizes resilience, with markets often recovering losses within months of the pattern’s appearance.
--
Best wishes,
Your Beloved @PandorraResearch Team 😎
// Think Big. Risk Less
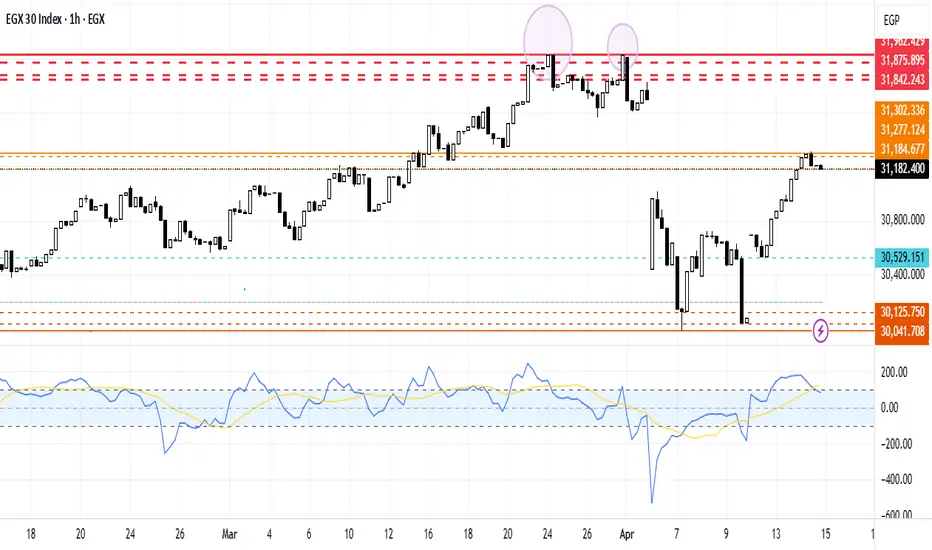
The Effect of US Tariff Exemptions on EGX30.EGX30 stock stabilized in a consolidation zone, failing to breach the 29991 support line. Despite breaking the 30041 support line to the downside, it corrected its upward trajectory between the 30529 support line and the 31302 resistance line, reflecting the bulls' dominance over the bears. This is because Egypt agreed to work towards a package of $7.5 billion in direct Qatari investments, according to a joint statement released by the Egyptian president's office on Monday. In addition, Egypt is pushing ahead with efforts to secure funding from Gulf neighbors and foreign partners as it seeks to tackle heavy foreign debts and a gaping budget deficit.
Price Action: Dow Jones Index DJI Monday 4/14/2025In this video, we will be looking at the Daily Chart for the Dow Jones Index (DJI) and its potential price action forecast for Monday 4/14/2025.

SPY LONG SET UP(BUY THE DIP)Entry 1 $500.00
Entry 2 $460.00
Stop loss $440.00
Take profit 1- $550.00
(Close 25%)
Take profit 2- $600.00
(Close 50%)
Take profit 3-$650.00
(Close 75%)
Take profit 4-$700.00
(Close 100%)

Expecting more USD selling overall: Weekly Market PreviewIn this video I go over last week's epic volatility and what I am looking for going forward.
Long positions on EUR/USD at 1.0980 will remain in tact and still eyeing a target of 1.2000 out of the falling wedge displayed on both the monthly and quarterly charts.
I do expect some pullback after a massive move to the upside to end the week however, the bull can become relentless and continue it's strength due to the U.S. Dollar weakness across the board.
USD/JPY is another one I am watching and initiated a short position at 143.31 with a target at 133. If the large weekly broadening pattern runs it's course, I expect for that target to get hit.
Tech may get relief after Trump announced over the weekend that there will be exemptions but the market can remain irrational and continue overall weakness especially since the U.S. economy as a whole is not well.
Hope you enjoy the video and we'll see what we get this upcoming week, especially with Federal Reserve Powell set to speak on Wednesday.
As always, Good Luck & Trade Safe.

SPY, More pain to come? SPY / 1D
Hello Traders, welcome back to another market breakdown.
SPY is showing strong bearish momentum, breaking below resistance. However, the price is in the oversold zone for now. Hence, instead of jumping in at current levels, I recommend waiting for a pullback into the middle of the range zone for a more strategic entry.
If the pullback holds and sell mode confirms, the third leg lower could target new lows.
Stay disciplined, wait for the market to come to you, and trade with confidence!
Trade safely,
Trader Leo.

Some say bitcoin is an un-correlated asset. What about XRP ???This chart clearly shows how XRP is uncorrelated to the price of the S&P !!
Some experts in crypto say that Bitcoin is an un-correlated asset. However, if bitcoin is, XRP is even more so.
The chart moreover shows how the price of XRP broke out of an 7 YEAR BEAR FLAG !!!
It broke down decisevely in november 2024.
At the present moment it is making a halt, drawing a bear flag (n° 2) as it did after it broke down of a very similar bear flag in March of 2017 (n° 1).
How do you think this will resolve ?
Any more questions ?
This is a very bearish chart - for the SPX !!!

Quantum's HIMS Trading Guide 4/10/25 HIMS (Hims & Hers Health, Inc.) - Sector: Healthcare (Telehealth)
Sentiment: Bullish. Post-close call volume steady, RSI ~58 (up from ~55), Amplified GLP-1 demand—speculation persists despite tariff noise.
Tariff Impact: Minimal. Domestic focus shields HIMS; 104% China tariffs irrelevant unless generics supply tightens.
News/Catalysts:
Current: tariff pause softens market fear.
Upcoming: Retail Sales (April 15)—strong data could lift +5%; Fed rate outlook (May 2025)—cut signals might push +7%.
Technical Setup:
--Weekly Chart:
---HVN $30 (resistance), support ~$25.45.
---Uptrend (8-week EMA > 13-week > 48-week).
---RSI ~58, MACD above signal,
---Bollinger Bands upper band,
---Donchian Channels above midline,
---Williams %R -25.
--One-Hour Chart:
---Support $28.50, resistance $29.50.
---RSI ~60,
---MACD above signal,
---Bollinger Bands upper band,
---Donchian Channels above midline,
---Williams %R -20.
--10-Minute Chart:
---8/13/48 EMAs up,
---RSI ~62,
---MACD rising.
Options Data:
--GEX: Bullish—pinning near $29.
--DEX: Bullish—call delta dominates.
--IV: High—~50–55% vs. norm 45–50%.
--OI: Call-heavy—above $29.
Timeframe Analysis:
---Weekly: OI call-heavy (70% calls at $30), IV high (55%)—bullish, speculative push.
---Monthly: OI call-leaning (65% calls at $30–$32), IV moderate (50%)—bullish trend.
---3-Month: OI call-heavy (75% calls at $32), IV moderate (45%)—bullish long-term.
Directional Bias:
---Bullish. GEX/DEX and call OI signal strong upside; high IV fuels volatility—intraday breakout potential.
Sympathy Plays:
---TDOC rises with HIMS; AMWL gains with HIMS.
---Opposite: HIMS rallies → WMT fades.
Sector Positioning with RRG: Leading Quadrant (Healthcare vs. XLV)—growth persists.
Targets: Bullish +6% ($30.77); Bearish -3% ($28.16).

S&P 500 Index Under Pressure – Another -10% Drop Incoming?Today, I want to analyze the S&P 500 Index ( FOREXCOM:SPX500 ) for you. This index is one of the most important indices in the US stock market , which has been determining the direction of parallel financial markets such as crypto and especially Bitcoin ( BINANCE:BTCUSDT ) for the past few days, so an analysis of this index can be important for us.
The S&P 500 Index started to fall after Donald Trump imposed new tariffs on countries around the world, which was like a coronavirus .
The question is whether this fall is temporary or will continue . To answer this question, we need to consider many parameters, but if we look at the sds chart from a technical analysis chart , we can expect a further decline .
The S&P 500 Index is moving near the Resistance zone($5,284-$5,095) and is completing a pullback . It also lost its important Uptrend lines last week, which is not good news for the S&P 500 Index and US stocks .
From an Elliott wave theory , the S&P 500 IndexS&P looks like it has completed the main wave 4 , and we should expect the next decline(-10%) .
I expect the S&P 500 Index to attack the Heavy Support zone($4,820-$4,530) at least once more. The area where we can expect the S&P 500 Index to pull back is the Potential Reversal Zone(PRZ) .
What do you think? Will the S&P 500 Index continue its downward trend, or was this decline temporary?
Note: If the S&P 500 Index touches $5,408, we can expect further Pumps.
Note: There is a possibility of a Bear Trap near the Heavy Support zone($4,820-$4,530) and PRZ.
Please respect each other's ideas and express them politely if you agree or disagree.
S&P 500 Index Analyze (SPX500USD),4-hour time frame.
Be sure to follow the updated ideas.
Do not forget to put a Stop loss for your positions (For every position you want to open).
Please follow your strategy and updates; this is just my Idea, and I will gladly see your ideas in this post.
Please do not forget the ✅' like '✅ button 🙏😊 & Share it with your friends; thanks, and Trade safe.

Apparatchik Trump Says 'No.. More Pain' Ahead of Amazon EarningsPresident Trump's new tariffs have had a significant negative impact on Amazon's stock performance, revenue, and earnings, primarily due to increased costs and supply chain disruptions.
Here below is a detailed analysis of these effects.
Impact on Amazon's Stock Performance
Amazon's stock has seen substantial declines following the announcement of Trump's tariff plan. The company's shares dropped nearly 7% within two days of the announcement and are down nearly 21% year-to-date. These tariffs have exacerbated existing challenges for Amazon, which was already struggling in early 2025 with a 13% decline in stock value during the first quarter. The broader market also suffered, with technology stocks experiencing sharp declines as investors reacted to fears of higher costs and inflation.
Revenue Challenges
Amazon's reliance on Chinese suppliers for merchandise has made it particularly vulnerable to the newly imposed tariffs. Over 50% of Amazon's top third-party sellers are based in China, and many of their products are subject to hefty import taxes, including a 34% tariff on Chinese goods. These tariffs increase landed costs for a significant portion of Amazon's inventory, forcing sellers to either absorb the additional expenses or pass them on to consumers through higher prices. This could lead to reduced consumer demand, as higher prices may deter shoppers from purchasing goods on Amazon's platform.
Additionally, the elimination of duty exemptions on minor imports—previously advantageous for discount platforms such as Temu and Shein—has disrupted Amazon's competitive pricing strategy. While this change may level the playing field among e-commerce platforms, it also raises operational costs for Amazon's marketplace vendors who had relied on these exemptions.
Earnings Pressure
The tariffs are projected to slash Amazon's annual operating profits by $5 billion to $10 billion due to increased merchandise costs. Goldman Sachs estimates that these costs could rise by 15% to 20%, further straining profitability. While Amazon has historically maintained lower prices compared to competitors, absorbing these increased expenses without raising prices significantly may be unsustainable in the long term.
Moreover, fears of inflation resurgence due to Trump's trade policies could further dampen consumer purchasing power. This would likely lead to lower sales volumes and additional pressure on profit margins across Amazon's retail operations.
Potential Mitigation Strategies
To counteract these challenges, Amazon may implement several measures:
Vendor Negotiations. The company could negotiate with suppliers to share the burden of increased input costs rather than bearing them entirely.
Price Adjustments. Selective price increases on certain products may help offset rising costs without alienating customers entirely.
Supply Chain Diversification. Shifting sourcing away from heavily tariffed regions like China or focusing more on domestic suppliers could reduce exposure to trade disruptions.
Focus on Services. Amazon’s cloud division, AWS, contributes significantly to its operating income (58% in Q4 2024) and remains largely unaffected by tariffs. Increased emphasis on AWS could help mitigate losses from retail operations.
Technical challenge
The main technical graph indicates on Bearish market in development, with nearly 30% potential to further decline, down to major 10-year average support.
Conclusion
Trump’s tariffs have created substantial headwinds for Amazon by driving up costs and disrupting its supply chain. These challenges have led to stock declines, reduced revenue potential, and significant earnings pressure. While Amazon is exploring mitigation strategies such as vendor negotiations and diversification, the long-term impact will depend on how effectively the company adapts its operations amidst ongoing trade tensions.
--
Best 'Apparatchik' wishes,
PandorraResearch Team 😎

Quantum's ZIM Trading Guide 4/8/25
NYSE:ZIM
(ZIM Integrated Shipping Services Ltd.) - Sector: Industrials (Shipping)
Sentiment:
--Bearish (slight softening). Pre-market put volume softened, RSI likely ~35 (down from ~38 with a -2.8% drop from $12.9608 to $12.591), X posts overnight mixed—tariff fears dominate, but LNG fleet news (10 new 11,500 TEU vessels announced April 8) offers faint hope, suggesting a less aggressive sell-off than March’s lows.
Tariff Impact:
--Severe. 10% universal tariffs raise fuel and container costs, with 46% Vietnam tariffs threatening Asia-U.S. routes (70%+ revenue). Sentiment overshadows fundamentals, though LNG fleet modernization and freight rate resilience provide a slight buffer.
News/Catalysts:
--Consumer Credit (April 8) could signal trade demand—weak data may deepen ZIM’s slide; X posts on the $2.3B LNG charter deal (announced April 8) and potential freight rate stabilization (e.g., Red Sea tensions) might spark a relief rally today.
Technical Setup:
--Weekly Chart:
---HVN near $15 as resistance (March 25 high: $15.2512), weekly low ~$12.4106 as support
---Downtrend (8-week EMA < 13-week < 48-week, reflecting $12–$20 range since March).
---RSI ~35 (weakening, near oversold),
---MACD below signal (histogram narrowing),
---Bollinger Bands at lower band,
---Donchian Channels below midline,
---Williams %R -80 (oversold).
-One-Hour Chart:
---Support at $12.81 (April 7 prev. close proxy), resistance at $13.547 (April 7 high), weekly confluence.
---RSI ~37, MACD below signal (histogram less negative),
---Bollinger Bands at lower band,
--- Donchian Channels below midline,
---Williams %R -78 (easing from oversold).
-10-Minute Chart:
---Pre-market drop to $12.591, 8/13/48 EMAs down, RSI ~35, MACD flat near zero.
Options Data:
--GEX: Bearish (softening)—pinning near $12.9608 eases pre-market, dealers less aggressive.
--DEX: Bearish—put delta leads but with reduced intensity.
--IV: High—~55–60% vs. norm 45–50%, reflecting tariff-driven volatility.
--OI: Put-heavy—OI concentrated below $13, capping upside momentum.
Directional Bias: Bearish (softening). GEX’s fading pinning reduces downside lock, DEX’s put delta sustains selling but softens, high IV supports volatility without sharp drops, and put-heavy OI anchors lower—bearish with less conviction.
Sympathy Plays:
--SBLK (Star Bulk Carriers): Falls if ZIM dumps (shipping correlation), rises if ZIM rebounds.
--MATX (Matson, Inc.): Drops with ZIM downside, gains if ZIM recovers.
--Opposite Mover: ZIM dumps → defensives like KO rally; ZIM rallies → SBLK/MATX surge.
Sector Positioning with RRG:
--Sector: Industrials (Shipping)
---RRG Position: Lagging Quadrant (slight improvement). ZIM’s pre-market softening from $12.9608 eases its lag vs. XLI, buoyed by LNG news.
Targets: Bullish +4% ($13.50, hourly resistance); Bearish -5% ($12.00, near April low).

AMZN LONG/SHORT SET UP(Amazon) If $160.00 holds we can see $200
if we break below$160.00 we could see $140-$120
LONG TRADE
Entry 1 $175.00
Entry 2 $165.00
Stop loss $155.00
Take profit 1- $195.00
(Close 33%)
Take profit 2- $215.00
(Close 66%)
Take profit 3-$230.00

Quantum's IWM Trading Guide 4/8/25IWM (iShares Russell 2000 ETF) - Sector: Broad Small-Cap ETF (Russell 2000)
Sentiment:
--Bearish (softening). Pre-market put volume eased, RSI 44 up from 42, X posts overnight hint at an oversold bounce despite tariff fears, suggesting a less dire tone.
Tariff Impact:
--Moderate. Industrials/financials exposure persists.
News/Catalysts:
--Consumer Credit (April 8) could spark a relief rally if strong; X posts on tariff delays offer faint hope, though bearish bias lingers.
Technical Setup
-Weekly Chart:
---HVN above as resistance, weekly low as support.
---Downtrend (8-week EMA < 13-week < 48-week).
---RSI 44 (less weak), MACD below signal (histogram narrowing)
---Bollinger Bands near lower band,
---Donchian Channels below midline,
---Williams %R -70 (easing from -74).
-One-Hour Chart:
---Support at yesterday’s low, resistance at midday high, weekly confluence.
---RSI 42 (up from 40),
---MACD below signal (histogram less negative),
---Bollinger Bands near lower band,
---Donchian Channels below midline,
---Williams %R -72 (up from -76).
-10-Minute Chart:
---Pre-market bounce attempt, 8/13/48 EMAs flat (less steep),
---RSI 42 (up from 38),
---MACD flat near zero.
Options Data:
---GEX: Bearish (softening)—pinning pressure eased slightly overnight.
---DEX: Bearish (softening)—put delta leads but less aggressively.
---IV: Moderate—25–30% vs. 20–25% norm, steady volatility.
---OI: Put-heavy—high OI below close persists.
---Directional Bias: Bearish (softening). GEX’s reduced pinning suggests less dealer-driven downside, DEX’s put delta bias weakens, moderate IV supports some volatility but not extreme moves, and put-heavy OI anchors prices lower—still bearish but with less conviction.
Sympathy Plays:
--TNA (Direxion Small Cap Bull 3X): Falls 3x if IWM dumps, rises if IWM rebounds.
--TZA (Direxion Small Cap Bear 3X): Gains if IWM dumps, fades if IWM rallies.
--Opposite Mover: IWM dumps → TZA rallies; IWM rallies → TNA surges.
Sector Positioning with RRG:
--Sector: Broad Small-Cap ETF (Russell 2000).
--RRG Position: Lagging Quadrant. Tariff/rate drag persists.
Top 5 Movers (Russell 2000): SMCI (+2%), MARA (+1.5%), RIOT (+1%), CVNA (+0.8%), PLUG (+0.5%).
Bottom 5 Movers (Russell 2000): AMC (-3.5%), RKT (-3%), UPWK (-2.5%), ZETA (-2%), RUN (-1.8%).

THE REALITY!You cant beat the Index fund in Long term growth....Compare your portfolio with Major Indices
Warren buffet Quote - You can't Beat S&P500 Index

Intel - This Stock Is A Goldmine!Intel ( NASDAQ:INTC ) perfectly respects all structure:
Click chart above to see the detailed analysis👆🏻
Over the past couple of years Intel clearly established a significant downtrend, dropping about -70% after we saw the previous all time high. This bearish pressure is now ending though and if Intel manages to create a bullish reversal break and retest, a new uptrend is starting to form.
Levels to watch: $25
Keep your long term vision,
Philip (BasicTrading)

SPX POSSIBLE RECOVERY UP TO 7000-7500first quarter wasn't bright for spx. but it can recover at moderate phase.

Quantum's BAC Ultimate Weekly OutlookBAC (Bank of America Corporation) - Sector: Financials (Banking)
Sentiment: Bearish. Put volume rises, RSI 45 weakens, X posts note banking fears from tariffs/economic uncertainty.
Tariff Impact: Moderate. Tariffs may slow growth, impacting loans, but domestic focus softens the blow. Sentiment drives more than fundamentals.
News/Catalysts: Banking sentiment shifts on X. Consumer Credit (April 8) could signal credit trends.
Technical Setup:
Weekly Chart: HVN above as resistance, weekly low as support. Downtrend (8-week EMA < 13-week < 48-week). RSI 45 (neutral, fading), MACD below signal (negative histogram widening), Bollinger Bands near lower band, Donchian Channels below midline, Williams %R -68 (nearing oversold).
One-Hour Chart: Support below, resistance near highs, weekly alignment. RSI 42, MACD below signal (negative histogram growing), Bollinger Bands at lower band, Donchian Channels below midline, Williams %R -74 (close to oversold).
10-Minute Chart: Bearish breakdown, 8/13/48 EMAs down, RSI 42 weakening, MACD flat near zero.
Options Data:
GEX: Bearish—pinning below close, dealers hedge puts to resist upside.
DEX: Bearish—put delta leads, selling bias.
IV: Moderate—slightly above norm (e.g., 25–30% vs. 20–25%), uncertainty raising prices. Supports GEX pinning, boosts DEX bearish bias.
OI: Put-heavy—high OI at lower strikes, capping downside.
Sympathy Plays:
JPM (JPMorgan Chase): Moves in sync—rises if BAC takes off, falls if BAC dumps.
C (Citigroup): Correlates via banking—gains with BAC rallies, drops with sell-offs.
Opposite Mover: BAC dumps → defensive stocks like JNJ may rally; BAC rallies → JPM/C surge.
Sector Positioning with RRG:
Sector: Financials (Banking).
RRG Position: Weakening Quadrant. BAC’s economic sensitivity fades vs. XLF as tariffs/rates weigh.
Targets: Bullish +3% (hourly resistance); Bearish -5.1% (weekly support).
Trade Idea: Weekly put (exp. April 11) on 10-min breakdown, target support, stop above close.

USD Bear is here: Important Analysis on FX Pairs, Stock MarketIn this video I got over some important outlooks on the EUR/USD, GBP/USD and USD/JPY along with outlook on the stock market.
The U.S. Dollar has been getting absolutely crushed along with the stock market which usually has the opposite effect. Considering we may be into a stagflation scenario, this is not surprising.
Tariffs have spiked volatility and puts the Federal Reserve in a very tight spot of Interest Rate Policy. Interesting times ahead to say the least.
From a pure technical analysis point of view, the USD may be set for much further losses as monthly patterns suggest a big move may be on the horizon. Will be keeping a very close eye on these as we move forward in these stormy waters of the U.S. economy.
As always, Good Luck & Trade Safe.

3-MONTH THE SQUID GAME II 'JUBILEE'. WHAT IS NOW & WHAT IS NEXTIt's gone three months or so... (Duh..? WTF.. 3 months, really? 😸😸😸) since "The Squid Game" Season II has been released on December 26, 2024.
Nearly month later comrade Trump entered The White House (again).
Still, everyone was on a rush, chatting endless "Blah-Blah-Blah", "I-crypto-czar", "crypto-capital-of-the-world", "we-robot", "mambo-jumbo", "super-duper", AI, VR and so on hyped bullsh#t.
Here's a short educational breakdown, what we think about all of that, at our beloved @PandorraResearch Team.
Trading can easily resemble gambling when approached without discipline, strategy, or proper risk management. Here are key reasons to avoid gambling-like trading behaviors, supported by real-world examples:
1. Lack of Strategy and Emotional Decision-Making
Trading becomes gambling when decisions are based on emotions, intuition, or market hype rather than thorough analysis. For instance, Geraldine lost £15,000 on a spread-betting platform after attending a workshop that taught ineffective strategies. She believed the platform profited from her losses, highlighting how impulsive, uneducated decisions can lead to significant financial harm. Similarly, traders who overtrade or ignore risk management often experience devastating losses, as they rely on luck rather than a structured plan.
2. Overleveraging and One-Sided Bets
Overleveraging—opening excessively large positions—is a common gambling behavior in trading. This approach increases stress and the likelihood of substantial losses. A trader who lost $400,000 on a single Robinhood bet exemplifies this. He overinvested in a call option, hoping for a quick profit, but the trade turned against him, wiping out nearly all his capital. Opening one-sided bets or adding to losing positions further compounds risks, as traders attempt to recover losses through increasingly risky moves.
3. Ignoring Stop Losses and Risk Management
Failing to set stop losses or refusing to exit losing trades is another form of gambling. Traders who cling to their biases and avoid cutting losses often face irreversible damage to their portfolios. For example, many traders refuse to take stop losses, leading to catastrophic losses that erode their confidence and capital. This behavior mirrors the destructive cycle of gambling addiction, where individuals chase losses in hopes of a turnaround.
4. Psychological and Financial Consequences
Gambling-like trading can lead to severe psychological and financial consequences. Harry, a trader with a gambling addiction, repeatedly lost money despite asking his trading platform to restrict his account. His inability to control his trading behavior highlights the addictive nature of high-risk trading and its potential to ruin lives. Similarly, excessive gambling has been linked to increased debt, bankruptcy, and mental health issues, such as anxiety and depression.
5. Long-Term Sustainability
Smart trading focuses on steady gains and minimal losses, whereas gambling relies on luck and high-risk bets. Traders who chase big wins often lose their profits in subsequent trades, perpetuating a cycle of losses. Studies show that frequent trading, driven by overconfidence or problem gambling, reduces investment returns and increases financial instability.
In conclusion, avoiding gambling-like trading requires discipline, education, and a well-defined strategy. Real-world examples demonstrate the dangers of emotional decision-making, overleveraging, and ignoring risk management. By adopting a structured approach and prioritizing long-term sustainability, traders can mitigate risks and avoid the pitfalls of gambling.
--
Best 'squid' wishes,
@PandorraResearch Team

Expand Energy (EXE) – Fueling Growth in the LNG BoomCompany Overview:
Expand Energy NASDAQ:EXE is strategically positioned near the Gulf Coast, enabling it to capitalize on rising global LNG demand with a disciplined growth strategy.
Key Catalysts:
$2.7 Billion Capital Plan (2025) 💰
$500M for debt reduction & share buybacks, improving financial flexibility.
Balances growth investments with shareholder returns.
Production Expansion 📈
2024: 6.41 Bcfe/d
2025: 7.1 Bcfe/d 🚀
2026: 7.5 Bcfe/d 🌍
Scalable drilling & infrastructure investments enhance efficiency.
Strategic LNG Market Positioning ⚡
Located near key export hubs, maximizing access to high-demand markets.
Flexible capacity investments ensure adaptability to pricing trends.
Investment Outlook:
✅ Bullish Above: $95.00-$96.00
🚀 Upside Target: $140.00-$145.00
📈 Growth Drivers: LNG market demand, financial discipline, and production scalability.
🔥 Expand Energy – Driving the Next Wave of LNG Growth. #EXE #Energy #LNG

Wall Street vs GoldZilla. The End of 'Irrational Exuberance' Era"Irrational exuberance" is the phrase used by the then-Federal Reserve Board chairman, Alan Greenspan, in a speech given at the American Enterprise Institute during the dot-com bubble of the 1990s. The phrase was interpreted as a warning that the stock market might be overvalued.
Origin
Greenspan's comment was made during a televised speech on December 5, 1996 (emphasis added in excerpt)
Clearly, sustained low inflation implies less uncertainty about the future, and lower risk premiums imply higher prices of stocks and other earning assets. We can see that in the inverse relationship exhibited by price/earnings ratios and the rate of inflation in the past. But how do we know when irrational exuberance has unduly escalated asset values, which then become subject to unexpected and prolonged contractions as they have in Japan over the past decade?
Greenspan wrote in his 2008 book that the phrase occurred to him in the bathtub while he was writing a speech.
The irony of the phrase and its aftermath lies in Greenspan's widely held reputation as the most artful practitioner of Fedspeak, often known as Greenspeak, in the modern televised era. The speech coincided with the rise of dedicated financial TV channels around the world that would broadcast his comments live, such as CNBC. Greenspan's idea was to obfuscate his true opinion in long complex sentences with obscure words so as to intentionally mute any strong market response.
The phrase was also used by Yale professor Robert J. Shiller, who was reportedly Greenspan's source for the phrase. Shiller used it as the title of his book, Irrational Exuberance, first published in 2000, where Shiller states:
Irrational exuberance is the psychological basis of a speculative bubble. I define a speculative bubble as a situation in which news of price increases spurs investor enthusiasm, which spreads by psychological contagion from person to person, in the process amplifying stories that might justify the price increases, and bringing in a larger and larger class of investors who, despite doubts about the real value of an investment, are drawn to it partly by envy of others' successes and partly through a gamblers' excitement.
The main technical graph represents a value of S&P500 Index in Gold troy ounces (current value 1.81 at time of writing this article), indicates that effusive Bull stock market goes collapsing.
--
Best wishes,
Your Beloved @PandorraResearch Team 😎
