S&P Hits All-Time Highs: Reversal Incoming?The S&P has hit an all-time high, breaking previous records. However, the chart suggests a potential reversal as it struggles to break the resistance at the 0.5 Fibonacci level ($6,019.68). Currently, the S&P is holding at the support level of $5,862.46. To maintain its bullish momentum, it must stay above this support. If it fails, the next support level is $5,772.72. A breakdown below these levels could trigger a broader market decline.
This analysis is for educational purposes, and I hope the TradingView moderators respect that. My goal is to educate and build a strong community, providing transparent insights into the stock market. If you find this content valuable, please hit the like button. Feel free to ask any questions in the comments I'm happy to help. Thank you!
Stockmarketanalysis

FinNifty Support and Resistance Levels For 12th Nov 2024I’ve created a chart highlighting the key support and resistance levels for #finnifty, designed to help traders make informed decisions.
These levels provide critical insights for understanding potential price movements, enabling traders to identify ideal entry and exit points.
Use these levels to gain a clearer perspective on Sensex trends and optimize your trades with greater confidence.
Remember, these levels serve as guidance, so always combine them with your own analysis and risk management.

Sensex Support and Resistance Levels For 12th Nov 2024I’ve created a chart highlighting the key support and resistance levels for #sensex, designed to help traders make informed decisions.
These levels provide critical insights for understanding potential price movements, enabling traders to identify ideal entry and exit points.
Use these levels to gain a clearer perspective on Sensex trends and optimize your trades with greater confidence.
Remember, these levels serve as guidance, so always combine them with your own analysis and risk management.

Nifty Support and Resistance Levels For 12th Nov 2024I’ve created a chart highlighting the key support and resistance levels for #Nifty, designed to help traders make informed decisions.
These levels provide critical insights for understanding potential price movements, enabling traders to identify ideal entry and exit points.
Use these levels to gain a clearer perspective on Sensex trends and optimize your trades with greater confidence.
Remember, these levels serve as guidance, so always combine them with your own analysis and risk management.

BankNifty Support and Resistance Levels For 12th Nov 2024I’ve created a chart highlighting the key support and resistance levels for #BankNifty, designed to help traders make informed decisions.
These levels provide critical insights for understanding potential price movements, enabling traders to identify ideal entry and exit points.
Use these levels to gain a clearer perspective on Sensex trends and optimize your trades with greater confidence.
Remember, these levels serve as guidance, so always combine them with your own analysis and risk management.

Victoria's Secret (VSCO) AnalysisCompany Overview: Victoria's Secret NYSE:VSCO is undergoing a strategic transformation aimed at revitalizing its brand and capturing a larger share of the lingerie and intimate apparel market. The company is leveraging new partnerships, focusing on digital expansion, and embracing inclusivity to appeal to a broader customer base.
Key Developments:
Partnership with Amazon:
Victoria's Secret's collaboration with Amazon represents a significant move to expand its digital footprint. By listing products on one of the world's largest e-commerce platforms, the company gains access to Amazon's vast customer base, potentially driving substantial online sales growth.
This partnership enables Victoria's Secret to reach new customers who prefer online shopping, aligning with broader retail trends where e-commerce continues to take a larger share of sales.
Brand Transformation and Inclusivity:
The company is undergoing a brand overhaul, focusing on inclusivity and diversity. By showcasing a wider range of body types and promoting a more inclusive brand image, Victoria's Secret aims to reconnect with a broader audience, particularly Gen Z and Millennial consumers who value representation and authenticity.
This strategic shift is expected to enhance the brand's market appeal, improve customer perception, and potentially boost sales and market share.
International Expansion:
Victoria's Secret is targeting high-growth international markets such as China and India, where demand for premium and luxury lingerie is on the rise. The expansion into these regions is a strategic effort to tap into new revenue streams and capitalize on growing consumer purchasing power.
Establishing a stronger presence in these markets positions the company to benefit from increasing global demand for premium intimate apparel.
New Leadership Driving Transformation:
With new industry veterans in key leadership roles, including a CEO experienced in retail transformation, Victoria's Secret is set for accelerated growth. The revamped leadership team is focusing on strategic initiatives aimed at revitalizing the brand, enhancing customer experience, and driving financial performance.
Investment Outlook: Bullish Outlook: We are bullish on VSCO above the $27.00-$28.00 range, as the company's strategic initiatives and renewed focus on inclusivity are expected to drive growth and market expansion. Upside Potential: Our price target for Victoria's Secret is set at $45.00-$46.00, reflecting potential gains from the Amazon partnership, brand transformation efforts, and international expansion strategy.
🚀 VSCO—Reinventing the Brand and Expanding Horizons! #RetailTransformation #EcommerceGrowth #InclusivityInFashion

CALT.N0000 - Weekly Chart UpdateThe Fibonacci retracement levels are plotted based on the all-time high and low values, providing insight into potential support and resistance zones.
The key Fibonacci levels observed on this chart are :
0.236 Level: Around 73.2, which could act as a significant resistance if the stock starts moving up from the current levels.
0.382 Level: Around 60.8, another potential resistance.
0.5 Level: Around 50.7, often considered a pivotal level in retracement analysis.
0.618 Level (Golden Pocket): Around 40.6, which is a critical level and can act as strong support if the price approaches it from above.
Current Price and 21-Week Moving Average (Green Line) :
The price is currently around 43.8, slightly above the 0.618 Fibonacci level (40.6), suggesting the price is in a critical area.
The 21-week moving average (green line) is also near the current price level. This moving average could act as dynamic support if the price remains above it. If it breaks below, it may signal further downside risk.
Descending Trendline Resistance :
The chart shows a strong descending trendline that has been respected multiple times as resistance. The stock would need to break above this trendline to confirm a reversal or more significant bullish momentum.
Support and Resistance Levels :
Immediate Resistance: Around 47.1 (Weekly Mid Resistance) and 53 (Weekly Resistance).
Support Levels: The 0.618 Fibonacci level at 40.6 and the 0.786 level around 26.3 are key support areas. If the price falls below 40.6, the next significant support zone would be around 26.3.
Relative Strength Index (RSI) :
The RSI appears to be in a lower range, which could imply oversold conditions on the weekly chart. This may provide some support for the price, but a confirmed upward trend would still depend on breaking key resistance levels.
Summary:
The stock is in a consolidation phase near critical Fibonacci and moving average levels.
A break above 47.1 and ultimately above the descending trendline could signal the beginning of a potential reversal.
However, if the price falls below the 0.618 level (40.6), there may be a further downside risk, with 26.3 acting as the next major support.
The 21-week MA and the 0.618 level are crucial for maintaining the current consolidation or an upward move, so keeping an eye on these levels is essential.
Disclaimer : The information and analysis provided in this publication are for educational purposes only and should not be construed as financial advice or recommendations to buy, sell, or hold any securities. The author and TradingView are not responsible for any investment decisions made based on the content presented herein. Always consult a financial professional before making any investment decisions.

Palantir Bullish Long-Term PlayPalantir shares rose to a yearly high near $33 in the evening trading session on Friday, September 6, after announcement Palantir joins the S&P 500 index.
Palantir was one of the strongest contenders for inclusion in the broad market S&P500 index.
This inclusion, as well as Dell (DELL), comes after tech companies Super Micro (SMCI) and Crowdstrike (CRWD) also joined the index earlier this year.
Technical 1-month graph indicates on Reversed Head-and-Shoulders structure in development.
Potentially it can bring Palantir stocks, up to $100 per share over the next several years.

Sensex Support and Resistance Levels for 6th Nov 2024I’ve created a chart highlighting the key support and resistance levels for #Sensex, designed to help traders make informed decisions.
These levels provide critical insights for understanding potential price movements, enabling traders to identify ideal entry and exit points.
Use these levels to gain a clearer perspective on Sensex trends and optimize your trades with greater confidence.
Remember, these levels serve as guidance, so always combine them with your own analysis and risk management.

BankNiftySupport and Resistance Levels for 6th Nov 2024I’ve created a chart highlighting the key support and resistance levels for #banknifty, designed to help traders make informed decisions.
These levels provide critical insights for understanding potential price movements, enabling traders to identify ideal entry and exit points.
Use these levels to gain a clearer perspective on Sensex trends and optimize your trades with greater confidence.
Remember, these levels serve as guidance, so always combine them with your own analysis and risk management.

Nu Holdings (NU) AnalysisCompany Overview: Nu Holdings NYSE:NU , a leading digital bank in Latin America, is rapidly expanding its footprint across the region, leveraging innovative fintech solutions to drive growth in underbanked markets. With a mission to offer simple and accessible financial services, Nu Holdings continues to strengthen its presence, especially in key markets like Mexico and Colombia.
Key Developments:
Expansion in Latin America: Nu has successfully launched checking accounts in Mexico and Colombia, showcasing strong customer demand. The company has attracted $3.3 billion in deposits in Mexico and $220 million in Colombia, underscoring its ability to effectively penetrate new markets. This expansion opens up significant growth potential for Nu, as the digital banking revolution in Latin America continues to gather momentum.
Strong Customer Engagement: Nu's active user base continues to grow, with an impressive record-high activity rate of 83%, marking the 11th consecutive increase in user engagement. This high level of customer activity demonstrates Nu's ability to retain and engage its users, a crucial factor for long-term profitability in the fintech sector.
Accelerating Revenue & Profitability: In addition to customer growth, Nu has shown consistent acceleration in revenue and profitability, solidifying its position as a top contender in the fintech space. The company's unique combination of digital banking services, credit offerings, and low-cost structure sets it apart from traditional banks and other fintech competitors.
Investment Outlook: Bullish Outlook: We are bullish on NU above the $13.50-$14.00 range, driven by its successful market expansion, strong customer engagement, and accelerating financial performance. Upside Potential: Our price target for Nu Holdings is set at $23.00-$24.00, reflecting its potential for continued regional growth and increasing profitability as it scales operations across Latin America.
🚀 NU—Transforming Banking Across Latin America! #FintechGrowth #LatAmBanking #DigitalRevolution

Coinbase (COIN) AnalysisCompany Overview: Coinbase NASDAQ:COIN is one of the largest and most recognized cryptocurrency exchanges globally, offering a wide range of services, from retail trading to institutional crypto solutions. The company has focused on strengthening its position in the crypto ecosystem by targeting both retail and institutional investors.
Key Developments:
Institutional Adoption & BlackRock Partnership: Coinbase’s strategic partnership with BlackRock allows Aladdin clients to access cryptocurrency trading and custody services via Coinbase Prime, which caters to institutional investors. This partnership has the potential to drive significant institutional capital into the platform, thereby increasing transaction volumes and boosting revenue.
Diversification Efforts: Coinbase has successfully reduced its dependence on trading fees by growing its subscription and services revenue, which saw a 34% year-over-year increase in Q2 2023. This revenue diversification helps mitigate the impact of the volatile trading environment often seen in the cryptocurrency space.
Regulatory Compliance: With regulatory scrutiny tightening across the crypto industry, Coinbase’s strong focus on compliance gives it a competitive advantage. As regulatory hurdles increase, the company is likely to capture market share from less compliant competitors, positioning itself as a trusted platform in an evolving regulatory landscape.
Product Innovation: Coinbase continues to innovate with new offerings like the Ethereum layer-2 network and enhanced staking services. These product launches not only enhance Coinbase’s competitive edge but also position the company well for future growth in decentralized finance (DeFi) and staking markets.
Investment Outlook: Bullish Outlook: We are bullish on COIN above the $180.00-$185.00 range, driven by institutional adoption, diversification of revenue streams, and strong regulatory positioning. Upside Potential: Our price target for Coinbase is set at $370.00-$375.00, reflecting its potential to capture more institutional market share and sustain growth through innovative product offerings.
🚀 COIN—Leading the Way in Institutional Crypto Adoption! #CryptoInnovation #InstitutionalAdoption #CryptoCompliance

#Finnifty LevelsI’ve created a chart highlighting the key support and resistance levels for Finnifty, designed to help traders make informed decisions. These levels provide critical insights for understanding potential price movements, enabling traders to identify ideal entry and exit points.
Use these levels to gain a clearer perspective on Finnifty’s trends and optimize your trades with greater confidence. Remember, these levels serve as guidance, so always combine them with your own analysis and risk management.

Argenx (ARGX) AnalysisCompany Overview: Argenx NASDAQ:ARGX is making significant strides in the field of autoimmune treatments, especially following the FDA approval of VYVGART Hytrulo for chronic inflammatory demyelinating polyneuropathy (CIDP) on June 21st. This approval not only enhances Argenx's product portfolio but also opens up new revenue channels for the company.
Key Developments:
Strong Revenue Generation: Argenx demonstrates a robust global presence with revenue streams across various regions:
U.S.: $407 million
Japan: $20 million
EMEA: $35 million
China: $14 million
This diversified revenue generation helps mitigate regional risks and showcases the company’s ability to penetrate multiple markets effectively.
Upcoming Trials: The company plans to launch four new registration trials by the end of 2024, further expanding its therapeutic offerings. This proactive approach to research and development positions Argenx for future growth and diversification in its product line.
Strategic Collaboration: Argenx's collaboration with Monarch is aimed at enhancing operational efficiency and customer service. This partnership is expected to boost market penetration and strengthen the company's competitive edge.
Investment Outlook: Bullish Outlook: We are bullish on ARGX above the $484.00-$489.00 range, driven by its recent FDA approval, diverse revenue streams, and plans for further clinical expansion. Upside Potential: Our target for Argenx is set at $740.00-$750.00, supported by the company’s strong market presence and growth initiatives.
🚀 ARGX—Pioneering the Future of Autoimmune Treatments. #Biotech #AutoimmuneTherapy #MarketGrowth

Gold topped $2500 per ounce psychological high. Here's whyThe price of spot gold climbed $2500 per ounce to a new record high, by mid-August, 2024.
The Yellow metal has rallied 21.5% this year, and this is the best result in this time against Top 4 american indices - Dow Jones Industrial Avg (DJIA), SP500 (SPX), Small cap Russell2000 (RUT) and full of tech stocks Nasdaq-100 indices (NDX).
Gold jumped as much as 1.8% on Friday, as investors inflation expectations are still extremely high, and still there're no convincing sign that major Russia - Ukraine conflict as well as Israel - Arab conflict are near to be settled.
Even recent weakness in US labor market and new-home starts fall to the lowest level since 2020 give no power to Federal Reserve (US Central Bank) to cut an interest rate even to 1/4 per cent.
Last 2 years, a lot of banksters forecasted that Fed will cut interest rate.
In fact - it still didn't. Just blah-blah-blah and super-duper AI hype, which based on nothing.
In technical terms, spot Gold breaks its $2500 psychological high, ready to go further, up to 3k.

U.S. Aggregate T-Bond Market. Fears & Greed AwakeningStocks heavily sold off Thursday (again), with the Dow Jones Industrial Average (DJIA) tumbling nearly 500 points, as investors’ fears over a recession surfaced.
Some fresh data stoked fears over a possible recession and the notion that the Federal Reserve could be too late to start cutting interest rates. Initial jobless claims rose the most since August 2023. And the ISM manufacturing index, a barometer of factory activity in the U.S., came in at 46.8%, worse than expected and a signal of economic contraction.
After these releases, the 10-year Treasury yield dropped below 4% for the first time since February.
These weak data releases come a day after central bank policymakers chose to keep rates at the highest levels in two decades, when Fed Chair Jerome Powell gave investors some hope by signaling a September rate cut could be on the table.
Labor situations is on the radars also, as fresh unemployment data expected on Friday, August 2.
The main technical chart is for U.S. Core Aggregate T-Bond Market ETF (AGG), in total return format/
With 11782 total number of holdings, AGG is US bond market in miniature.
Fears & Greed Awakening.
👉 VIX and VXN are sitting closer to their important levels, 20 and 25 points respectively.
👉 VIX to 50-Day VIX SMA ratio has recently jumped above 1.40, and this is the biggest level over the past twelve months.
👉 VXN to 50-Day VXN SMA ratio has recently jumped above 1.40, and this is the biggest level over the past twelve months.
👉 Difference in 20-day stock and bond returns slumped almost to Zero.
Technical observations
👉 AGG technical graph indicates on huge developing Reversed Head-and-Shoulders, with 2-year highs breakthrough.
👉 The nearest target could be considered is multi top, around $108 mark.
👉 In mid- to long term it could be good for stock indices and markets, despite of possible turbulence and seismic activity.

Nvidia - New All Time High Is Coming!Nvidia ( NASDAQ:NVDA ) can rally another +50%:
Click chart above to see the detailed analysis👆🏻
After creating an expected correction of about -40%, Nvidia is now almost back to new all time highs, showing no signs of weakness despite the recent tech stock correction. If Nvidia creates a new all time high, it is quite likely that it will rally again, potentially all the way up to $400.
Levels to watch: $200
Keep your long term vision,
Philip (BasicTrading)

Semiconductors vs. Nasdaq: Key Indicator of Tech MomentumIntroduction:
The ratio between semiconductors NASDAQ:SMH and the Nasdaq 100 NASDAQ:QQQ serves as a key indicator of tech sector momentum and near-term risk sentiment. When SMH outperforms QQQ, it signals a "risk-on" environment, reflecting strong demand for semiconductors and overall tech sector health. Conversely, if QQQ outperforms SMH, it suggests a "risk-off" environment, pointing to concerns over weakening chip demand.
Analysis:
Risk Sentiment: The SMH-to-QQQ ratio provides insights into tech momentum. A higher SMH performance often indicates robust chip demand, a positive signal for the broader tech sector. On the other hand, when QQQ outperforms, it signals caution, possibly reflecting waning demand for semiconductors.
Bullish Outlook: Recently, the SMH-to-QQQ ratio has formed a higher low, reinforcing a bullish outlook for semiconductors. This higher low is a positive sign not just for the semiconductor industry but for the broader market as well, as semiconductors often lead market rallies.
Conclusion:
The recent bullish signal in the SMH-to-QQQ ratio suggests tech sector strength, with semiconductors likely leading the way. This is a critical metric for assessing near-term market momentum, so traders should keep a close eye on this ratio to gauge potential shifts in sentiment. What’s your take on this trend? Feel free to share your thoughts in the comments!
Charts: (Include relevant charts showing the SMH-to-QQQ ratio and the higher low formation)
#Semiconductors #Nasdaq #TechSector #SMH #QQQ #RiskOn

Nike - Catch this reversal!NYSE:NKE continues its overall uptrend despite the recent drop of -60% to the downside.
All you need in order to catch the reversal of the decade is simply one line: a support trendline. Nike is currently approaching a support trendline, which has been sending prices higher for the past 30 years. Just this fact alone makes me believe that we will see (much) higher prices on Nike over the next couple of weeks and months, but we still need bullish confirmation first!
Levels to watch: $70
Keep your long term vision,
Philip - BasicTrading

Tesla at a Crossroads: Will It Bounce to $275 or Slide to $202?Tesla’s at a make-or-break moment—are we looking at a nice correction back up to $275, or is it about to drop through the floor to $213, $208, and maybe even $202? If that $208 level doesn’t hold, we’ve got a strong 50% Fibonacci support around $203-$202—but whether it’ll catch Tesla or not is anyone’s guess.
Let’s dive into the key levels to watch and figure out if Tesla’s going to rebound or if we’re in for a deeper slide.
If you found this useful, give it a like, share your thoughts in the comments, and hit follow for more updates. Your support means a lot—after all, I need something to hold me up when Tesla can’t hold $208!
Mindbloome Trader

Bullish on NVDA: Riding the AI Wave!In trading, understanding the probabilities is crucial. By analyzing historical price movements and applying mathematical principles, I can identify high-probability setups on my charts.
This mechanical strategy allows me to make informed decisions about entering long positions on NVDA.
Why probabilities?
They help me navigate the unpredictable nature of the market, ensuring that my trades are backed by solid data rather than just intuition.
Here are some key fundamentals currently supporting a bullish bias for NVIDIA (NVDA):
- Surging Demand for AI Chips: NVIDIA is at the forefront of the AI revolution, with its chips being essential for training large language models and powering generative AI applications. The company has seen a staggering increase in demand for its GPUs, particularly the H100 chip, which has become critical for tech giants like Microsoft, Google, and Meta.
- Impressive Financial Growth: NVIDIA's stock has surged over 150% this year, significantly boosting its market capitalization. Analysts expect continued strong revenue growth, with projections estimating a 75% increase in third-quarter revenue to approximately $31.69 billion. This financial momentum reflects the robust demand for its AI-related products.
- Strategic Positioning in Data Centers: As companies invest heavily in AI infrastructure, NVIDIA's GPUs are becoming indispensable for data centers. The projected global capital expenditure on data centers is expected to rise dramatically, benefiting NVIDIA as it supplies the necessary hardware.
- Innovative Developments: NVIDIA is actively developing new AI processors to comply with U.S. export regulations, ensuring it maintains a foothold in critical markets like China. This adaptability positions NVIDIA favorably against rising competition from companies like AMD and Huawei.
- Market Leadership: With its early investments in AI technology and continuous innovation, NVIDIA has established itself as a leader in the AI chip market. This dominance allows it to command premium prices and maintain high profit margins, which were reported at 79.1% in the first quarter of 2024.
These factors collectively create a strong foundation for a bullish outlook on NVIDIA as it continues to capitalize on the growing demand for artificial intelligence technologies.
Join me in this journey towards maximizing our potential gains as we ride the bullish wave!
12M:
2W:
1H:

NDX v SPX. Nerd America comes closer to the Nerd sunsetThe main graph represents NDX v SPX ratio.
Like 25 years ago, new super duper brave generation of Nerd America comes closer to the next one Nerd sunset.

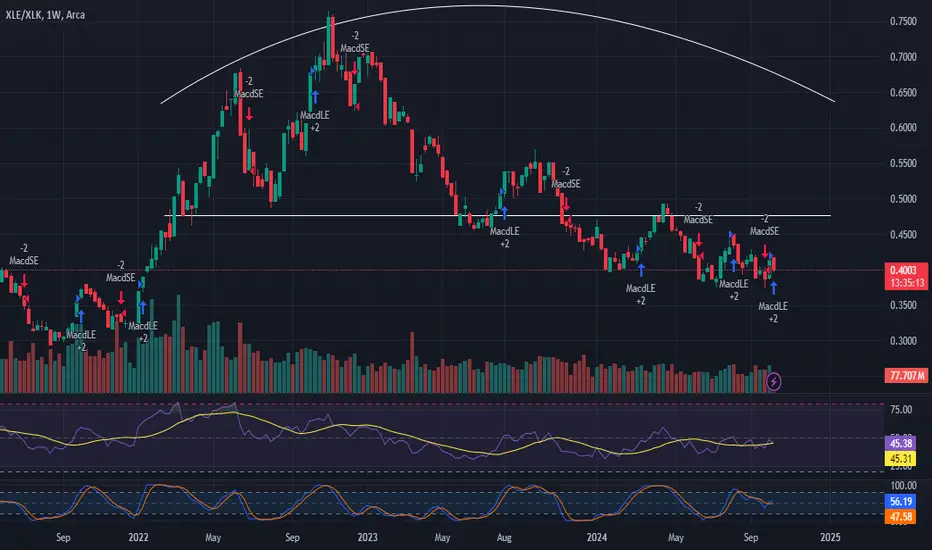
Energy vs Tech : Analyzing Sector Performance and Market TrendsIntroduction:
The comparison between the energy sector (XLE) and the technology sector (XLK) provides valuable insights into current market trends. As the largest sector in the S&P 500, XLK often serves as a barometer for broader market strength. Conversely, when XLE outperforms XLK, it may signal caution, as XLE's smaller size limits its impact on the overall index.
Analysis:
Sector Comparison: XLK's performance is crucial in indicating market health. When XLK outperforms, it generally suggests a robust market outlook. On the other hand, if XLE starts to outperform XLK, this may indicate potential weakness in broader market conditions.
Inflationary Pressures: This ratio between XLE and XLK also reflects inflationary trends. A strong performance from XLE relative to XLK may signal rising inflationary pressures, which investors should closely monitor.
Charting the Pattern: The energy sector has formed an inverted saucer pattern. A breakout from this pattern could signify a positive upward trend and possibly a return to inflation.
Trade Setup:
Entry Point: Monitor the XLE/XLK ratio for a potential breakout confirmation.
Stop Loss: Consider setting a stop loss below the recent support level identified on the chart.
Target Price: Set a target based on the measured move from the breakout point of the inverted saucer pattern.
Conclusion:
The comparative performance of XLE and XLK offers essential insights into market dynamics and inflationary pressures. Traders should keep an eye on the potential breakout from the inverted saucer pattern in XLE, as it may indicate a shift in market trends. What are your thoughts on this analysis? Share your insights in the comments!
Charts: (Include relevant charts showing the XLE/XLK ratio and the inverted saucer pattern)
#Energy #Technology #MarketTrends #Inflation #XLE #XLK