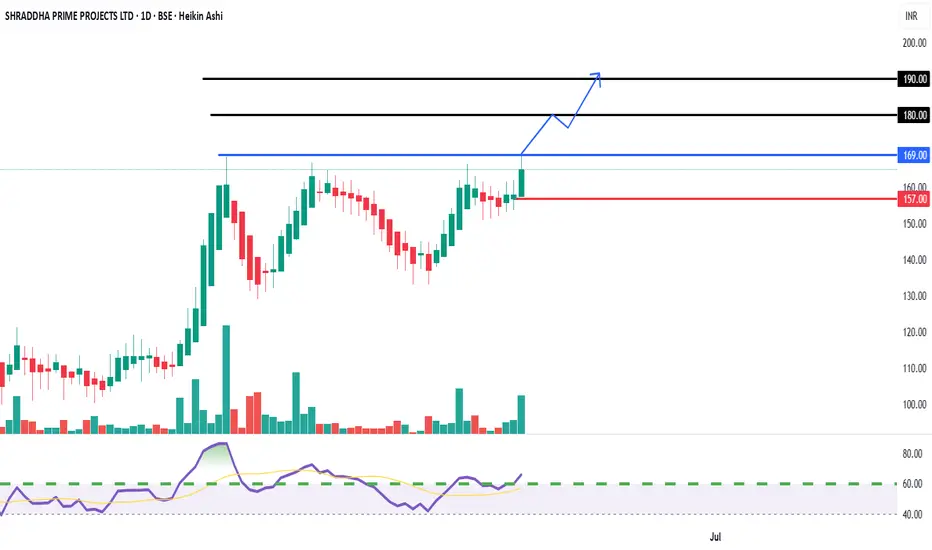
On the Cusp of a Breakout - Short-Term Buy OpportunityEntry Price:
Aggressive Entry: Around CMP (₹165.00) with a strict stop loss, anticipating the breakout.
Conservative Entry: On a confirmed breakout and close above ₹170 on a daily basis.
Target Price 1 (T1): ₹180
Target Price 2 (T2): ₹190
Stop Loss (SL): ₹157 (Closing basis below immediate support)
DISCLAIMER
This report is prepared for informational purposes only and is not intended as a solicitation or an offer to buy or sell any securities. The information contained herein is based on technical analysis and publicly available data, which are believed to be reliable, but no guarantee is made as to their accuracy or completeness. Investing in equities involves risks, and investors should conduct their own due diligence and consult with a financial advisor before making any investment decisions. Past performance is not indicative of future results.
Stockmarketindia
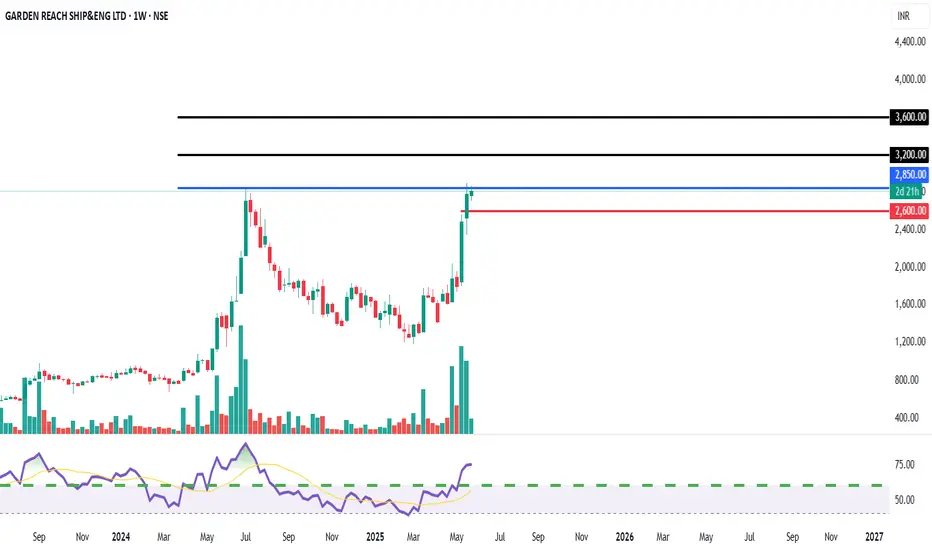
GARDEN REACH SHIPBUILDERS: Breakout Potential - Watch for EntryEntry Price:
Aggressive / Risk-Takers: Await a clear weekly close above ₹2,850, with sustained high volumes. Entry around ₹2,850-₹2,900.
Target Price 1 (T1): ₹3,200 (Based on previous highs and extension)
Target Price 2 (T2): ₹3,600 (Based on Fibonacci extensions and chart patterns)
Stop Loss (SL): ₹2,600 (Closing basis below immediate support, previous resistance)
DISCLAIMER
This report is prepared for informational purposes only and is not intended as a solicitation or an offer to buy or sell any securities. The information contained herein is based on technical analysis and publicly available data, which are believed to be reliable, but no guarantee is made as to their accuracy or completeness. Investing in equities involves risks, and investors should conduct their own due diligence and consult with a financial advisor before making any investment decisions. Past performance is not indicative of future results.
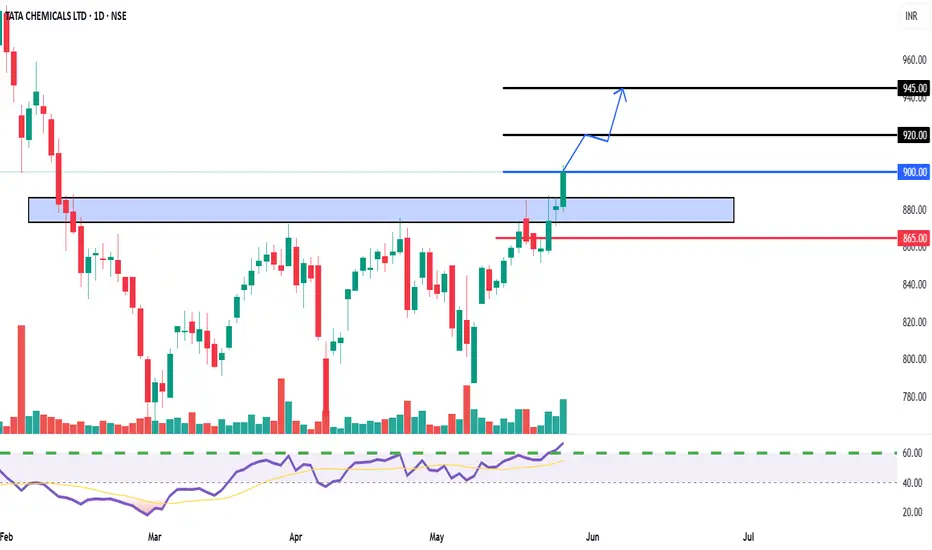
TATA CHEMICALS Breakout Confirmed - Buy on MomentumEntry Price:
Aggressive Entry: Around CMP (₹900-₹905)
Conservative Entry: On a retest of the breakout zone (₹875-₹885), if the opportunity arises.
Target Price 1 (T1): ₹920
Target Price 2 (T2): ₹945
Stop Loss (SL): ₹865 (Closing basis below the breakout zone and previous support)
Cautiously Bullish - Approaching Long-Term Resistance.Entry Zone: We recommend initiating a BUY position in TCGSRAAC only upon a decisive and sustained breakout above the major descending trendline (around ₹115 - ₹118). A daily close above this level with good volumes would be a strong confirmation.
Target 1 (T1): ₹125
Target 2 (T2): ₹132
Target 3 (T3): ₹140+ (If momentum sustains significantly post-breakout)
Stop Loss (SL): ₹105 (Strictly on a daily closing basis, for a breakout entry)
Rationale:
Long-Term Resistance Test: The stock is currently testing a significant descending trendline that has been acting as a major resistance for over several months. A successful breakout would signal a substantial shift in the long-term trend.
Support from Accumulation Zone: The stock has recently bounced from a strong demand zone around ₹80 - ₹88 (highlighted in blue), indicating underlying buying interest.
RSI Rising: The Relative Strength Index (RSI) has recently crossed above the 50-mark and is trending upwards, suggesting a buildup of bullish momentum as the price approaches resistance.
Volume Activity: While recent volumes are moderate, a significant surge in volume on the day of the potential breakout would be crucial for confirmation.
Risk-Reward: A breakout offers a good risk-reward setup for short-term traders, targeting the next set of resistance levels.
Key Risk: Failure to break above the major descending trendline could lead to a reversal and a fall back towards the ₹95 - ₹100 levels. A sustained daily close below ₹105 would invalidate the bullish breakout attempt.
Disclaimer: This report is for informational purposes only and does not constitute financial advice. Investors should conduct their own due diligence and consult with a qualified financial advisor before making any investment decisions. Equity investments are subject to market risks.
For Education Purposes Only

Confirmed Breakout and Retest of Channel Resistance.Entry Zone: We recommend accumulating Rolex Rings Ltd. in the zone of ₹1,460 - ₹1,500. This area represents a crucial retest of the broken descending channel's resistance, now acting as strong support.
Target 1 (T1): ₹1,580
Target 2 (T2): ₹1,650
Target 3 (T3): ₹1,750 (Extended target if momentum remains strong)
Stop Loss (SL): ₹1,400 (Strictly on a daily closing basis)
Rationale:
Clear Channel Breakout: The stock has executed a textbook breakout from a well-defined multi-month descending channel. This indicates a significant shift in the underlying trend from bearish to bullish.
Successful Retest: Post-breakout, the price has pulled back to retest the upper boundary of the channel, which is a classic technical confirmation of a valid breakout. The retest appears to be holding, suggesting the former resistance has turned into reliable support.
Volume Confirmation: The initial breakout was supported by decent volumes, and the current consolidation/retest phase is occurring on relatively lower volumes, which is typical before the next leg up.
RSI Bullish Momentum: The Relative Strength Index (RSI) is maintaining its position above the 50-mark and shows bullish bias, supporting the upward price momentum.
Favorable Risk-Reward: The current entry point offers an attractive risk-reward profile for a short-term trade, with the potential upside significantly outweighing the downside risk defined by the stop-loss.
Key Risk: A decisive daily closing below ₹1,400 would invalidate the bullish breakout and retest pattern, suggesting a false breakout or a resumption of the downtrend. Strict adherence to the stop-loss is advised.
Disclaimer : This report is for informational purposes only and does not constitute financial advice. Investors should conduct their own due diligence and consult with a qualified financial advisor before making any investment decisions. Equity investments are subject to market risks.
For Education purposes only

Potential Reversal and Breakout Retest.Entry Zone: We recommend initiating a BUY position in AIA Engineering Ltd. around the current levels, ideally between ₹3,280 - ₹3,320. This area represents a retest of the recent trendline breakout.
Target 1 (T1): ₹3,400
Target 2 (T2): ₹3,480
Target 3 (T3): ₹3,580 (If momentum sustains above T2)
Stop Loss (SL): ₹3,200 (Strictly on a closing basis)
Trendline Breakout & Retest: The stock recently broke out of a significant descending trendline, indicating a potential end to the corrective phase. The current price action appears to be a successful retest of this broken trendline, which often acts as new support, presenting a lower-risk entry point.
Volume Confirmation: The initial breakout was accompanied by higher volumes, and while the retest phase has lower volumes (typical), sustained buying interest on subsequent upward moves would confirm strength.
RSI Bounce from Support: The Relative Strength Index (RSI) is showing a bounce from the 40-50 zone, indicating that momentum is regaining strength and potentially moving towards the bullish territory.
Positive Structure: The overall chart structure suggests that the stock is attempting to reverse its short-term downtrend and potentially resume its broader upward trajectory.
Favorable Risk-Reward: The current setup offers a reasonable risk-to-reward ratio for a short-term trade, with potential for upside gains outweighing the defined risk.
Key Risk: A close below ₹3,200 would invalidate the bullish retest scenario and could lead to further downside, bringing the previous lows into play. Traders should adhere strictly to the stop-loss.

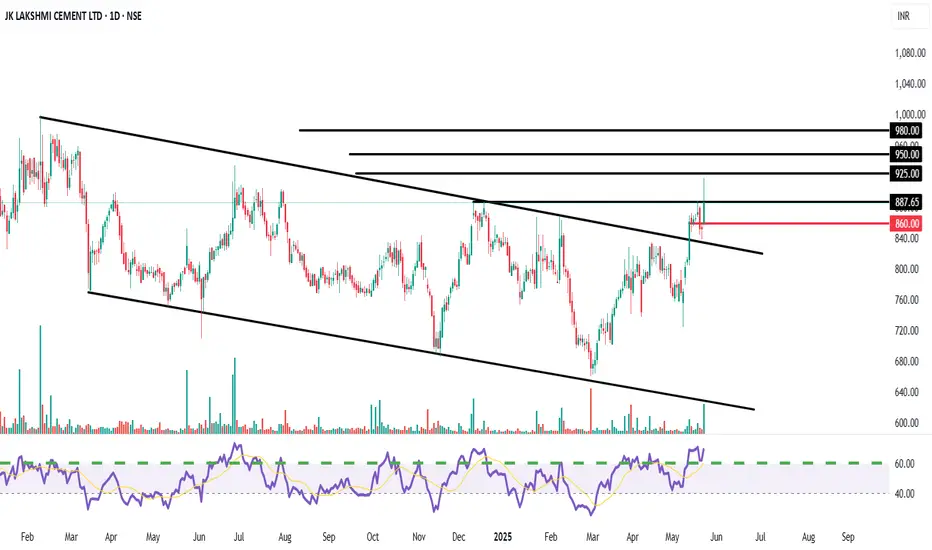
Potential Breakout from a Symmetrical Triangl Descending ChannelEntry Zone: We recommend initiating a BUY position in JK Lakshmi Cement around the current levels, ideally between ₹880 - ₹890. This considers the strong closing above the resistance trendline.
Target 1 (T1): ₹925
Target 2 (T2): ₹950
Target 3 (T3): ₹980 (If momentum sustains above T2)
Stop Loss (SL): ₹860 (Strictly on a closing basis)
Channel Breakout: The stock has decisively broken out of a multi-month descending channel/symmetrical triangle pattern, indicating a potential strong reversal from a corrective phase. This breakout appears to be supported by a noticeable pickup in volumes.
Key Resistance Breach: The stock has also managed to close above a significant horizontal resistance level around ₹880-885, which has acted as a hurdle multiple times in the past. A sustained move above this level confirms bullish intent.
RSI Strength: The Relative Strength Index (RSI) is showing strength, trading well above the 50-mark and moving towards the overbought zone, confirming increasing buying momentum.
Positive Price Action: The overall structure suggests accumulation at lower levels, and the current breakout could initiate the next leg of the uptrend.
Favorable Risk-Reward: The setup offers a compelling risk-reward profile for a short-term trade, with significant upside potential compared to the defined stop-loss.
Key Risk: A failure to sustain above the ₹880 level or a close below the ₹860 stop-loss would invalidate the bullish view and could lead to renewed selling pressure.
CESC Ltd – Short-Term Breakout Idea|Target: ₹171.00 CMP: ₹165.70
Recommended Buy Range: ₹164.50 – ₹165.00
Target: ₹171.00 🎯
Stop Loss: ₹161.50 🛡️
Timeframe: 15 min & 1H
Risk-Reward: ~1.4:1
Type: Momentum Breakout / Swing Trade
🔍 Technical Analysis:
✅ EMA Cross (9/13) bullish crossover
✅ Price trading above EMA-26
✅ RSI at 65 – bullish, not overbought
✅ BB %B around 1.0 – strong upper band breakout
✅ Volume spike supports the move
Watch for a strong close above ₹167 to confirm momentum toward ₹171.
For Education Purposes Only

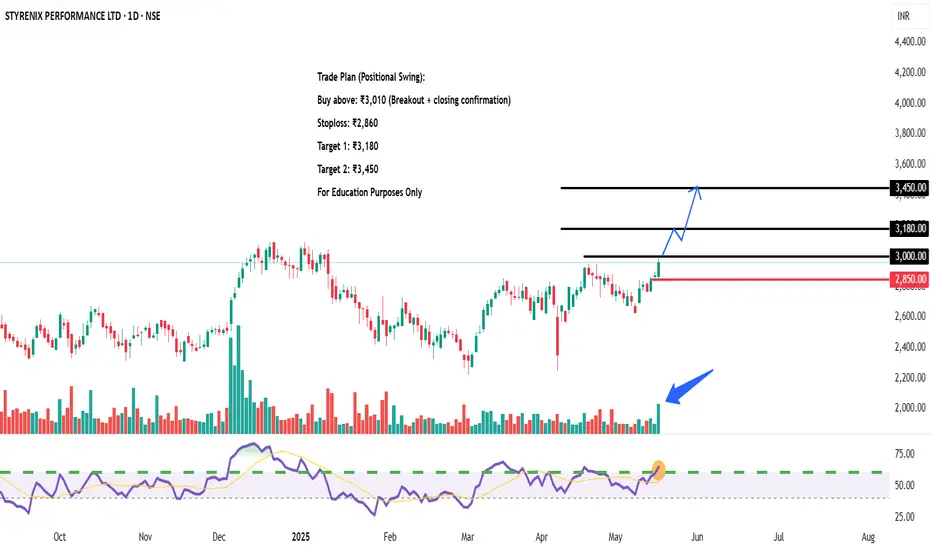
STYRENIX PERFORMANCE LTD – Near Resistance 🔍 Technical View:
Multiple BOS/CHoCH indicate structure shift
Strong low formed at ₹2,100 zone
Demand zones tested & respected between ₹2,400–₹2,600
RSI near breakout level (~70), indicating building momentum
📌 Trade Plan (Positional Swing):
Buy above: ₹3,010 (Breakout + closing confirmation)
Stoploss: ₹2,860
Target 1: ₹3,180
Target 2: ₹3,450
Sell below: ₹2,850 (If resistance holds or breakdown happens)
CENTRAL DEPO SER (I) LTD – Supply Zone Test Price has entered a major supply zone (₹1,390–₹1,440). Strong BOS (Break of Structure) confirms bullish momentum. RSI supports strength; breakout looks likely on volume surge.📌 Trade Plan (Swing/Positional):
Buy above: ₹1,445 (on breakout + closing basis)
Stoploss: ₹1,365
Target 1: ₹1,580
Target 2: ₹1,720
Sell Below (Rejection): ₹1,360 (if price gets rejected at supply)
🔍 Technical Highlights:
BOS and CHoCH indicate structure shift from bearish to bullish
Currently testing supply zone after BOS
Volume increasing with bullish candles
RSI approaching overbought — breakout likely, but confirmation needed
For Education Purposes Only

TBO TEK LTD – 19 May Trendline Resistance Test Incoming 📌 Trade Plan (Aggressive Swing Setup):
Buy above: ₹1,250 (on breakout + volume confirmation)
Stoploss: ₹1,195
Target 1: ₹1,310
Target 2: ₹1,385
Sell Below: ₹1,180 (if price rejects the trendline with high volume)
🔎 Technical Insights:
Strong volume buildup near resistance
RSI trending upwards with bullish momentum
Trendline acting as dynamic resistance since Nov 2024
For Education Purposes Only

PB Fintech (NSE: 543390) Trade Setup📈 Breakout Watch | Price retesting key pivot at ₹1,745
Momentum building with RSI > 60 and bullish structure. Ideal for intraday or short swing.
🔵 Long Entry
Buy Above: ₹1,745 (Pivot breakout confirmation on 15m/1H candle close)
Target 1: ₹1,775 (minor resistance)
Target 2: ₹1,807 (next pivot)
Target 3: ₹1,869 (final swing target)
Stoploss: ₹1,720 (below previous candle low/support zone)
✅ Volume confirmation and RSI strength supporting move
🧠 Good for breakout traders looking for momentum continuation
🔴 Short Setup (if rejection from ₹1,745)
Sell Below: ₹1,730 (on rejection + bearish candle)
Target: ₹1,682
Stoploss: ₹1,745
📊 Indicators:
RSI: 65.7 → bullish, near breakout threshold
BB% B: 0.88 → strong bullish move near upper band

MKVENTURES CAPITAL – Positional Breakout Setup📈 Buy Above: ₹1,700 (Breakout Zone)
Stoploss: ₹1,630
Target 1: ₹1,790
Target 2: ₹1,880
🔹 RSI is bullish, above 60
🔹 Strong volume build-up
🔹 Near resistance zone – breakout likely
📉 Sell Below: ₹1,630 (Trend Reversal)
Stoploss: ₹1,700
Target: ₹1,550
📊 Chart: Daily
📌 Strategy: Resistance Breakout with RSI & Volume Confirmation
💡 Risk-Reward: 1:2 (Good for swing trade)
For Education Purposes Only

ADITYA BIRLA CAPITAL LTD – Trend Reversal Breakout Trade🧠 Technical Highlights:
Downtrend Channel Breakout: Clear breakout from a falling channel pattern
Resistance Break: Strong breakout above supply zone of ₹204–₹210
Volume: Massive volume spike validates bullish strength
RSI: Above 70, indicating strong momentum but not overbought yet
🟢 Buy Setup
Buy Above: ₹219 (today's close confirms breakout)
Stoploss: ₹204 (below the previous resistance/new support)
Target 1: ₹235
Target 2: ₹248
Target 3: ₹260+ (swing/high-risk high-reward)
🔻 Sell/Short Setup (only if reversal)
Sell Below: ₹203
Stoploss: ₹210
Target: ₹190, ₹178
📅 Timeframe: Short-to-Medium Term (2–6 weeks)
📊 Risk-Reward: ~1:2.5
For Education Purposes Only

Equity Research - TATA MOTORS LTD 📈 Buy Zone: ₹670.50 – ₹680.30
🎯 Target: ₹740.00
🛑 Stop Loss: ₹641.70
💹 CMP: ₹680.30
Technical Highlights:
✅ Bullish volume spike
✅ RSI above 60 – strong momentum
✅ Price above 20EMA & 50EMA
✅ Breakout and retest on 15m & 1H chart
✅ Good risk-reward setup
📊 Strategy: Wait for confirmation candle on 15min TF above ₹681 for entry.
📉 Stop loss below recent swing low at ₹641.70.
For Education Purposes Only

Equity Research Report – NEWGEN SOFTWARE TECHNOLOGIES Short-Term View: A strong breakout above key resistance at ₹1,100 with volume surge indicates bullish momentum. Price reclaimed the 50 EMA after consolidation. RSI at 60.87 supports strength; next resistance lies near ₹1,193.90.
Long-Term View: Structurally strong after correction. Sustaining above ₹1,020 (50 EMA) may attract fresh buying. Long-term targets can stretch to ₹1,300+ if earnings and demand trends remain favorable.
Conclusion: Bullish momentum likely to continue both short and long term. Watch for volume confirmation and hold above ₹1,100.
For Education Purpose only

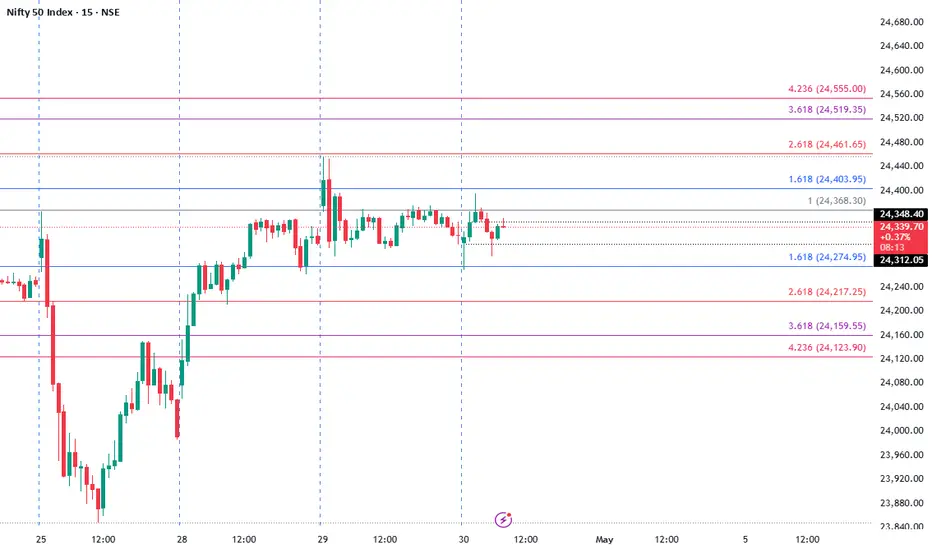
#Nifty 30th April levels checkout is levels #Nifty 30th April levels checkout special my levels
100 percent working levels and giving weekly levels also
check and tell everyone
DIVISLAB: Impulse formationStock is rising in an impulsive manner and currently started it's 5th wave which shall take the prices towards 7000/7600 zone in the coming weeks. On the downside key level is 5400. One should remain bullish as long as prices are trading above this level.

MFSL: Cup & HandleStock has given a breakout of Cup & Handle pattern and retested the neckline in Jan'25. The measured target for the same is coming in the region of 1900. On the downside the key level can be 1080.

EMCURE PHARMA | Approaching Key Resistance | Breakout or Triple ⚙️ Technical Setup Highlights:
Price is testing a resistance zone around ₹1100, which has been rejected twice before (as indicated by black arrows).
Volume has picked up on the recent move up — indicating buying interest.
RSI is turning up from near the 50 level, signaling positive momentum.
📈 Trade Plan:
🔹 If Price Breaks Above ₹1110-1120 with Volume:
Buy above ₹1120 (wait for a breakout candle with volume)
Target 1: ₹1180
Target 2: ₹1240
Stoploss: ₹1070 (just below the breakout level)
🔻 If Price Rejected at ₹1100-1120 Zone Again:
Sell near ₹1100-1110 (on bearish reversal candle confirmation)
Target: ₹1020
Stoploss: ₹1130
🎯 Ideal Strategy:
Wait for confirmation — either a clean breakout above ₹1120 or a rejection signal at resistance. Avoid trading within the zone.
for educational purposes only

ASTRAL LTD | At Key Trendline Resistance | Breakout or Rejection🟢 Buy Recommendation (Breakout Trade)
Entry: Buy only on breakout and daily close above ₹1,420–₹1,430 (above trendline resistance).
Target 1: ₹1,550
Target 2: ₹1,650
Stop Loss: ₹1,320 (below recent consolidation support)
📌 Rationale: If price breaks above the trendline on good volume and closes above ₹1,430, a trend reversal may begin.
🔴 Sell/Short Recommendation (Rejection Trade)
Entry: Sell if the price gets rejected from ₹1,400–₹1,420 and shows a red candle (confirmation).
Target 1: ₹1,280
Target 2: ₹1,180
Stop Loss: ₹1,445 (above the trendline)
📌 Rationale: If the price fails to break the trendline, it could resume the downtrend. RSI is overbought, and sellers might take over.
for educational purposes only

Waaree Energies Ltd (WRTL)🛒 Buy Recommendation
Buy Zone: ₹2,180–₹2,230
The stock is trading close to a support zone near the 23.6% Fib level (₹2,305) and trying to break out of the falling trendline.
RSI has bounced from the oversold region and is near 50, indicating a possible reversal.
🎯 Targets (Short to Medium-Term)
Target 1 – ₹2,585 (38.2% Fibonacci level)
Target 2 – ₹2,810 (50% Fibonacci level)
Target 3 – ₹3,036 (61.8% Fibonacci level – major resistance)
Swing Target – ₹3,766 (100% Fibonacci level – recent high)
🛑 Stop Loss
SL: ₹2,050 (Below recent swing low & below trendline support)
Risk is around ₹180 from entry; ideal for a reward of 1.5x–3x on targets.
🔎 Additional Technical Signals
Volume: Increasing volume on green candles shows buying interest.
RSI: Forming a bullish divergence and heading upward.
Breakout Point: A daily close above ₹2,305 would confirm a breakout of the trendline and strengthen the bullish case.
for educational purposes only

JUSTDIAL LTD Falling Wedge (Bullish breakout)🔁 Chart Analysis Summary
Weekly RSI is reversing from oversold levels and shows bullish divergence.
Volume on breakout candle confirms strength.
Clear breakout above falling wedge indicates a trend reversal.
✅ Buy Recommendation
Buy above: ₹925 (Confirmation of breakout)
Target 1: ₹1,050
Target 2: ₹1,250
Target 3: ₹1,400+ (Long-term potential based on pattern projection)
❌ Stop Loss
SL: ₹840 (Below wedge support & recent low)
for educational purposes only
