FAANG Stocks Index AnalysisThe FAAng Stocks index price didn't break up the 23 level fibonacci and red angle line yet, but took the EMAs lines as support. The Relative Strenght is getting force to 49.2 points so the confirmation is neede if the uptrend continuity is real.
Stockmarkets

BUY UAL 11/10/2021You can buy UAL target 54 stop loss 46.75
money management your responsibility.
I recommend entering a maximum of 10% of the portfolio.
Good luck

Buy LWLG 11/10/2021You can buy LWLG target 13.85 stop loss 7.63
money management your responsibility.
I recommend entering a maximum of 10% of the portfolio.
Good luck

Buy Global Star (GSAT) 8/10/2021You can buy GSAT target 2.4 stop loss 1.19
money management your responsibility.
I recommend entering a maximum of 10% of the portfolio.
Good luck

Buy CISCO system (CSCO) 8/10/2021You can buy Cisco target 59.4 stop loss 52.3
money management your responsibility.
I recommend entering a maximum of 10% of the portfolio.
Good luck

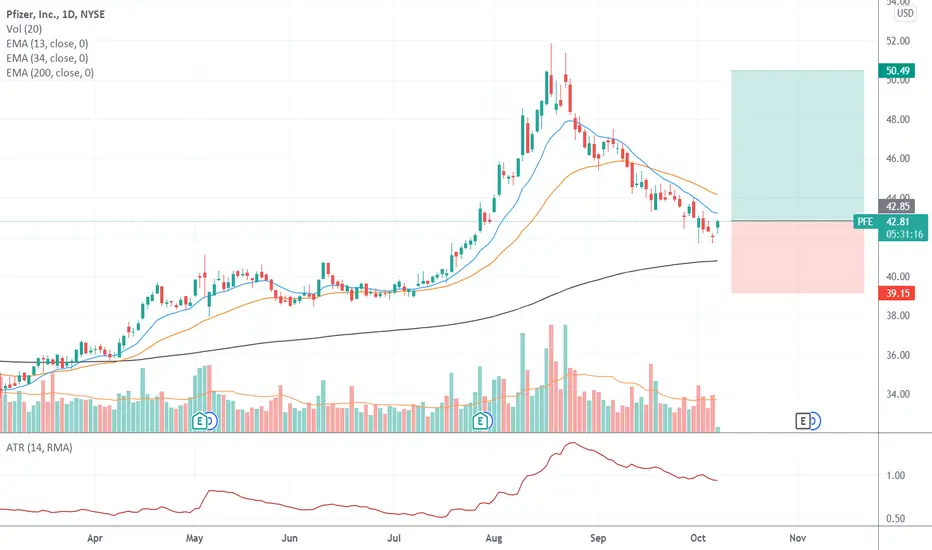
Buy Pfizer (PFE) 7/10/2021You can buy PFIZER target 50.5 stop loss 39.15
money management your responsibility.
I recommend entering a maximum of 10% of the portfolio.
Good luck
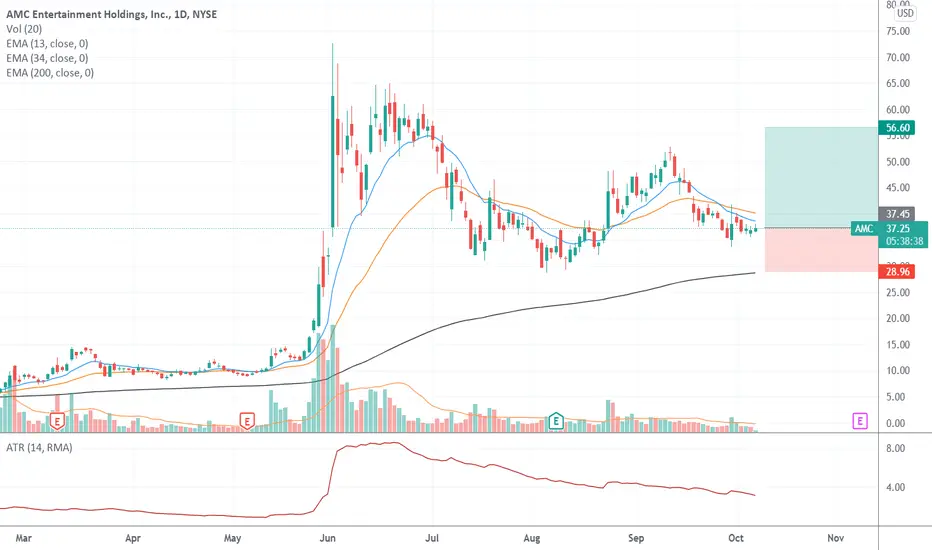
Buy AMC 7/10/2021You can buy AMC target 56.5 stop loss 29
money management your responsibility.
I recommend entering a maximum of 10% of the portfolio.
Good luck
Buy DSKE 27/9/2021You can buy DSKE target 10 stop loss 7.7
money management your responsibility.
I recommend entering a maximum of 10% of the portfolio.
Good luck

Buy ADM 13/9/2021Stock above EXMA 200 and still in uptrend Stock is making higher low and tests the EXMA 13 and EXMA 34 So you can buy target 65 stop loss 57.4 Good luck

Buy BTU 28/9/2021You can buy BTU target 19.1 stop loss 12.42
money management your responsibility.
I recommend entering a maximum of 10% of the portfolio.
Good luck

Buy Ford 14/9/2021Stock above EXMA 200 and still in uptrend and Trading volumes increase with rises
So you can buy target 15.6 stop losses 11.8
Good luck

BUY AGEN 5/10/2021You can buy AGEN target 6.5 stop loss 4.94
money management your responsibility.
I recommend entering a maximum of 10% of the portfolio.
Good luck

BUY LNT 5/10/2021You can buy LNT target 61.45 stop loss 54.32
Money management your responsibility.
I recommend entering a maximum of 10% of the portfolio.
Good luck

SP500 TREND ANALYSISThe price confirmed de down turn crossing EMAs and didn't break up the angle red lineand the 0.38 fibonacci level the RSI is weak with 38.85 points and the pattern is convergent with the trend.

Is the Tadawul All Share Index (TASI) overdue for a correction?The Tadawul All Share Index (TASI), which tracks the performance of all stock listed on The Tadawul, has recorded a 30.34% increase since the beginning of 2021.
However, the TASI is sitting at a peak level, which appears to be a repetition of the previous boom and bust cycle. The TASI was in a comparable position in late 2014 and late 2007, before wiping out more than half its value over the proceeding months. If past performance is any indicator, the TASI might be overdue a correction.
About the Tawadul
The Tadawul (TADAWUL) is the only licensed Stock Exchange in Saudi Arabia, the largest Stock Exchange in the Middle East, and the twelfth largest in the world by market capitalisation. According to Statista, The aggregate market cap of the 200 companies listed on The Tadawul is approximately US $2.6 trillion (July of 2021).
Contributing to an outsized portion of The Tadawul’s market capitalisation is Saudi Aramco (TADAWUL: 2222), the fourth-largest company in the world (market cap as of Sept 2021, US ~$1.9 trillion). Perhaps unsurprisingly, a vast swath of the listings on The Tadawul are companies concerned with crude oil and chemical products. Saudi Basic Industries (TADAWUL: 2010) is the Exchange’s second-largest listing, with a comparatively modest market capitalisation of US $99 billion.
Financial institutions and banking groups help to diversify the offerings of the Stock Exchange. The Exchange’s former largest listings, Al Rajhi Banking & Investment (TADAWUL: 1120) and Saudi National Bank (TADAWUL: 1180 ), are currently the third and fourth largest with market caps between US $70 and US $80 billion.

Buy X (united states steel ) 28/9/2021You can buy X target 28.55 stop loss 20
money management your responsibility.
I recommend entering a maximum of 10% of the portfolio.
Good luck

Buy CLF 28/9/2021You can buy CLF target 25.63 stop loss 18.44
money management your responsibility.
I recommend entering a maximum of 10% of the portfolio.
Good luck

SP500 TRENDThe technical Analysis on SP500 on the price didn't Break up the 0,23 fibonacci levels and tbecame a lateral movment with slight low trend. Meanwhile the EMAs confirmed as support Levels but the RElative stregnth is weak with divergence between the trend and the momentum..

Buy THRY 27/9/2021You can buy THRY target 35.4 stop loss 26
money management your responsibility.
I recommend entering a maximum of 10% of the portfolio.
Good luck

Buy PANL 27/9/2021You can buy PANL target 6.18 stop loss 4.29
money management your responsibility.
I recommend entering a maximum of 10% of the portfolio.
Good luck

Not yet to buyThis stock is one of those which affected immediately by the COVID-19 pandemic. Its fair value is 21.5 $ but there is a strong movement toward 25.5 $. I totally recommend waiting until it breaks 25.5 and sustains it as support for those who want to buy it.

Apple fair value is 366.5 $Based on the cash flow generated by this company, the company stock fair value is 366.5 $.
So this is a good stock that a person can buy and stick to it at least for one year.

Stock-Crypto Update (#38) : EverGrande, China FUD, FED...Here's your weekly update ! Brought to you each weekend with years of track-record history..
Don't forget to hit the like/follow button if you feel like this post deserves it ;)
That's the best way to support me and help pushing this content to other users.
Kindly,
Phil
